|
|
市場調査レポート
商品コード
1637701
北米の地熱発電市場:2031年までの予測 - 地域別分析 - 発電所タイプ別、エンドユーザー別North America Geothermal Power Generation Market Forecast to 2031 - Regional Analysis - by Plant Type (Direct Dry Steam, Flash Steam, and Binary Cycle) and End User (Residential, Commercial, and Industrial) |
||||||
|
|||||||
|
|||||||

| 北米の地熱発電市場:2031年までの予測 - 地域別分析 - 発電所タイプ別、エンドユーザー別 |
|
出版日: 2024年11月22日
発行: The Insight Partners
ページ情報: 英文 82 Pages
納期: 即納可能
|

全表示
- 概要
- 図表
- 目次
北米の地熱発電市場は2023年に27億7,375万米ドルとなり、2031年までには36億8,605万米ドルに達すると予測され、2023年から2031年までのCAGRは3.6%と推定されます。
地熱エネルギーの需要増加と利用が北米の地熱発電市場を後押し
人口増加と工業化に伴う世界のエネルギー需要の増加は、エネルギー生産を必要とします。地熱発電は、この需要を支えるために必要な電力の大部分を供給することができ、信頼できるエネルギー供給に貢献します。さらに、エネルギー安全保障は、地熱発電容量の世界の拡大を促す基本的な要因です。各国は、化石燃料への依存を減らし、経済成長と国家安全保障のための安定したエネルギー供給を確保するために、多様で信頼できるエネルギー源を求めています。地熱発電は、化石燃料に比べて価格変動や供給途絶の影響を受けにくく、安定した一貫したエネルギーを供給します。2000年以降、地熱エネルギー産業は年平均約3.5%のペースで成長し、2021年には16ギガワットの設備容量に達します。2015年から2021年にかけては約5%のわずかな成長がありましたが、それでも世界の再生可能エネルギー設備容量の0.5%にしか影響しません。一方、地熱エネルギーの冷暖房用途は、2015年から2020年の間に約9%という速い伸びを示し、2020年には107ギガワットの熱に達し、世界の再生可能エネルギー冷暖房設備容量の約3%に相当します。したがって、世界中で地熱エネルギーの需要と利用が増加していることが、今後数年間の地熱発電市場の成長を促進すると予想されます。
北米の地熱発電市場概要
北米の地熱発電市場は米国とメキシコに分けられます。北米の地熱発電設備容量は3,628.6MWで、2022年の総発電量は20.5TWhでした。米国は2022年に約78%の最大市場シェアを占め、予測期間中もその優位性を維持すると予想されます。これは、米国で地熱発電所の設置容量が最も大きいことと、過去10年間に持続可能な発電に向けた政府の取り組みや支援が増加していることに起因します。加えて、企業は地熱発電所や地熱発電技術を開発するために戦略的提携、パートナーシップ、協力関係を結んでおり、今後数年間は同市場で事業を展開するプレーヤーにビジネスチャンスをもたらすと予想されます。例えば、2023年11月、Fervo EnergyはGoogleとともに、ネバダ州に3.5MWの拡張地熱システム(EGS)地熱発電所の建設を開始しました。この新しい発電所は、ラスベガスや他の州のデータセンターに電力を供給します。このような重要な取り組みが、今後数年間の地熱発電市場の成長を後押しすると予測されています。
北米の地熱発電市場の収益と2031年までの予測(金額)
北米の地熱発電市場のセグメンテーション
北米の地熱発電市場は、発電所タイプ、エンドユーザー、国に分類されます。
発電所タイプに基づき、北米の地熱発電市場は、ダイレクトドライスチーム、フラッシュスチーム、バイナリーサイクルに区分されます。2023年には、フラッシュスチーム・セグメントが最大の市場シェアを占めています。
エンドユーザー別では、北米の地熱発電市場は住宅、商業、工業に分類されます。2023年に最大の市場シェアを占めたのは産業用セグメントでした。
国別では、北米の地熱発電市場は米国とメキシコに区分されます。2023年の北米の地熱発電市場シェアは米国が独占しました。
Northern California Power Agency、Turboden SpA、Toshiba Energy Systems and Solutions Corp、Berkshire Hathaway Inc、NIBE Industrier AB、General Electric Co、Fuji Electric Co Ltd、Carrier Global Corp、Danfoss AS.は北米の地熱発電市場で事業を展開している主要企業です。
目次
第1章 イントロダクション
第2章 エグゼクティブサマリー
- 主要洞察
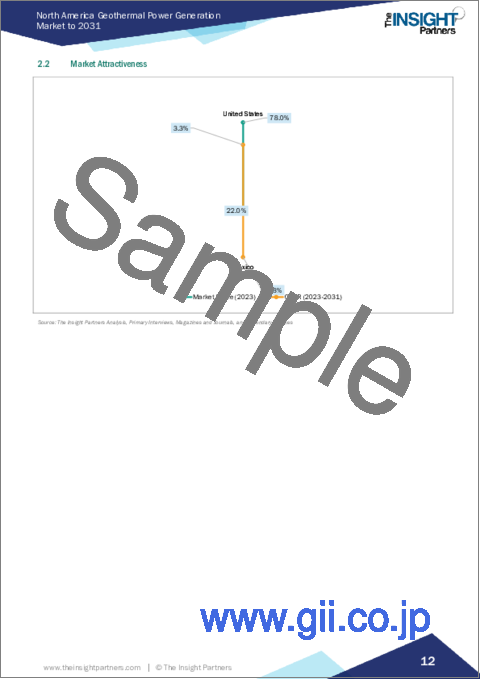
- 市場の魅力
第3章 調査手法
- 2次調査
- 1次調査
- 仮説の策定
- マクロ経済要因分析
- 基礎数値の開発
- データの三角測量
- 国レベルのデータ
第4章 北米の地熱発電市場情勢
- PEST分析
- エコシステム分析
- 機器・部品サプライヤー
- 地熱発電事業者/製品メーカー
- エンドユーザー
第5章 北米の地熱発電市場:主要市場力学
- 市場促進要因
- 地熱エネルギーの需要と利用の増加
- 地熱発電への投資と政府支援の急増
- 市場抑制要因
- 高い投資コスト
- 市場機会
- 新興経済国における未開発の地熱ポテンシャル
- 今後の動向
- 将来のエネルギー転換における地熱発電の役割の増大
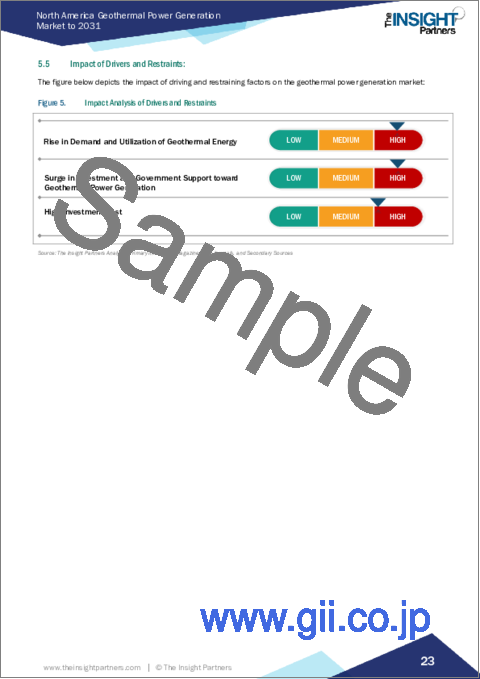
- 促進要因と抑制要因の影響
第6章 地熱発電市場-北米分析
- 北米の地熱発電市場概要
- 地熱発電市場の収益、2021年~2031年
- 地熱発電市場の予測分析
第7章 北米の地熱発電市場分析:発電所タイプ別
- 直接乾燥蒸気
- フラッシュ蒸気
- バイナリーサイクル
第8章 北米の地熱発電市場分析:エンドユーザー別
- 住宅用
- 商業用
- 産業用
第9章 北米の地熱発電市場:国別分析
- 北米
- 米国
- メキシコ
第10章 競合情勢
- ヒートマップ分析:主要企業別
- 企業のポジショニングと集中度
第11章 業界情勢
- 市場イニシアティブ
- 合併と買収
第12章 企業プロファイル
- Northern California Power Agency
- Turboden SpA
- Toshiba Energy Systems & Solutions Corp
- Berkshire Hathaway Inc
- NIBE Industrier AB
- General Electric Co
- Fuji Electric Co Ltd
- Carrier Global Corp
- Danfoss AS
第13章 付録
List Of Tables
- Table 1. North America Geothermal Power Generation Market Segmentation
- Table 2. Geothermal Power Generation Market - Revenue and Forecast to 2031 (US$ Million)
- Table 3. Geothermal Power Generation Market - Revenue and Forecast to 2031 (US$ Million) - by Plant Type
- Table 4. Geothermal Power Generation Market - Revenue and Forecast to 2031 (US$ Million) - by End User
- Table 5. North America: Geothermal Power Generation Market - Revenue and Forecast to 2031 (US$ Million) - by Country
- Table 6. United States: Geothermal Power Generation Market - Revenue and Forecast to 2031 (US$ Million) - by Plant Type
- Table 7. United States: Geothermal Power Generation Market - Revenue and Forecast to 2031 (US$ Million) - by End User
- Table 8. Mexico: Geothermal Power Generation Market - Revenue and Forecast to 2031 (US$ Million) - by Plant Type
- Table 9. Mexico: Geothermal Power Generation Market - Revenue and Forecast to 2031 (US$ Million) - by End User
List Of Figures
- Figure 1. North America Geothermal Power Generation Market Segmentation, by Country
- Figure 2. PEST Analysis
- Figure 3. Ecosystem Analysis
- Figure 4. North America Geothermal Power Generation Market - Key Market Dynamics
- Figure 5. Impact Analysis of Drivers and Restraints
- Figure 6. Geothermal Power Generation Market Revenue, 2021-2031 (US$ Million)
- Figure 7. Geothermal Power Generation Market Share (%) - by Plant Type (2023 and 2031)
- Figure 8. Direct Dry Steam: Geothermal Power Generation Market - Revenue and Forecast to 2031 (US$ Million)
- Figure 9. Flash Steam: Geothermal Power Generation Market - Revenue and Forecast to 2031 (US$ Million)
- Figure 10. Binary Cycle: Geothermal Power Generation Market - Revenue and Forecast to 2031 (US$ Million)
- Figure 11. Geothermal Power Generation Market Share (%) - by End User (2023 and 2031)
- Figure 12. Residential: Geothermal Power Generation Market - Revenue and Forecast to 2031 (US$ Million)
- Figure 13. Commercial: Geothermal Power Generation Market - Revenue and Forecast to 2031 (US$ Million)
- Figure 14. Industrial: Geothermal Power Generation Market - Revenue and Forecast to 2031 (US$ Million)
- Figure 15. North America Geothermal Power Generation Market, by Key Countries - Revenue, (2023 US$ Million)
- Figure 16. North America: Geothermal Power Generation Market Breakdown, by Key Countries, 2023 and 2031 (%)
- Figure 17. United States: Geothermal Power Generation Market - Revenue and Forecast to 2031 (US$ Million)
- Figure 18. Mexico: Geothermal Power Generation Market - Revenue and Forecast to 2031 (US$ Million)
- Figure 19. Heat Map Analysis by Key Players
- Figure 20. Company Positioning and Concentration
The North America geothermal power generation market was valued at US$ 2,773.75 million in 2023 and is expected to reach US$ 3,686.05 million by 2031; it is estimated to register a CAGR of 3.6% from 2023 to 2031.
Rise in Demand and Utilization of Geothermal Energy Fuels North America Geothermal Power Generation Market
The global rise in energy demand, driven by population growth and industrialization, necessitates energy production. Geothermal power can provide a significant portion of the electricity needed to support this demand, contributing to a reliable energy supply. In addition, energy security is a fundamental factor driving the global expansion of geothermal power capacity. Nations seek diverse and reliable energy sources to reduce their dependence on fossil fuels, ensuring a stable energy supply for economic growth and national security. Geothermal power provides steady and consistent energy, less susceptible to price fluctuations and supply disruptions compared to fossil fuels. Since 2000, the geothermal energy industry has grown at an average rate of approximately 3.5% per year to reach an installed capacity of 16 gigawatts of electricity in 2021. There was a slight growth of ~5% between 2015 and 2021, but this still only impacted 0.5% of the world's installed renewable energy capacity. Meanwhile, geothermal energy's heating and cooling applications grew faster, by about 9% between 2015 and 2020, reaching 107 gigawatts of thermal heat in 2020, representing ~3% of the world's installed renewable heating and cooling capacity. Hence, a rise in the demand and utilization of geothermal energy across the globe is expected to drive the geothermal power generation market growth in the coming years.
North America Geothermal Power Generation Market Overview
The North America geothermal power generation market is divided into the US and Mexico. North America has a total geothermal power installation capacity of 3,628.6 MW and generated ~20.5 TWh of total geothermal electricity in 2022. The US held the largest market share of approximately 78% in 2022 and is also expected to maintain its dominance during the forecast period. This is owing to the highest installation capacity of geothermal power plants in the US and increasing government initiatives or support toward sustainable power production in the last 10 years. In addition, the companies are engaged in strategic alliances, partnerships, and collaborations to develop geothermal power plants or technologies, which are anticipated to create opportunities for players operating in the market in the coming years. For instance, in November 2023, Fervo Energy, along with Google, initiated the construction of a 3.5 MW enhanced geothermal system (EGS) geothermal plant in Nevada. This new plant will provide power to data centers in Las Vegas and other states. Such key initiatives are projected to boost the geothermal power generation market growth in the coming years.
North America Geothermal Power Generation Market Revenue and Forecast to 2031 (US$ Million)
North America Geothermal Power Generation Market Segmentation
The North America geothermal power generation market is categorized into plant type, end user, and country.
Based on plant type, the North America geothermal power generation market is segmented into direct dry steam, flash steam, and binary cycle. The flash steam segment held the largest market share in 2023.
In terms of end user, the North America geothermal power generation market is categorized into residential, commercial, and industrial. The industrial segment held the largest market share in 2023.
By country, the North America geothermal power generation market is segmented into the US and Mexico. The US dominated the North America geothermal power generation market share in 2023.
Northern California Power Agency, Turboden SpA, Toshiba Energy Systems and Solutions Corp, Berkshire Hathaway Inc, NIBE Industrier AB, General Electric Co, Fuji Electric Co Ltd, Carrier Global Corp, and Danfoss AS. are some of the leading companies operating in the North America geothermal power generation market.
Table Of Contents
1. Introduction
- 1.1 The Insight Partners Research Report Guidance
- 1.2 Market Segmentation
2. Executive Summary
- 2.1 Key Insights
- 2.2 Market Attractiveness
3. Research Methodology
- 3.1 Secondary Research
- 3.2 Primary Research
- 3.2.1 Hypothesis formulation:
- 3.2.2 Macro-economic factor analysis:
- 3.2.3 Developing base number:
- 3.2.4 Data Triangulation:
- 3.2.5 Country level data:
4. North America Geothermal Power Generation Market Landscape
- 4.1 Overview
- 4.2 PEST Analysis
- 4.3 Ecosystem Analysis
- 4.3.1 Equipment or Component Suppliers
- 4.3.2 Geothermal Power Plant Operators/Product Manufacturers
- 4.3.3 End User
5. North America Geothermal Power Generation Market - Key Market Dynamics
- 5.1 Market Drivers
- 5.1.1 Rise in Demand and Utilization of Geothermal Energy
- 5.1.2 Surge in Investment and Government Support toward Geothermal Power Generation
- 5.2 Market Restraints
- 5.2.1 High Investment Cost
- 5.3 Market Opportunities
- 5.3.1 Untapped Geothermal Potential in Emerging Economies
- 5.4 Future Trends
- 5.4.1 Growing Role of Geothermal Power in Future Energy Transition
- 5.5 Impact of Drivers and Restraints:
6. Geothermal Power Generation Market - North America Analysis
- 6.1 North America Geothermal Power Generation Market Overview
- 6.2 Geothermal Power Generation Market Revenue, 2021-2031 (US$ Million)
- 6.3 Geothermal Power Generation Market Forecast Analysis
7. North America Geothermal Power Generation Market Analysis - by Plant Type
- 7.1 Direct Dry Steam
- 7.1.1 Overview
- 7.1.2 Direct Dry Steam: Geothermal Power Generation Market - Revenue and Forecast to 2031 (US$ Million)
- 7.2 Flash Steam
- 7.2.1 Overview
- 7.2.2 Flash Steam: Geothermal Power Generation Market - Revenue and Forecast to 2031 (US$ Million)
- 7.3 Binary Cycle
- 7.3.1 Overview
- 7.3.2 Binary Cycle: Geothermal Power Generation Market - Revenue and Forecast to 2031 (US$ Million)
8. North America Geothermal Power Generation Market Analysis - by End User
- 8.1 Residential
- 8.1.1 Overview
- 8.1.2 Residential: Geothermal Power Generation Market - Revenue and Forecast to 2031 (US$ Million)
- 8.2 Commercial
- 8.2.1 Overview
- 8.2.2 Commercial: Geothermal Power Generation Market - Revenue and Forecast to 2031 (US$ Million)
- 8.3 Industrial
- 8.3.1 Overview
- 8.3.2 Industrial: Geothermal Power Generation Market - Revenue and Forecast to 2031 (US$ Million)
9. North America Geothermal Power Generation Market - Country Analysis
- 9.1 North America
- 9.1.1 North America: Geothermal Power Generation Market Breakdown, by Key Country, 2023 and 2031 (%)
- 9.1.1.1 North America: Geothermal Power Generation Market - Revenue and Forecast Analysis - by Country
- 9.1.1.2 United States: Geothermal Power Generation Market - Revenue and Forecast to 2031 (US$ Million)
- 9.1.1.2.1 United States: Geothermal Power Generation Market Breakdown, by Plant Type
- 9.1.1.2.2 United States: Geothermal Power Generation Market Breakdown, by End User
- 9.1.1.3 Mexico: Geothermal Power Generation Market - Revenue and Forecast to 2031 (US$ Million)
- 9.1.1.3.1 Mexico: Geothermal Power Generation Market Breakdown, by Plant Type
- 9.1.1.3.2 Mexico: Geothermal Power Generation Market Breakdown, by End User
- 9.1.1 North America: Geothermal Power Generation Market Breakdown, by Key Country, 2023 and 2031 (%)
10. Competitive Landscape
- 10.1 Heat Map Analysis by Key Players
- 10.2 Company Positioning and Concentration
11. Industry Landscape
- 11.1 Overview
- 11.2 Market Initiative
- 11.3 Merger and Acquisition
12. Company Profiles
- 12.1 Northern California Power Agency
- 12.1.1 Key Facts
- 12.1.2 Business Description
- 12.1.3 Products and Services
- 12.1.4 Financial Overview
- 12.1.5 SWOT Analysis
- 12.1.6 Key Developments
- 12.2 Turboden SpA
- 12.2.1 Key Facts
- 12.2.2 Business Description
- 12.2.3 Products and Services
- 12.2.4 Financial Overview
- 12.2.5 SWOT Analysis
- 12.2.6 Key Developments
- 12.3 Toshiba Energy Systems & Solutions Corp
- 12.3.1 Key Facts
- 12.3.2 Business Description
- 12.3.3 Products and Services
- 12.3.4 Financial Overview
- 12.3.5 SWOT Analysis
- 12.3.6 Key Developments
- 12.4 Berkshire Hathaway Inc
- 12.4.1 Key Facts
- 12.4.2 Business Description
- 12.4.3 Products and Services
- 12.4.4 Financial Overview
- 12.4.5 SWOT Analysis
- 12.4.6 Key Developments
- 12.5 NIBE Industrier AB
- 12.5.1 Key Facts
- 12.5.2 Business Description
- 12.5.3 Products and Services
- 12.5.4 Financial Overview
- 12.5.5 SWOT Analysis
- 12.5.6 Key Developments
- 12.6 General Electric Co
- 12.6.1 Key Facts
- 12.6.2 Business Description
- 12.6.3 Products and Services
- 12.6.4 Financial Overview
- 12.6.5 SWOT Analysis
- 12.6.6 Key Developments
- 12.7 Fuji Electric Co Ltd
- 12.7.1 Key Facts
- 12.7.2 Business Description
- 12.7.3 Products and Services
- 12.7.4 Financial Overview
- 12.7.5 SWOT Analysis
- 12.7.6 Key Developments
- 12.8 Carrier Global Corp
- 12.8.1 Key Facts
- 12.8.2 Business Description
- 12.8.3 Products and Services
- 12.8.4 Financial Overview
- 12.8.5 SWOT Analysis
- 12.8.6 Key Developments
- 12.9 Danfoss AS
- 12.9.1 Key Facts
- 12.9.2 Business Description
- 12.9.3 Products and Services
- 12.9.4 Financial Overview
- 12.9.5 SWOT Analysis
- 12.9.6 Key Developments
13. Appendix
- 13.1 About The Insight Partners

