|
|
市場調査レポート
商品コード
1597164
アジア太平洋地域のARウェイブガイド市場:2031年までの予測 - 地域別分析 - タイプ別、用途別Asia Pacific AR Waveguide Market Forecast to 2031 - Regional Analysis - by Type (Geometric Waveguide, Holographic Waveguide, and Diffractive Waveguide) and Application (Consumer Electronics, Industrial, Military, and Others) |
||||||

|
|||||||
|
|||||||

| アジア太平洋地域のARウェイブガイド市場:2031年までの予測 - 地域別分析 - タイプ別、用途別 |
|
出版日: 2024年10月03日
発行: The Insight Partners
ページ情報: 英文 73 Pages
納期: 即納可能
|

全表示
- 概要
- 図表
- 目次
アジア太平洋地域のARウェイブガイド市場は、2023年に1億7,249万米ドルと評価され、2031年には3億3,714万米ドルに達すると予測され、2023年から2031年までのCAGRは8.7%を記録すると予測されています。
ARデバイス設計の強化がアジア太平洋地域のARウェイブガイド市場を後押し
産業やメディア&エンターテインメントなどの分野でAR技術の採用が進むにつれて、優れた性能を提供し、現在のソリューションの限界に対処する高度なディスプレイ技術へのニーズが高まっています。体積ホログラフィック光ウェイブガイドの統合は、ARデバイスの性能とデザインの強化に役立ち、ARウェアラブルソリューションやポータブルソリューションに対する消費者の嗜好の高まりに対応します。これにより、ARデバイス設計の革新が促進されます。体積ホログラフィック光ウェイブガイドは、ARデバイス設計においていくつかの利点を提供します。光学性能に妥協することなく、軽量でコンパクトなARデバイスの開発を可能にします。これにより、快適で没入感の高いユーザー体験を実現できます。また、ウェイブガイドにホログラフィック素子を使用することで、よりリアルで魅力的なAR体験を実現する上で極めて重要な要素である広い視野が得られます。このように、ARデバイス設計の強化は、予測期間中にARウェイブガイド市場の成長に多くの機会を創出すると予測されています。
アジア太平洋地域のARウェイブガイド市場概要
アジア太平洋地域のARウェイブガイド市場は、オーストラリア、インド、中国、日本、韓国、その他アジア太平洋地域に区分されます。ARウェイブガイドモジュールは、ヘルスケア、自動車、航空宇宙産業でAR技術の導入が拡大しているため、高い需要があります。インド、韓国、日本では、AR技術への支出が増加し、洗練されたディスプレイソリューションへの需要が急増しています。日本、韓国、中国を含む国々は、ARウェイブガイド技術を軍事作戦に広く取り入れています。ARウェイブガイド技術は、兵士の状況認識、精度、リアルタイムの戦術的インテリジェンスの向上に役立つからです。さらに、中国では様々な新興企業が水中ARゴーグルの開発に携わっています。例えば、2022年1月、中国の拡張現実ビジネスを手がけるGuangli Technologyは、シリーズAラウンドで1億5,700万米ドル以上を調達しました。この資金は、消費者向けARスマートグラス市場の拡大、ライトフィールド技術とホログラフィー技術の開発、生産能力の増強に充てられます。同社は、次世代アイテムのイントロダクションを加速させ、事業を強化する計画です。
さらに、地域全体のプレーヤーがARウェイブガイドの製造を増やすために協力しています。例えば、2024年1月、DigiLens Inc.はインドのKaynes Technology India Limitedとウェイブガイド製造の規模を拡大するために提携しました。ケインズ・テクノロジー社は、宇宙研究、防衛、航空宇宙、鉄道、ヘルスケア、自動車、その他の商業分野向けの電子部品製造のプロバイダーであり、DigiLens社のライセンシーとして、DigiLens社の主力製品である拡張現実(AR)デバイス「DigiLens ARGO」のインドでの提供を支援するためにウェイブガイド製造を拡大する戦略的な立場にあります。Kaynes TechnologyとDigiLensは、Kaynes Technologyの100%子会社であるKaynes Semicon Pvt LtdのハイデラバードにあるGreen Field工場で協力します。この地域のこのような事例は、ARウェイブガイド市場の成長を促進します。
アジア太平洋地域のARウェイブガイド市場の収益と2031年までの予測(百万米国ドル)
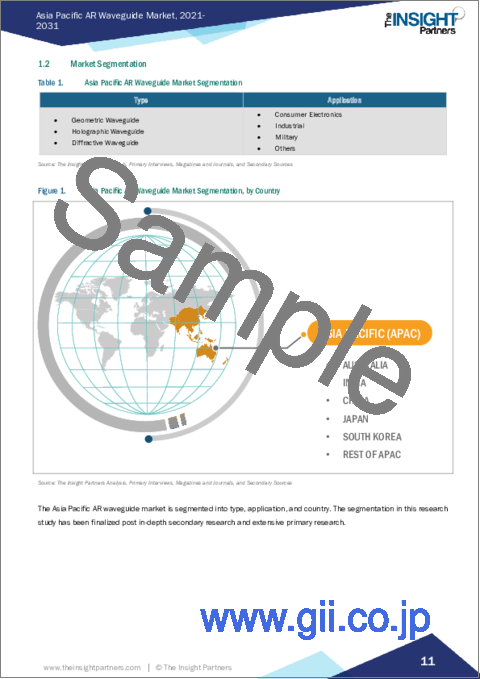
アジア太平洋地域のARウェイブガイド市場セグメンテーション
アジア太平洋地域のARウェイブガイド市場は、タイプ、用途、国に分類されます。
タイプ別では、アジア太平洋地域のARウェイブガイド市場は、幾何ウェイブガイド、ホログラフィックウェイブガイド、回折ウェイブガイドに区分されます。幾何ウェイブガイドセグメントが2023年に最大の市場シェアを占めました。
用途別では、アジア太平洋地域のARウェイブガイド市場は、家庭用エレクトロニクス、産業用、軍事用、その他に区分されます。家庭用電子機器セグメントが2023年に最大の市場シェアを占めました。
国別では、アジア太平洋地域のARウェイブガイド市場は、中国、日本、インド、オーストラリア、韓国、その他アジア太平洋地域に区分されます。2023年のアジア太平洋地域のARウェイブガイド市場シェアは中国が独占。
Zhejiang Crystal-Optech Co Ltd、Dispelix、Goertek Inc、LetinAR Inc、Lumus、Optinvent、Shenzhen Longjing Optoelectronicsは、アジア太平洋地域のARウェイブガイド市場で事業展開している主要企業です。
目次
第1章 イントロダクション
第2章 エグゼクティブサマリー
- 主要洞察
- 市場の魅力
第3章 調査手法
- 2次調査
- 1次調査
- 仮説の策定
- マクロ経済要因分析
- 基礎数値の作成
- データの三角測量
- 国レベルのデータ
第4章 アジア太平洋地域のARウェイブガイド市場情勢
- PEST分析
- エコシステム分析
第5章 アジア太平洋地域のARウェイブガイド市場:主要市場力学
- 市場促進要因
- ARベースのデバイスに対する需要の増加
- 様々な産業におけるAR応用の増加
- ARウェアラブルの需要増加
- 市場抑制要因
- 高い製造コスト
- 視野の狭さとそれに伴う課題
- 市場機会
- 光ウェイブガイド技術の進歩
- ARデバイス設計の強化
- 今後の動向
- ゲーム業界におけるARベースデバイスの需要拡大
- 促進要因と抑制要因の影響
第6章 ARウェイブガイド市場:アジア太平洋地域市場分析
- アジア太平洋地域のARウェイブガイド市場売上高、2021-2031年
- ARウェイブガイド市場の予測分析
第7章 アジア太平洋地域のARウェイブガイド市場分析:タイプ別
- 幾何学的ウェイブガイド
- ホログラフィックウェイブガイド
- 回折ウェイブガイド
第8章 アジア太平洋地域のARウェイブガイド市場分析:用途別
- 消費者用電子機器
- 産業用
- 軍事用
- その他
第9章 アジア太平洋地域のARウェイブガイド市場:国別分析
- アジア太平洋地域
- 中国
- 日本
- インド
- オーストラリア
- 韓国
- アジア太平洋地域のその他諸国
第10章 競合情勢
- 主要企業によるヒートマップ分析
- 企業のポジショニングと集中度
第11章 業界情勢
- 市場イニシアティブ
- 製品開発
- 合併と買収
第12章 企業プロファイル
- Zhejiang Crystal-Optech Co., Ltd.
- Dispelix
- Goertek Inc
- LetinAR Inc.
- Optinvent
- Shenzhen Longjing Optoelectronics
第13章 付録
List Of Tables
- Table 1. Asia Pacific AR Waveguide Market Segmentation
- Table 2. List of Vendors
- Table 3. AR Waveguide Market - Revenue and Forecast to 2031 (US$ Million)
- Table 4. AR Waveguide Market - Revenue and Forecast to 2031 (US$ Million) - by Type
- Table 5. AR Waveguide Market - Revenue and Forecast to 2031 (US$ Million) - by Application
- Table 6. Asia Pacific: AR Waveguide Market - Revenue and Forecast to 2031(US$ Million) - by Country
- Table 7. China: AR Waveguide Market - Revenue and Forecast to 2031(US$ Million) - by Type
- Table 8. China: AR Waveguide Market - Revenue and Forecast to 2031(US$ Million) - by Application
- Table 9. Japan: AR Waveguide Market - Revenue and Forecast to 2031(US$ Million) - by Type
- Table 10. Japan: AR Waveguide Market - Revenue and Forecast to 2031(US$ Million) - by Application
- Table 11. India: AR Waveguide Market - Revenue and Forecast to 2031(US$ Million) - by Type
- Table 12. India: AR Waveguide Market - Revenue and Forecast to 2031(US$ Million) - by Application
- Table 13. Australia: AR Waveguide Market - Revenue and Forecast to 2031(US$ Million) - by Type
- Table 14. Australia: AR Waveguide Market - Revenue and Forecast to 2031(US$ Million) - by Application
- Table 15. South Korea: AR Waveguide Market - Revenue and Forecast to 2031(US$ Million) - by Type
- Table 16. South Korea: AR Waveguide Market - Revenue and Forecast to 2031(US$ Million) - by Application
- Table 17. Rest of APAC: AR Waveguide Market - Revenue and Forecast to 2031(US$ Million) - by Type
- Table 18. Rest of APAC: AR Waveguide Market - Revenue and Forecast to 2031(US$ Million) - by Application
- Table 19. Heat Map Analysis by Key Players
List Of Figures
- Figure 1. Asia Pacific AR Waveguide Market Segmentation, by Country
- Figure 2. PEST Analysis
- Figure 3. Ecosystem Analysis
- Figure 4. AR Waveguide Market - Key Market Dynamics
- Figure 5. Impact Analysis of Drivers and Restraints
- Figure 6. AR Waveguide Market Revenue (US$ Million), 2021-2031
- Figure 7. AR Waveguide Market Share (%) - by Type (2023 and 2031)
- Figure 8. Geometric Waveguide: AR Waveguide Market - Revenue and Forecast to 2031 (US$ Million)
- Figure 9. Holographic Waveguide: AR Waveguide Market - Revenue and Forecast to 2031 (US$ Million)
- Figure 10. Diffractive Waveguide: AR Waveguide Market - Revenue and Forecast to 2031 (US$ Million)
- Figure 11. AR Waveguide Market Share (%) - by Application (2023 and 2031)
- Figure 12. Consumer Electronics: AR Waveguide Market - Revenue and Forecast to 2031 (US$ Million)
- Figure 13. Industrial: AR Waveguide Market - Revenue and Forecast to 2031 (US$ Million)
- Figure 14. Military: AR Waveguide Market - Revenue and Forecast to 2031 (US$ Million)
- Figure 15. Others: AR Waveguide Market - Revenue and Forecast to 2031 (US$ Million)
- Figure 16. Asia Pacific AR Waveguide Market, by Key Countries - Revenue (2023) (US$ Million)
- Figure 17. Asia Pacific: AR Waveguide Market Breakdown, by Key Countries, 2023 and 2031 (%)
- Figure 18. China: AR Waveguide Market - Revenue and Forecast to 2031(US$ Million)
- Figure 19. Japan: AR Waveguide Market - Revenue and Forecast to 2031(US$ Million)
- Figure 20. India: AR Waveguide Market - Revenue and Forecast to 2031(US$ Million)
- Figure 21. Australia: AR Waveguide Market - Revenue and Forecast to 2031(US$ Million)
- Figure 22. South Korea: AR Waveguide Market - Revenue and Forecast to 2031(US$ Million)
- Figure 23. Rest of APAC: AR Waveguide Market - Revenue and Forecast to 2031(US$ Million)
- Figure 24. Company Positioning & Concentration
The Asia Pacific AR waveguide market was valued at US$ 172.49 million in 2023 and is expected to reach US$ 337.14 million by 2031; it is estimated to record a CAGR of 8.7% from 2023 to 2031.
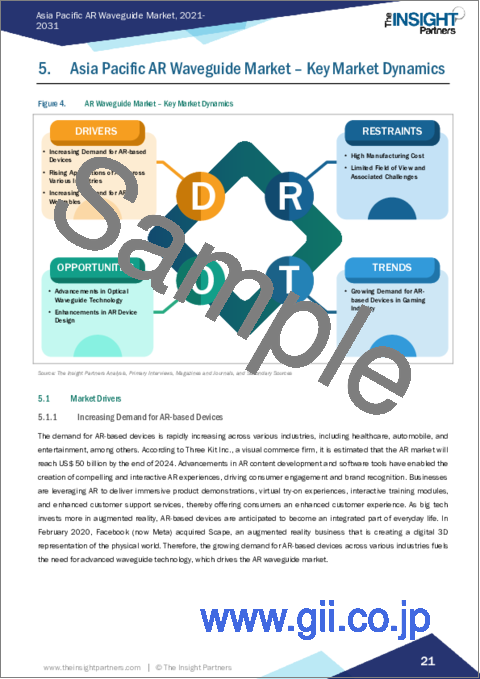
Enhancements in AR Device Design Boost Asia Pacific AR Waveguide Market
With the increasing adoption of AR technology in sectors such as industrial and media & entertainment, there is an increased need for advanced display technologies that offer superior performance and address the limitations of current solutions. The integration of volume holographic optical waveguides helps enhance the performance and design of AR devices, catering to the increasing consumer preference for AR wearable and portable solutions. This fosters innovation in AR device design. Volume holographic optical waveguides offer several advantages in AR device design. They enable the development of lightweight and compact AR devices without compromising on optical performance. This allows for comfortable and enhanced immersive user experiences. The use of holographic elements in waveguides also provides wider fields of view, which is a crucial factor in creating a more realistic and engaging AR experience. Thus, enhancements in AR device design are anticipated to create numerous opportunities for the AR waveguide market growth during the forecast period.
Asia Pacific AR Waveguide Market Overview
The Asia Pacific AR waveguide market is segmented into Australia, India, China, Japan, South Korea, and the Rest of Asia Pacific. AR optical waveguide modules are in high demand due to the growing implementation of AR technology in the healthcare, automotive, and aerospace industries. There is a rise in expenditures on AR technology and a surge in demand for sophisticated display solutions in India, South Korea, and Japan. Countries, including Japan, South Korea, and China, are widely incorporating AR waveguide technology into their military operations, as it helps improve situational awareness, precision, and real-time tactical intelligence for soldiers. Further, various startups in China are involved in the development of underwater AR goggles. For example, in January 2022, Guangli Technology, a Chinese augmented reality business, raised more than US$ 157 million in a Series A round. The funds will be used to expand the consumer AR smart glasses market, develop light field and holography technologies, and increase production capacity. The corporation plans to accelerate the introduction of next-generation items to boost its business.
Moreover, players across the region are collaborating to increase the manufacturing of AR waveguides. For example, in January 2024, DigiLens Inc. collaborated with India's Kaynes Technology India Limited to scale waveguide manufacturing. Kaynes Technology, a provider of electronic component manufacturing for the space research, defense, aerospace, railway, healthcare, automotive, and other commercial sectors, is strategically positioned as a DigiLens licensee to scale waveguide manufacturing to aid in the delivery of DigiLens' flagship Augmented Reality (AR) device-the DigiLens ARGO-in India. Kaynes Technology and DigiLens will work together at Kaynes Semicon Pvt Ltd, a 100% subsidiary of Kaynes Technology, in their Green Field plant in Hyderabad. Such instances in the region drive then growth of the AR waveguide market.
Asia Pacific AR Waveguide Market Revenue and Forecast to 2031 (US$ Million)
Asia Pacific AR Waveguide Market Segmentation
The Asia Pacific AR waveguide market is categorized into type, application, and country.
Based on type, the Asia Pacific AR waveguide market is segmented into geometric waveguide, holographic waveguide, and diffractive waveguide. The geometric waveguide segment held the largest market share in 2023.
By application, the Asia Pacific AR waveguide market is segmented into consumer electronics, industrial, military, and others. The consumer electronics segment held the largest market share in 2023.
By country, the Asia Pacific AR waveguide market is segmented into China, Japan, India, Australia, South Korea, and the Rest of Asia Pacific. China dominated the Asia Pacific AR waveguide market share in 2023.
Zhejiang Crystal-Optech Co Ltd, Dispelix, Goertek Inc, LetinAR Inc, Lumus, Optinvent, and Shenzhen Longjing Optoelectronics are some of the leading companies operating in the Asia Pacific AR waveguide market.
Table Of Contents
1. Introduction
- 1.1 The Insight Partners Research Report Guidance
- 1.2 Market Segmentation
2. Executive Summary
- 2.1 Key Insights
- 2.2 Market Attractiveness
3. Research Methodology
- 3.1 Secondary Research
- 3.2 Primary Research
- 3.2.1 Hypothesis formulation:
- 3.2.2 Macro-economic factor analysis:
- 3.2.3 Developing base number:
- 3.2.4 Data Triangulation:
- 3.2.5 Country level data:
4. Asia Pacific AR Waveguide Market Landscape
- 4.1 Overview
- 4.2 PEST Analysis
- 4.3 Ecosystem Analysis
5. Asia Pacific AR Waveguide Market - Key Market Dynamics
- 5.1 Market Drivers
- 5.1.1 Increasing Demand for AR-based Devices
- 5.1.2 Rising Applications of AR Across Various Industries
- 5.1.3 Increasing Demand for AR Wearables
- 5.2 Market Restraints
- 5.2.1 High Manufacturing Cost
- 5.2.2 Limited Field of View and Associated Challenges
- 5.3 Market Opportunities
- 5.3.1 Advancements in Optical Waveguide Technology
- 5.3.2 Enhancements in AR Device Design
- 5.4 Future Trends
- 5.4.1 Growing Demand for AR-based Devices in Gaming Industry
- 5.5 Impact of Drivers and Restraints:
6. AR Waveguide Market - Asia Pacific Market Analysis
- 6.1 Asia Pacific AR Waveguide Market Revenue (US$ Million), 2021-2031
- 6.2 AR Waveguide Market Forecast Analysis
7. Asia Pacific AR Waveguide Market Analysis - by Type
- 7.1 Geometric Waveguide
- 7.1.1 Overview
- 7.1.2 Geometric Waveguide: AR Waveguide Market - Revenue and Forecast to 2031 (US$ Million)
- 7.2 Holographic Waveguide
- 7.2.1 Overview
- 7.2.2 Holographic Waveguide: AR Waveguide Market - Revenue and Forecast to 2031 (US$ Million)
- 7.3 Diffractive Waveguide
- 7.3.1 Overview
- 7.3.2 Diffractive Waveguide: AR Waveguide Market - Revenue and Forecast to 2031 (US$ Million)
8. Asia Pacific AR Waveguide Market Analysis - by Application
- 8.1 Consumer Electronics
- 8.1.1 Overview
- 8.1.2 Consumer Electronics: AR Waveguide Market - Revenue and Forecast to 2031 (US$ Million)
- 8.2 Industrial
- 8.2.1 Overview
- 8.2.2 Industrial: AR Waveguide Market - Revenue and Forecast to 2031 (US$ Million)
- 8.3 Military
- 8.3.1 Overview
- 8.3.2 Military: AR Waveguide Market - Revenue and Forecast to 2031 (US$ Million)
- 8.4 Others
- 8.4.1 Overview
- 8.4.2 Others: AR Waveguide Market - Revenue and Forecast to 2031 (US$ Million)
9. Asia Pacific AR Waveguide Market - Country Analysis
- 9.1 Asia Pacific
- 9.1.1 Asia Pacific: AR Waveguide Market - Revenue and Forecast Analysis - by Country
- 9.1.1.1 Asia Pacific: AR Waveguide Market - Revenue and Forecast Analysis - by Country
- 9.1.1.2 China: AR Waveguide Market - Revenue and Forecast to 2031 (US$ Million)
- 9.1.1.2.1 China: AR Waveguide Market Breakdown, by Type
- 9.1.1.2.2 China: AR Waveguide Market Breakdown, by Application
- 9.1.1.3 Japan: AR Waveguide Market - Revenue and Forecast to 2031 (US$ Million)
- 9.1.1.3.1 Japan: AR Waveguide Market Breakdown, by Type
- 9.1.1.3.2 Japan: AR Waveguide Market Breakdown, by Application
- 9.1.1.4 India: AR Waveguide Market - Revenue and Forecast to 2031 (US$ Million)
- 9.1.1.4.1 India: AR Waveguide Market Breakdown, by Type
- 9.1.1.4.2 India: AR Waveguide Market Breakdown, by Application
- 9.1.1.5 Australia: AR Waveguide Market - Revenue and Forecast to 2031 (US$ Million)
- 9.1.1.5.1 Australia: AR Waveguide Market Breakdown, by Type
- 9.1.1.5.2 Australia: AR Waveguide Market Breakdown, by Application
- 9.1.1.6 South Korea: AR Waveguide Market - Revenue and Forecast to 2031 (US$ Million)
- 9.1.1.6.1 South Korea: AR Waveguide Market Breakdown, by Type
- 9.1.1.6.2 South Korea: AR Waveguide Market Breakdown, by Application
- 9.1.1.7 Rest of APAC: AR Waveguide Market - Revenue and Forecast to 2031 (US$ Million)
- 9.1.1.7.1 Rest of APAC: AR Waveguide Market Breakdown, by Type
- 9.1.1.7.2 Rest of APAC: AR Waveguide Market Breakdown, by Application
- 9.1.1 Asia Pacific: AR Waveguide Market - Revenue and Forecast Analysis - by Country
10. Competitive Landscape
- 10.1 Heat Map Analysis by Key Players
- 10.2 Company Positioning & Concentration
11. Industry Landscape
- 11.1 Overview
- 11.2 Market Initiative
- 11.3 Product Development
- 11.4 Mergers & Acquisitions
12. Company Profiles
- 12.1 Zhejiang Crystal-Optech Co., Ltd.
- 12.1.1 Key Facts
- 12.1.2 Business Description
- 12.1.3 Products and Services
- 12.1.4 Financial Overview
- 12.1.5 SWOT Analysis
- 12.1.6 Key Developments
- 12.2 Dispelix
- 12.2.1 Key Facts
- 12.2.2 Business Description
- 12.2.3 Products and Services
- 12.2.4 Financial Overview
- 12.2.5 SWOT Analysis
- 12.2.6 Key Developments
- 12.3 Goertek Inc
- 12.3.1 Key Facts
- 12.3.2 Business Description
- 12.3.3 Products and Services
- 12.3.4 Financial Overview
- 12.3.5 SWOT Analysis
- 12.3.6 Key Developments
- 12.4 LetinAR Inc.
- 12.4.1 Key Facts
- 12.4.2 Business Description
- 12.4.3 Products and Services
- 12.4.4 Financial Overview
- 12.4.5 SWOT Analysis
- 12.4.6 Key Developments
- 12.6 Optinvent
- 12.6.1 Key Facts
- 12.6.2 Business Description
- 12.6.3 Products and Services
- 12.6.4 Financial Overview
- 12.6.5 SWOT Analysis
- 12.6.6 Key Developments
- 12.7 Shenzhen Longjing Optoelectronics
- 12.7.1 Key Facts
- 12.7.2 Business Description
- 12.7.3 Products and Services
- 12.7.4 Financial Overview
- 12.7.5 SWOT Analysis
- 12.7.6 Key Developments
13. Appendix
- 13.1 Glossary
- 13.2 About The Insight Partners
