|
|
市場調査レポート
商品コード
1567775
アジア太平洋の3D計測市場の2031年までの予測- 地域別分析:製品、ハードウェア、用途、エンドユーザー別Asia Pacific 3D Metrology Market Forecast to 2031 - Regional Analysis - by Product, Hardware, Application, and End User |
||||||

|
|||||||
|
|||||||

| アジア太平洋の3D計測市場の2031年までの予測- 地域別分析:製品、ハードウェア、用途、エンドユーザー別 |
|
出版日: 2024年08月07日
発行: The Insight Partners
ページ情報: 英文 116 Pages
納期: 即納可能
|

全表示
- 概要
- 図表
- 目次
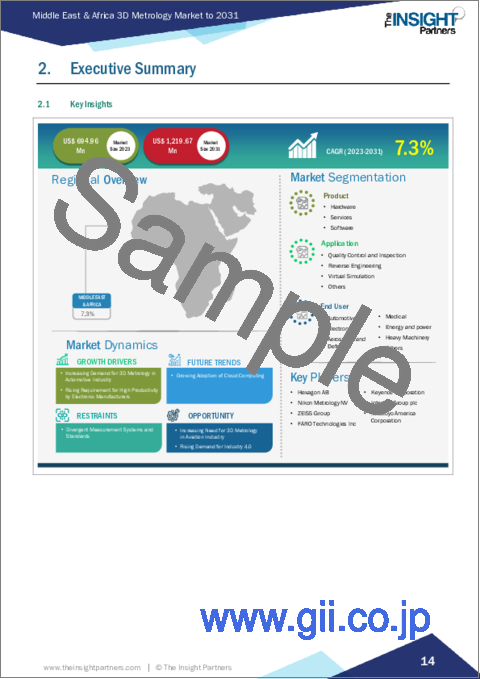
アジア太平洋の3D計測市場は、2023年に41億729万米ドルと評価され、2031年には86億259万米ドルに達すると予測され、2023年から2031年までのCAGRは9.7%と推定されます。
インダストリー4.0需要の高まりがアジア太平洋の3D計測市場を後押し
インダストリー4.0には、自動化、強化された分析、データ交換、デジタル技術の統合が含まれます。これらの最新の進歩は、ダイナミックなデジタル世界と物理的世界の間のコミュニケーションを促進します。インダストリー4.0は、かつてない精度と詳細さでデータを取得できる最先端のセンサーの開発と配備をもたらしました。自動化システムに組み込まれることで、多角的な評価、リアルタイムモニタリング、非接触測定が可能になると同時に、効率が向上し、手順が合理化されます。さらに、IoTの統合も世界的に増加しています。IoTデバイスは、機械、生産設備、さらには完成品にまで組み込まれています。生産プロセスを通じて、これらのデバイスはエンジニアにリアルタイムでデータを供給し、逸脱、異常、品質問題、その他の適切な情報を警告することができます。さらに、インダストリー4.0の主要な構成要素は、デジタル世界と物理的世界の統合です。デジタルツインとは、コンポーネントやシステムを仮想的に表現したもので、さまざまなシナリオに対する応答をテスト、測定、さらにモデル化することができます。これは、実際にオリジナルに触れることなく実験できるクローンを持つことに似ています。このように、デジタル・ツインは、現実世界の部品とバーチャルな部品を融合させることで、製造業のインテリジェンスと効率を向上させています。したがって、インダストリー4.0に対する需要の高まりが、予測期間中の3D計測市場の成長を促進すると予想されます。
アジア太平洋の3D計測市場の概要
アジア太平洋には、中国、日本、韓国、インド、オーストラリア、その他アジア太平洋が含まれます。電子製品の需要は世界的に増加しています。このため、電子機器製造部門の生産性を高める必要性が高まっています。したがって、製造能力を拡大するために、この地域のさまざまな国がいくつかのイニシアチブをとっています。日本経済新聞社によると、中国政府は国内の電子市場を拡大するため、2023年までに3,270億米国ドルを投資しました。同様に、インド政府も国内の電子機器市場を拡大しています。2023~2024年のインド予算によると、インド政府は電子情報技術省に2億米ドルを割り当て、前年比40%増を記録しました。さらに、インド政府はエレクトロニクス部門を強化するために、生産連動インセンティブ(PLI)スキーム、電子部品・半導体製造促進スキーム(SPECS)、修正エレクトロニクス製造クラスター(EMC 2.0)スキームなど、さまざまなスキームも提供しています。このように、電子機器製造部門を促進する政府のイニシアティブの増加は、アジア太平洋の3D計測市場の成長を促進すると予想されます。
この地域では、各国政府がいくつかの政策を策定しているため、EVの採用が増加しています。東南アジア諸国連合(ASEAN)は、EVの導入を奨励する有利な政策を策定しました。国際再生可能エネルギー機関(IRENA)によると、東南アジアでは2025年までに、5,900万台の二輪車と三輪車、890万台の自動車を含め、自動車の~20%がEVになるといいます。加えて、インド、韓国、台湾、ベトナム、その他のAPAC諸国は、人件費の安さを理由に自動車製造施設の移転を希望する複数の企業の誘致に絶えず取り組んでいます。このため、上記の国々は税制上の優遇措置、資金、補助金を提供し、より多くの製造企業が工場を設立するよう誘致しています。さらに、さまざまなEVメーカーが、高まる顧客需要に対応するため、生産能力の増強に取り組んでいます。例えば、中国のEVメーカーBYDは2023年3月、タイで新たなEV製造施設の建設を開始したと発表し、2024年から年間15万台の乗用車を生産する予定です。このように、EVの普及が進むことで3D計測の導入が進むと予想され、予測期間中の市場成長をさらに後押しすることになります。
アジア太平洋の3D計測市場の収益と2031年までの予測(金額)
アジア太平洋の3D計測市場セグメンテーション
アジア太平洋の3D計測市場は、製品、用途、エンドユーザー、国に分類されます。
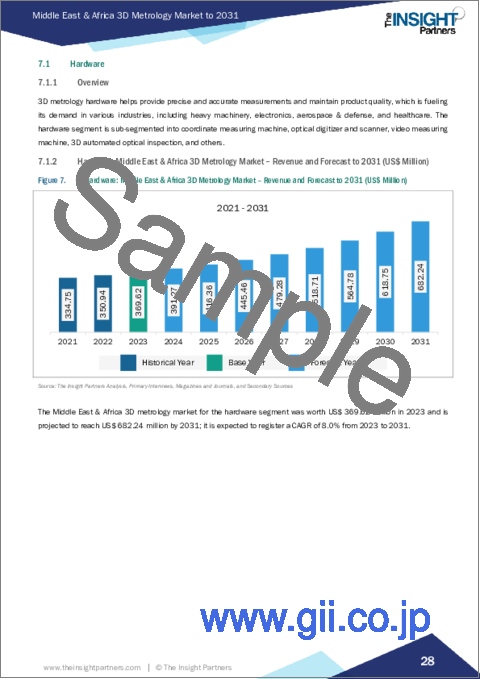
製品に基づき、アジア太平洋の3D計測市場はハードウェア、サービス、ソフトウェアに区分されます。ハードウェアセグメントが2023年に最大の市場シェアを占めています。ハードウェアセグメントはさらに、座標測定機、光学デジタイザとスキャナ、ビデオ測定機、3D自動光学検査、その他に細分化されます。
用途別では、アジア太平洋の3D計測市場は、品質管理と検査、リバースエンジニアリング、仮想シミュレーション、その他に区分されます。品質管理・検査分野が2023年に最大の市場シェアを占めました。
エンドユーザー別では、アジア太平洋3D計測市場は、自動車、エレクトロニクス、航空宇宙・防衛、医療、エネルギー・電力、重機、その他に区分されます。2023年の市場シェアは自動車分野が最大。
国別では、アジア太平洋3D計測市場は、中国、日本、韓国、インド、オーストラリア、その他アジア太平洋に区分されます。2023年のアジア太平洋3D計測市場シェアは中国が独占しました。
Artec Europe、Creaform Inc、FARO Technologies Inc、Hexagon AB、Intertek Group Plc、Keyence Corp、Mitutoyo America Corporation、Nikon Metrology NV、Shining 3D Tech Co Ltd、ZEISS Groupは、アジア太平洋3D計測市場で事業を展開している主要企業です。
目次
第1章 イントロダクション
第2章 エグゼクティブサマリー
- 主要洞察
- 市場の魅力
第3章 調査手法
- 調査範囲
- 2次調査
- 1次調査
第4章 アジア太平洋の3D計測市場情勢
- エコシステム分析
- バリューチェーンのベンダー一覧
第5章 アジア太平洋の3D計測市場:主要市場力学
- 市場促進要因
- 自動車産業における3D計測需要の増加
- 電子機器メーカーによる高生産性への要求の高まり
- 市場抑制要因
- 多様な測定システムと規格
- 市場機会
- 航空産業における3D計測のニーズの高まり
- インダストリー4.0に対する需要の高まり
- 今後の動向
- クラウドコンピューティングの採用拡大
- 促進要因と抑制要因の影響
第6章 3D計測市場:アジア太平洋の分析
- アジア太平洋の3D計測市場売上高、2021年~2031年
- アジア太平洋の3D計測市場予測分析
第7章 アジア太平洋の3D計測市場分析:製品別
- ハードウェア
- サービス
- ソフトウェア
第8章 アジア太平洋の3D計測市場分析-用途別
- 品質管理と検査
- リバースエンジニアリング
- バーチャルシミュレーション
- その他
第9章 アジア太平洋の3D計測市場分析-エンドユーザー別
- 自動車
- エレクトロニクス
- 航空宇宙・防衛
- 医療
- エネルギー・電力
- 重機械
- その他
第10章 アジア太平洋の3D計測市場:国別分析
- アジア太平洋
- 中国
- 日本
- 韓国
- インド
- オーストラリア
- その他アジア太平洋
第11章 競合情勢
- 主要プレーヤーによるヒートマップ分析
- 企業のポジショニングと集中度
第12章 業界情勢
- 市場イニシアティブ
- 新製品開発
- 合併と買収
第13章 企業プロファイル
- Hexagon AB
- Nikon Metrology NV
- Creaform Inc
- FARO Technologies Inc
- Artec Europe
- Intertek Group Plc
- Keyence Corp
- Mitutoyo America Corporation
- ZEISS Group
- Shining 3D Tech Co Ltd
第14章 付録
List Of Tables
- Table 1. Asia Pacific 3D Metrology Market Segmentation
- Table 2. List of Vendors
- Table 3. Asia Pacific 3D Metrology Market - Revenue and Forecast to 2031 (US$ Million)
- Table 4. Asia Pacific 3D Metrology Market - Revenue and Forecast to 2031 (US$ Million) - by Product
- Table 5. Asia Pacific 3D Metrology Market - Revenue and Forecast to 2031 (US$ Million) - by Hardware
- Table 6. Asia Pacific 3D Metrology Market - Revenue and Forecast to 2031 (US$ Million) - by Application
- Table 7. Asia Pacific 3D Metrology Market - Revenue and Forecast to 2031 (US$ Million) - by End User
- Table 8. Asia Pacific 3D Metrology Market - Revenue and Forecast to 2031(US$ Million) - by Country
- Table 9. China: Asia Pacific 3D Metrology Market - Revenue and Forecast to 2031(US$ Million) - by Product
- Table 10. China: Asia Pacific 3D Metrology Market - Revenue and Forecast to 2031(US$ Million) - by Hardware
- Table 11. China: Asia Pacific 3D Metrology Market - Revenue and Forecast to 2031(US$ Million) - by Application
- Table 12. China: Asia Pacific 3D Metrology Market - Revenue and Forecast to 2031(US$ Million) - by End User
- Table 13. Japan: Asia Pacific 3D Metrology Market - Revenue and Forecast to 2031(US$ Million) - by Product
- Table 14. Japan: Asia Pacific 3D Metrology Market - Revenue and Forecast to 2031(US$ Million) - by Hardware
- Table 15. Japan: Asia Pacific 3D Metrology Market - Revenue and Forecast to 2031(US$ Million) - by Application
- Table 16. Japan: Asia Pacific 3D Metrology Market - Revenue and Forecast to 2031(US$ Million) - by End User
- Table 17. South Korea: Asia Pacific 3D Metrology Market - Revenue and Forecast to 2031(US$ Million) - by Product
- Table 18. South Korea: Asia Pacific 3D Metrology Market - Revenue and Forecast to 2031(US$ Million) - by Hardware
- Table 19. South Korea: Asia Pacific 3D Metrology Market - Revenue and Forecast to 2031(US$ Million) - by Application
- Table 20. South Korea: Asia Pacific 3D Metrology Market - Revenue and Forecast to 2031(US$ Million) - by End User
- Table 21. India: Asia Pacific 3D Metrology Market - Revenue and Forecast to 2031(US$ Million) - by Product
- Table 22. India: Asia Pacific 3D Metrology Market - Revenue and Forecast to 2031(US$ Million) - by Hardware
- Table 23. India: Asia Pacific 3D Metrology Market - Revenue and Forecast to 2031(US$ Million) - by Application
- Table 24. India: Asia Pacific 3D Metrology Market - Revenue and Forecast to 2031(US$ Million) - by End User
- Table 25. Australia: Asia Pacific 3D Metrology Market - Revenue and Forecast to 2031(US$ Million) - by Product
- Table 26. Australia: Asia Pacific 3D Metrology Market - Revenue and Forecast to 2031(US$ Million) - by Hardware
- Table 27. Australia: Asia Pacific 3D Metrology Market - Revenue and Forecast to 2031(US$ Million) - by Application
- Table 28. Australia: Asia Pacific 3D Metrology Market - Revenue and Forecast to 2031(US$ Million) - by End User
- Table 29. Rest of Asia Pacific: Asia Pacific 3D Metrology Market - Revenue and Forecast to 2031(US$ Million) - by Product
- Table 30. Rest of Asia Pacific: Asia Pacific 3D Metrology Market - Revenue and Forecast to 2031(US$ Million) - by Hardware
- Table 31. Rest of Asia Pacific: Asia Pacific 3D Metrology Market - Revenue and Forecast to 2031(US$ Million) - by Application
- Table 32. Rest of Asia Pacific: Asia Pacific 3D Metrology Market - Revenue and Forecast to 2031(US$ Million) - by End User
- Table 33. List of Abbreviation
List Of Figures
- Figure 1. Asia Pacific 3D Metrology Market Segmentation, by Country
- Figure 2. Ecosystem: 3D Metrology Market
- Figure 3. Asia Pacific 3D Metrology Market - Key Market Dynamics
- Figure 4. Impact Analysis of Drivers and Restraints
- Figure 5. Asia Pacific 3D Metrology Market Revenue (US$ Million), 2021-2031
- Figure 6. Asia Pacific 3D Metrology Market Share (%) - by Product (2023 and 2031)
- Figure 7. Hardware: Asia Pacific 3D Metrology Market - Revenue and Forecast to 2031 (US$ Million)
- Figure 8. Coordinate Measuring Machine: Asia Pacific 3D Metrology Market - Revenue and Forecast to 2031 (US$ Million)
- Figure 9. Optical Digitizer and Scanner: Asia Pacific 3D Metrology Market - Revenue and Forecast to 2031 (US$ Million)
- Figure 10. Video Measuring Machine: Asia Pacific 3D Metrology Market - Revenue and Forecast to 2031 (US$ Million)
- Figure 11. 3D Automated Optical Inspection: Asia Pacific 3D Metrology Market - Revenue and Forecast to 2031 (US$ Million)
- Figure 12. Others: Asia Pacific 3D Metrology Market - Revenue and Forecast to 2031 (US$ Million)
- Figure 13. Services: Asia Pacific 3D Metrology Market - Revenue and Forecast to 2031 (US$ Million)
- Figure 14. Software: Asia Pacific 3D Metrology Market - Revenue and Forecast to 2031 (US$ Million)
- Figure 15. Asia Pacific 3D Metrology Market Share (%) - by Application (2023 and 2031)
- Figure 16. Quality Control & Inspection: Asia Pacific 3D Metrology Market - Revenue and Forecast to 2031 (US$ Million)
- Figure 17. Reverse Engineering: Asia Pacific 3D Metrology Market - Revenue and Forecast to 2031 (US$ Million)
- Figure 18. Virtual Simulation: Asia Pacific 3D Metrology Market - Revenue and Forecast to 2031 (US$ Million)
- Figure 19. Others: Asia Pacific 3D Metrology Market - Revenue and Forecast to 2031 (US$ Million)
- Figure 20. Asia Pacific 3D Metrology Market Share (%) - by End User (2023 and 2031)
- Figure 21. Automotive: Asia Pacific 3D Metrology Market - Revenue and Forecast to 2031 (US$ Million)
- Figure 22. Electronics: Asia Pacific 3D Metrology Market - Revenue and Forecast to 2031 (US$ Million)
- Figure 23. Aerospace & Defense: Asia Pacific 3D Metrology Market - Revenue and Forecast to 2031 (US$ Million)
- Figure 24. Medical: Asia Pacific 3D Metrology Market - Revenue and Forecast to 2031 (US$ Million)
- Figure 25. Energy & Power: Asia Pacific 3D Metrology Market - Revenue and Forecast to 2031 (US$ Million)
- Figure 26. Heavy Machinery: Asia Pacific 3D Metrology Market - Revenue and Forecast to 2031 (US$ Million)
- Figure 27. Others: Asia Pacific 3D Metrology Market - Revenue and Forecast to 2031 (US$ Million)
- Figure 28. Asia Pacific 3D Metrology Market Breakdown, by Key Countries - Revenue (2023) (US$ Million)
- Figure 29. Asia Pacific 3D Metrology Market Breakdown, by Key Countries, 2023 and 2031 (%)
- Figure 30. China: Asia Pacific 3D Metrology Market - Revenue and Forecast to 2031(US$ Million)
- Figure 31. Japan: Asia Pacific 3D Metrology Market - Revenue and Forecast to 2031(US$ Million)
- Figure 32. South Korea: Asia Pacific 3D Metrology Market - Revenue and Forecast to 2031(US$ Million)
- Figure 33. India: Asia Pacific 3D Metrology Market - Revenue and Forecast to 2031(US$ Million)
- Figure 34. Australia: Asia Pacific 3D Metrology Market - Revenue and Forecast to 2031(US$ Million)
- Figure 35. Rest of Asia Pacific: Asia Pacific 3D Metrology Market - Revenue and Forecast to 2031(US$ Million)
- Figure 36. Heat Map Analysis by Key Players
- Figure 37. Company Positioning & Concentration
The Asia Pacific 3D metrology market was valued at US$ 4,107.29 million in 2023 and is expected to reach US$ 8,602.59 million by 2031; it is estimated to register a CAGR of 9.7% from 2023 to 2031.
Rising Demand for Industry 4.0 Boosts Asia Pacific 3D Metrology Market
Industry 4.0 includes automation, enhanced analytics, data interchange, and digital technology integration. These latest advancements facilitate communication between the dynamic digital world and the physical world. Industry 4.0 has resulted in the development and deployment of cutting-edge sensors capable of capturing data with unprecedented precision and detail. Their incorporation into automated systems improves efficiency and streamlines procedures while enabling multidimensional assessments, real-time monitoring, and non-contact measures, which is expected to fuel the market growth during the forecast period. In addition, the integration of IoT is also increasing worldwide. IoT devices are integrated into machinery, production equipment, and even finished goods. Throughout the production process, these devices can supply real-time data to engineers, alerting them to deviations, abnormalities, quality problems, and other pertinent information. Additionally, a major component of Industry 4.0 is the integration of the digital and physical worlds. A digital twin is a virtual representation of a component or system that allows one to test, measure, and even model its response to various scenarios. It is similar to having a clone that allows one to experiment without actually touching the original. Thus, digital twins are improving the intelligence and efficiency of manufacturing by fusing real-world and virtual components. Hence, the rising demand for Industry 4.0 is expected to propel the growth of the 3D metrology market during the forecast period.
Asia Pacific 3D Metrology Market Overview
Asia Pacific encompasses China, Japan, South Korea, India, Australia, and the Rest of Asia Pacific. The demand for electronic products is increasing worldwide. This is raising the need to increase productivity in the electronic manufacturing sector. Hence, to expand their manufacturing capabilities, various countries in the region are taking several initiatives. According to Nikkei Inc., the Chinese government invested ~US$ 327 billion till 2023 to expand the country's domestic electronic market. Similarly, the Indian government is also expanding the electronics market in the country. According to the Indian budget for 2023-2024, the government of India allocated US$ 200 million to the Ministry of Electronics and Information Technology, marking a 40% year-on-year increase. In addition, the Indian government also provides various schemes to boost the electronics sector, which include the Production Linked Incentive (PLI) Schemes, the Scheme for Promotion of Manufacturing of Electronic Components and Semiconductors (SPECS), and the Modified Electronics Manufacturing Cluster (EMC 2.0) Scheme. Thus, the increase in government initiatives to promote the electronic manufacturing sector is expected to fuel the growth of the Asia Pacific 3D metrology market.
The region is witnessing rising adoption of EVs as the governments of different countries are developing several policies. The Association of Southeast Asian Nations (ASEAN) developed a favorable policy to encourage EV adoption. According to the International Renewable Energy Agency (IRENA), ~20% of vehicles in Southeast Asia will be EVs by 2025, including 59 million two-wheelers and three-wheelers and 8.9 million cars. In addition, India, South Korea, Taiwan, Vietnam, and other APAC countries are constantly working on attracting several businesses that want to relocate their car manufacturing facilities to the above countries because of low labor costs. For this, the above countries are offering tax rebates, funds, and subsidies, attracting more manufacturing companies to set up their plants. Furthermore, various EV manufacturers are working on increasing their production capacity to meet the rising customer demand. For instance, in March 2023, Chinese EV manufacturer BYD announced that it had started the construction of its new EV manufacturing facility in Thailand, which will be producing 150,000 passenger cars per year from 2024. Thus, the growing adoption of EVs is expected to increase the adoption of 3D metrology, which will further fuel the growth of the market during the forecast period.
Asia Pacific 3D Metrology Market Revenue and Forecast to 2031 (US$ Million)
Asia Pacific 3D Metrology Market Segmentation
The Asia Pacific 3D metrology market is categorized into product, application, end user, and country.
Based on product, the Asia Pacific 3D metrology market is segmented hardware, services, and software. The hardware segment held the largest market share in 2023. The hardware segment is further sub segmented into coordinate measuring machine, optical digitizer and scanner, video measuring machine, 3D automated optical inspection, and others.
Based on application, the Asia Pacific 3D metrology market is segmented into quality control and inspection, reverse engineering, virtual simulation, and others. The quality control and inspection segment held the largest market share in 2023.
In terms of end user, the Asia Pacific 3D metrology market is segmented into automotive, electronics, aerospace and defense, medical, energy and power, heavy machinery, and others. The automotive segment held the largest market share in 2023.
By country, the Asia Pacific 3D metrology market is segmented into China, Japan, South Korea, India, Australia, and the Rest of Asia Pacific. China dominated the Asia Pacific 3D metrology market share in 2023.
Artec Europe, Creaform Inc, FARO Technologies Inc, Hexagon AB, Intertek Group Plc, Keyence Corp, Mitutoyo America Corporation, Nikon Metrology NV, Shining 3D Tech Co Ltd, and ZEISS Group are some of the leading companies operating in the Asia Pacific 3D metrology market.
Table Of Contents
1. Introduction
- 1.1 The Insight Partners Research Report Guidance
- 1.2 Market Segmentation
2. Executive Summary
- 2.1 Key Insights
- 2.2 Market Attractiveness
3. Research Methodology
- 3.1 Coverage
- 3.2 Secondary Research
- 3.3 Primary Research
4. Asia Pacific 3D Metrology Market Landscape
- 4.1 Overview
- 4.2 Ecosystem Analysis
- 4.2.1 List of Vendors in the Value Chain
5. Asia Pacific 3D Metrology Market - Key Market Dynamics
- 5.1 Market Drivers
- 5.1.1 Increasing Demand for 3D Metrology in Automotive Industry
- 5.1.2 Rising Requirement for High Productivity by Electronic Manufacturers
- 5.2 Market Restraints
- 5.2.1 Divergent Measurement Systems and Standards
- 5.3 Market Opportunities
- 5.3.1 Increasing Need for 3D Metrology in Aviation Industry
- 5.3.2 Rising Demand for Industry 4.0
- 5.4 Future Trends
- 5.4.1 Growing Adoption of Cloud Computing
- 5.5 Impact of Drivers and Restraints:
6. 3D Metrology Market - Asia Pacific Analysis
- 6.1 Asia Pacific 3D Metrology Market Revenue (US$ Million), 2021-2031
- 6.2 Asia Pacific 3D Metrology Market Forecast Analysis
7. Asia Pacific 3D Metrology Market Analysis - by Product
- 7.1 Hardware
- 7.1.1 Overview
- 7.1.2 Hardware: Asia Pacific 3D Metrology Market - Revenue and Forecast to 2031 (US$ Million)
- 7.1.3 Asia Pacific 3D Metrology Market - by Hardware (2023 and 2031)
- 7.1.3.1 Coordinate Measuring Machine
- 7.1.3.1.1 Overview
- 7.1.3.1.2 Coordinate Measuring Machine: Asia Pacific 3D Metrology Market - Revenue and Forecast to 2031 (US$ Million)
- 7.1.3.2 Optical Digitizer and Scanner
- 7.1.3.2.1 Overview
- 7.1.3.2.2 Optical Digitizer and Scanner: Asia Pacific 3D Metrology Market - Revenue and Forecast to 2031 (US$ Million)
- 7.1.3.3 Video Measuring Machine
- 7.1.3.3.1 Overview
- 7.1.3.3.2 Video Measuring Machine: Asia Pacific 3D Metrology Market - Revenue and Forecast to 2031 (US$ Million)
- 7.1.3.4 3D Automated Optical Inspection
- 7.1.3.4.1 Overview
- 7.1.3.4.2 3D Automated Optical Inspection: Asia Pacific 3D Metrology Market - Revenue and Forecast to 2031 (US$ Million)
- 7.1.3.5 Others
- 7.1.3.5.1 Overview
- 7.1.3.5.2 Others: Asia Pacific 3D Metrology Market - Revenue and Forecast to 2031 (US$ Million)
- 7.1.3.1 Coordinate Measuring Machine
- 7.2 Services
- 7.2.1 Overview
- 7.2.2 Services: Asia Pacific 3D Metrology Market - Revenue and Forecast to 2031 (US$ Million)
- 7.3 Software
- 7.3.1 Overview
- 7.3.2 Software: Asia Pacific 3D Metrology Market - Revenue and Forecast to 2031 (US$ Million)
8. Asia Pacific 3D Metrology Market Analysis - by Application
- 8.1 Quality Control & Inspection
- 8.1.1 Overview
- 8.1.2 Quality Control & Inspection: Asia Pacific 3D Metrology Market - Revenue and Forecast to 2031 (US$ Million)
- 8.2 Reverse Engineering
- 8.2.1 Overview
- 8.2.2 Reverse Engineering: Asia Pacific 3D Metrology Market - Revenue and Forecast to 2031 (US$ Million)
- 8.3 Virtual Simulation
- 8.3.1 Overview
- 8.3.2 Virtual Simulation: Asia Pacific 3D Metrology Market - Revenue and Forecast to 2031 (US$ Million)
- 8.4 Others
- 8.4.1 Overview
- 8.4.2 Others: Asia Pacific 3D Metrology Market - Revenue and Forecast to 2031 (US$ Million)
9. Asia Pacific 3D Metrology Market Analysis - by End User
- 9.1 Automotive
- 9.1.1 Overview
- 9.1.2 Automotive: Asia Pacific 3D Metrology Market - Revenue and Forecast to 2031 (US$ Million)
- 9.2 Electronics
- 9.2.1 Overview
- 9.2.2 Electronics: Asia Pacific 3D Metrology Market - Revenue and Forecast to 2031 (US$ Million)
- 9.3 Aerospace & Defense
- 9.3.1 Overview
- 9.3.2 Aerospace & Defense: Asia Pacific 3D Metrology Market - Revenue and Forecast to 2031 (US$ Million)
- 9.4 Medical
- 9.4.1 Overview
- 9.4.2 Medical: Asia Pacific 3D Metrology Market - Revenue and Forecast to 2031 (US$ Million)
- 9.5 Energy & Power
- 9.5.1 Overview
- 9.5.2 Energy & Power: Asia Pacific 3D Metrology Market - Revenue and Forecast to 2031 (US$ Million)
- 9.6 Heavy Machinery
- 9.6.1 Overview
- 9.6.2 Heavy Machinery: Asia Pacific 3D Metrology Market - Revenue and Forecast to 2031 (US$ Million)
- 9.7 Others
- 9.7.1 Overview
- 9.7.2 Others: Asia Pacific 3D Metrology Market - Revenue and Forecast to 2031 (US$ Million)
10. Asia Pacific 3D Metrology Market - Country Analysis
- 10.1 Asia Pacific
- 10.1.1 Asia Pacific 3D Metrology Market - Revenue and Forecast Analysis - by Country
- 10.1.1.1 Asia Pacific 3D Metrology Market - Revenue and Forecast Analysis - by Country
- 10.1.1.2 China: Asia Pacific 3D Metrology Market - Revenue and Forecast to 2031 (US$ Million)
- 10.1.1.2.1 China: Asia Pacific 3D Metrology Market Breakdown, by Product
- 10.1.1.2.1.1 China: Asia Pacific 3D Metrology Market Breakdown, by Hardware
- 10.1.1.2.2 China: Asia Pacific 3D Metrology Market Breakdown, by Application
- 10.1.1.2.3 China: Asia Pacific 3D Metrology Market Breakdown, by End User
- 10.1.1.3 Japan: Asia Pacific 3D Metrology Market - Revenue and Forecast to 2031 (US$ Million)
- 10.1.1.3.1 Japan: Asia Pacific 3D Metrology Market Breakdown, by Product
- 10.1.1.3.1.1 Japan: Asia Pacific 3D Metrology Market Breakdown, by Hardware
- 10.1.1.3.2 Japan: Asia Pacific 3D Metrology Market Breakdown, by Application
- 10.1.1.3.3 Japan: Asia Pacific 3D Metrology Market Breakdown, by End User
- 10.1.1.4 South Korea: Asia Pacific 3D Metrology Market - Revenue and Forecast to 2031 (US$ Million)
- 10.1.1.4.1 South Korea: Asia Pacific 3D Metrology Market Breakdown, by Product
- 10.1.1.4.1.1 South Korea: Asia Pacific 3D Metrology Market Breakdown, by Hardware
- 10.1.1.4.2 South Korea: Asia Pacific 3D Metrology Market Breakdown, by Application
- 10.1.1.4.3 South Korea: Asia Pacific 3D Metrology Market Breakdown, by End User
- 10.1.1.5 India: Asia Pacific 3D Metrology Market - Revenue and Forecast to 2031 (US$ Million)
- 10.1.1.5.1 India: Asia Pacific 3D Metrology Market Breakdown, by Product
- 10.1.1.5.1.1 India: Asia Pacific 3D Metrology Market Breakdown, by Hardware
- 10.1.1.5.2 India: Asia Pacific 3D Metrology Market Breakdown, by Application
- 10.1.1.5.3 India: Asia Pacific 3D Metrology Market Breakdown, by End User
- 10.1.1.6 Australia: Asia Pacific 3D Metrology Market - Revenue and Forecast to 2031 (US$ Million)
- 10.1.1.6.1 Australia: Asia Pacific 3D Metrology Market Breakdown, by Product
- 10.1.1.6.1.1 Australia: Asia Pacific 3D Metrology Market Breakdown, by Hardware
- 10.1.1.6.2 Australia: Asia Pacific 3D Metrology Market Breakdown, by Application
- 10.1.1.6.3 Australia: Asia Pacific 3D Metrology Market Breakdown, by End User
- 10.1.1.7 Rest of Asia Pacific: Asia Pacific 3D Metrology Market - Revenue and Forecast to 2031 (US$ Million)
- 10.1.1.7.1 Rest of Asia Pacific: Asia Pacific 3D Metrology Market Breakdown, by Product
- 10.1.1.7.1.1 Rest of Asia Pacific: Asia Pacific 3D Metrology Market Breakdown, by Hardware
- 10.1.1.7.2 Rest of Asia Pacific: Asia Pacific 3D Metrology Market Breakdown, by Application
- 10.1.1.7.3 Rest of Asia Pacific: Asia Pacific 3D Metrology Market Breakdown, by End User
- 10.1.1 Asia Pacific 3D Metrology Market - Revenue and Forecast Analysis - by Country
11. Competitive Landscape
- 11.1 Heat Map Analysis by Key Players
- 11.2 Company Positioning & Concentration
12. Industry Landscape
- 12.1 Overview
- 12.2 Market Initiative
- 12.3 New Product Development
- 12.4 Merger and Acquisition
13. Company Profiles
- 13.1 Hexagon AB
- 13.1.1 Key Facts
- 13.1.2 Business Description
- 13.1.3 Products and Services
- 13.1.4 Financial Overview
- 13.1.5 SWOT Analysis
- 13.1.6 Key Developments
- 13.2 Nikon Metrology NV
- 13.2.1 Key Facts
- 13.2.2 Business Description
- 13.2.3 Products and Services
- 13.2.4 Financial Overview
- 13.2.5 SWOT Analysis
- 13.2.6 Key Developments
- 13.3 Creaform Inc
- 13.3.1 Key Facts
- 13.3.2 Business Description
- 13.3.3 Products and Services
- 13.3.4 Financial Overview
- 13.3.5 SWOT Analysis
- 13.3.6 Key Developments
- 13.4 FARO Technologies Inc
- 13.4.1 Key Facts
- 13.4.2 Business Description
- 13.4.3 Products and Services
- 13.4.4 Financial Overview
- 13.4.5 SWOT Analysis
- 13.4.6 Key Developments
- 13.5 Artec Europe
- 13.5.1 Key Facts
- 13.5.2 Business Description
- 13.5.3 Products and Services
- 13.5.4 Financial Overview
- 13.5.5 SWOT Analysis
- 13.5.6 Key Developments
- 13.6 Intertek Group Plc
- 13.6.1 Key Facts
- 13.6.2 Business Description
- 13.6.3 Products and Services
- 13.6.4 Financial Overview
- 13.6.5 SWOT Analysis
- 13.6.6 Key Developments
- 13.7 Keyence Corp
- 13.7.1 Key Facts
- 13.7.2 Business Description
- 13.7.3 Products and Services
- 13.7.4 Financial Overview
- 13.7.5 SWOT Analysis
- 13.7.6 Key Developments
- 13.8 Mitutoyo America Corporation
- 13.8.1 Key Facts
- 13.8.2 Business Description
- 13.8.3 Products and Services
- 13.8.4 Financial Overview
- 13.8.5 SWOT Analysis
- 13.8.6 Key Developments
- 13.9 ZEISS Group
- 13.9.1 Key Facts
- 13.9.2 Business Description
- 13.9.3 Products and Services
- 13.9.4 Financial Overview
- 13.9.5 SWOT Analysis
- 13.9.6 Key Developments
- 13.10 Shining 3D Tech Co Ltd
- 13.10.1 Key Facts
- 13.10.2 Business Description
- 13.10.3 Products and Services
- 13.10.4 Financial Overview
- 13.10.5 SWOT Analysis
- 13.10.6 Key Developments
14. Appendix
- 14.1 About The Insight Partners
- 14.2 Word Index
