|
|
市場調査レポート
商品コード
1562255
アジア太平洋地域のテレラジオロジーサービス:2030年市場予測- 地域別分析- 展開タイプ、モダリティ、用途、エンドユーザー別Asia Pacific Teleradiology Services Market Forecast to 2030 - Regional Analysis - by Deployment Type, Modality, Application, and End User |
||||||

|
|||||||
|
|||||||


| アジア太平洋地域のテレラジオロジーサービス:2030年市場予測- 地域別分析- 展開タイプ、モダリティ、用途、エンドユーザー別 |
|
出版日: 2024年07月04日
発行: The Insight Partners
ページ情報: 英文 80 Pages
納期: 即納可能
|

全表示
- 概要
- 図表
- 目次
アジア太平洋のテレラジオロジーサービス市場は、2022年に5億503万米ドルと評価され、2030年には17億8,574万米ドルに達すると予測され、2022~2030年のCAGRは17.1%と推定されます。
テレラジオロジーにおける人工知能(AI)の採用がアジア太平洋のテレラジオロジーサービス市場を押し上げる
需要を満たすために必要な数の放射線科医を生み出し、育成することは短期的には困難であるが、AIやモノのインターネット(IoT)などのスマートソリューションやより新しい技術の採用は、患者ケアにおける次のブレークスルーの鍵となり得る。2011~2020年にかけて、かつてないほど多くの機器がインターネットに接続されたが、この動向は今後数十年間も着実に続くと考えられます。IoTの出現は、集団の健康増進を目的とした様々な健康法の開発を推進しました。これらのサービスは幅広く情報提供されており、医療専門家が遠隔で患者の経過を追跡・監視したり、慢性疾患の自己管理を改善したり、異常の早期発見を支援したり、症状の特定や臨床診断を迅速化したりするなど、単一の疾患やクラスターの状態管理にわたってさまざまな目的に利用できます。さらに、IoTを活用したアプリは、高品質かつ低コストの医療を提供しながら、医療資源をより有効に活用できる可能性を秘めています。例えば、Mobile MIMアプリはAppleのApp Storeで最初の医療アプリとなりました。このアプリは、SPECT、PET、CT、MRI、X線、超音波試験の医療画像を診断目的で表示、登録、融合、表示するために使用されます。モバイルMIMは、医用画像へのワイヤレスかつポータブルなアクセスを提供することで、医師の画像へのアクセスを強化し、同僚と相談できるようにします。AIは、プロトコルの要件に基づいて症例に優先順位をつける内蔵システムの構築を支援することができます。例えば、脳卒中や外傷の症例に優先順位を付け、放射線科医の作業リストに割り当てることで、多くの命を救うことができます。AI機能を組み込んだ統合クラウドベースのRIS/PACSプラットフォームは、放射線科医が症例を自動的かつ同時にレビューするのに役立ちます。ターンアラウンドタイムの短縮、放射線科医のバーンアウトの減少、エラーの減少により、AIとIoTを搭載したテレラジオロジー・プラットフォームは放射線科の解釈を改善し、より迅速なレポートを提供することが期待されます。
アジア太平洋のテレラジオロジーサービス市場概要
アジア太平洋のテレラジオロジーサービス市場は、インド、中国、日本、オーストラリア、韓国、その他のアジア太平洋に細分化されます。高齢者人口の増加、慢性疾患の増加、研究活動と技術進歩の増加、新興企業、バイオテクノロジー企業、バイオ医薬品企業の急増が、この地域の市場躍進を後押しする要因です。神経疾患の有病率の上昇とteleradiologyサービスの採用拡大が市場成長を後押ししています。中国では高齢者人口が大幅に増加しています。脳卒中は全国の高齢者の主要死因です。Elsevierが発表した研究によると、2020年には1,780万件の脳卒中症例、340万件の新規脳卒中、230万件の脳卒中関連死亡が報告されています。世界保健機関(WHO)が2020年4月に発表したデータによると、中国では、がんによる新規がん患者数は456万8,754人、死亡者数は300万2,899人でした。2023年にJournal of the American Medical Associationに発表された研究によると、中国本土の18歳以上の慢性腎臓病(CKD)有病率は8.2%です。さらに、国際がん研究機関(IARC)の最新データによると、中国における胃がんの推定年齢標準化率(ASR)は10万人当たり21人、粗率は33.06、膵臓がんのASRは10万人当たり5人、粗率は8.6です。同じ供給源によると、2020年における0~74歳の胃がんと膵臓がんの新規患者数(男女とも)は、それぞれ47万8,508人と12万4,994人と推定されています。このように、慢性疾患の負担が大きいことが、中国におけるテレラジオロジーサービスの需要を後押ししています。
アジア太平洋のテレラジオロジーサービス市場の収益と2030年までの予測(金額)
アジア太平洋のテレラジオロジーサービス市場のセグメンテーション
アジア太平洋のテレラジオロジーサービス市場は、展開タイプ、モダリティ、用途、エンドユーザー、国に分類されます。
展開タイプに基づいて、アジア太平洋のテレラジオロジーサービス市場はクラウドベースとウェブベースに二分されます。クラウドベースセグメントは、2022年のアジア太平洋のテレラジオロジーサービス市場でより大きなシェアを占めています。
モダリティ別では、アジア太平洋のテレラジオロジーサービス市場はMRI、CTスキャン、X線、超音波、その他に区分されます。2022年のアジア太平洋のテレラジオロジーサービス市場シェアはCTスキャンセグメントが最大でした。
用途別では、アジア太平洋のテレラジオロジーサービス市場は、筋骨格系、消化器系、循環器系、腫瘍系、神経系、その他に分けられます。筋骨格系セグメントは、2022年にアジア太平洋のテレラジオロジーサービス市場で最大のシェアを占めました。
エンドユーザー別では、アジア太平洋のテレラジオロジーサービス市場は病院・クリニック、診断・画像診断センター、その他に分類されます。2022年のアジア太平洋のテレラジオロジーサービス市場シェアは、病院・クリニックセグメントが最大でした。
国別では、アジア太平洋teleradiologyサービス市場は、中国、日本、オーストラリア、インド、韓国、その他のアジア太平洋に区分されます。2022年のアジア太平洋teleradiologyサービス市場シェアは中国が独占しています。
Aster Medical Imaging LLC、medavis GmbH、Teleradiology Solutions Inc、TeleDiagnosys LLC、Agilus Diagnostics Ltdは、アジア太平洋のテレラジオロジーサービス市場で事業を展開している主要企業です。
目次
第1章 イントロダクション
第2章 エグゼクティブサマリー
- 主要な洞察
第3章 調査手法
- 調査範囲
- 2次調査
- 1次調査
第4章 アジア太平洋のテレラジオロジーサービス市場-主要市場力学
- アジア太平洋のテレラジオロジーサービス市場:主要市場力学
- 市場促進要因
- 放射線技師と医師の不足
- テレラジオロジーサービスの採用拡大
- 市場抑制要因
- セキュリティとプライバシーに関する懸念
- 市場機会
- テレラジオロジーにおける人工知能(AI)の採用
- 今後の動向
- 有望な5G技術の強化
- 促進要因と抑制要因の影響
第5章 テレラジオロジーサービス市場:アジア太平洋市場分析
- アジア太平洋のテレラジオロジーサービス市場収益(2020~2030年)
- アジア太平洋のテレラジオロジーサービス市場予測分析
第6章 アジア太平洋のテレラジオロジーサービス市場分析-展開タイプ別
- クラウドベース
- ウェブベース
第7章 アジア太平洋のテレラジオロジーサービス市場分析-モダリティ別
- MRI
- CTスキャン
- X線
- 超音波
- その他
第8章 アジア太平洋のテレラジオロジーサービス市場分析-用途別
- 筋骨格系
- 消化器系
- 循環器
- 腫瘍学
- 神経学
- その他
第9章 アジア太平洋のテレラジオロジーサービス市場分析-エンドユーザー別
- 病院とクリニック
- 診断・画像診断センター
- その他
第10章 アジア太平洋のテレラジオロジーサービス市場:国別分析
- アジア太平洋
- 中国
- 日本
- インド
- 韓国
- オーストラリア
- その他のアジア太平洋
第11章 企業プロファイル
- Aster Medical Imaging LLC
- medavis GmbH
- Teleradiology Solutions Inc
- TeleDiagnosys LLC
- Agilus Diagnostics Ltd
第12章 付録
List Of Tables
- Table 1. Asia Pacific Teleradiology Services Market Segmentation
- Table 2. Largest Healthcare Data Breaches (2009-2022) as per HIPAA Journal
- Table 3. Asia Pacific Teleradiology Services Market - Revenue and Forecast to 2030 (US$ Million)
- Table 4. Asia Pacific Teleradiology Services Market - Revenue and Forecast to 2030 (US$ Million) - by Deployment Type
- Table 5. Asia Pacific Teleradiology Services Market - Revenue and Forecast to 2030 (US$ Million) - by Modality
- Table 6. Asia Pacific Teleradiology Services Market - Revenue and Forecast to 2030 (US$ Million) - by Application
- Table 7. Asia Pacific Teleradiology Services Market - Revenue and Forecast to 2030 (US$ Million) - by End User
- Table 8. Asia Pacific: Teleradiology Services Market - Revenue and Forecast to 2030(US$ Million) - by Country
- Table 9. China: Teleradiology Services Market - Revenue and Forecast to 2030(US$ Million) - by Deployment Type
- Table 10. China: Teleradiology Services Market - Revenue and Forecast to 2030(US$ Million) - by Modality
- Table 11. China: Teleradiology Services Market - Revenue and Forecast to 2030(US$ Million) - by Application
- Table 12. China: Teleradiology Services Market - Revenue and Forecast to 2030(US$ Million) - by End User
- Table 13. Japan: Teleradiology Services Market - Revenue and Forecast to 2030(US$ Million) - by Deployment Type
- Table 14. Japan: Teleradiology Services Market - Revenue and Forecast to 2030(US$ Million) - by Modality
- Table 15. Japan: Teleradiology Services Market - Revenue and Forecast to 2030(US$ Million) - by Application
- Table 16. Japan: Teleradiology Services Market - Revenue and Forecast to 2030(US$ Million) - by End User
- Table 17. India: Teleradiology Services Market - Revenue and Forecast to 2030(US$ Million) - by Deployment Type
- Table 18. India: Teleradiology Services Market - Revenue and Forecast to 2030(US$ Million) - by Modality
- Table 19. India: Teleradiology Services Market - Revenue and Forecast to 2030(US$ Million) - by Application
- Table 20. India: Teleradiology Services Market - Revenue and Forecast to 2030(US$ Million) - by End User
- Table 21. South Korea: Teleradiology Services Market - Revenue and Forecast to 2030(US$ Million) - by Deployment Type
- Table 22. South Korea: Teleradiology Services Market - Revenue and Forecast to 2030(US$ Million) - by Modality
- Table 23. South Korea: Teleradiology Services Market - Revenue and Forecast to 2030(US$ Million) - by Application
- Table 24. South Korea: Teleradiology Services Market - Revenue and Forecast to 2030(US$ Million) - by End User
- Table 25. Australia: Teleradiology Services Market - Revenue and Forecast to 2030(US$ Million) - by Deployment Type
- Table 26. Australia: Teleradiology Services Market - Revenue and Forecast to 2030(US$ Million) - by Modality
- Table 27. Australia: Teleradiology Services Market - Revenue and Forecast to 2030(US$ Million) - by Application
- Table 28. Australia: Teleradiology Services Market - Revenue and Forecast to 2030(US$ Million) - by End User
- Table 29. Rest of Asia Pacific: Teleradiology Services Market - Revenue and Forecast to 2030(US$ Million) - by Deployment Type
- Table 30. Rest of Asia Pacific: Teleradiology Services Market - Revenue and Forecast to 2030(US$ Million) - by Modality
- Table 31. Rest of Asia Pacific: Teleradiology Services Market - Revenue and Forecast to 2030(US$ Million) - by Application
- Table 32. Rest of Asia Pacific: Teleradiology Services Market - Revenue and Forecast to 2030(US$ Million) - by End User
- Table 33. Glossary of Terms, Teleradiology Services Market
List Of Figures
- Figure 1. Asia Pacific Teleradiology Services Market Segmentation, by Country
- Figure 2. Impact Analysis of Drivers and Restraints
- Figure 3. Asia Pacific Teleradiology Services Market Revenue (US$ Million), 2020-2030
- Figure 4. Asia Pacific Teleradiology Services Market Share (%) - by Deployment Type (2022 and 2030)
- Figure 5. Cloud-based: Asia Pacific Teleradiology Services Market - Revenue and Forecast to 2030 (US$ Million)
- Figure 6. Web-based: Asia Pacific Teleradiology Services Market - Revenue and Forecast to 2030 (US$ Million)
- Figure 7. Asia Pacific Teleradiology Services Market Share (%) - by Modality (2022 and 2030)
- Figure 8. MRI: Asia Pacific Teleradiology Services Market - Revenue and Forecast to 2030 (US$ Million)
- Figure 9. CT-Scan: Asia Pacific Teleradiology Services Market - Revenue and Forecast to 2030 (US$ Million)
- Figure 10. X-ray: Asia Pacific Teleradiology Services Market - Revenue and Forecast to 2030 (US$ Million)
- Figure 11. Ultrasound: Asia Pacific Teleradiology Services Market - Revenue and Forecast to 2030 (US$ Million)
- Figure 12. Others: Asia Pacific Teleradiology Services Market - Revenue and Forecast to 2030 (US$ Million)
- Figure 13. Asia Pacific Teleradiology Services Market Share (%) - by Application (2022 and 2030)
- Figure 14. Musculoskeletal System: Asia Pacific Teleradiology Services Market - Revenue and Forecast to 2030 (US$ Million)
- Figure 15. Gastroenterology: Asia Pacific Teleradiology Services Market - Revenue and Forecast to 2030 (US$ Million)
- Figure 16. Cardiology: Asia Pacific Teleradiology Services Market - Revenue and Forecast to 2030 (US$ Million)
- Figure 17. Oncology: Asia Pacific Teleradiology Services Market - Revenue and Forecast to 2030 (US$ Million)
- Figure 18. Neurology: Asia Pacific Teleradiology Services Market - Revenue and Forecast to 2030 (US$ Million)
- Figure 19. Others: Asia Pacific Teleradiology Services Market - Revenue and Forecast to 2030 (US$ Million)
- Figure 20. Asia Pacific Teleradiology Services Market Share (%) - by End User (2022 and 2030)
- Figure 21. Hospitals and Clinics: Asia Pacific Teleradiology Services Market - Revenue and Forecast to 2030 (US$ Million)
- Figure 22. Diagnostic and Imaging Centers: Asia Pacific Teleradiology Services Market - Revenue and Forecast to 2030 (US$ Million)
- Figure 23. Others: Asia Pacific Teleradiology Services Market - Revenue and Forecast to 2030 (US$ Million)
- Figure 24. Asia Pacific: Teleradiology Services Market Revenue, by Key Countries, (2022)
- Figure 25. Asia Pacific: Teleradiology Services Market Breakdown, by Key Countries, 2022 and 2030 (%)
- Figure 26. China: Teleradiology Services Market - Revenue and Forecast to 2030(US$ Million)
- Figure 27. Japan: Teleradiology Services Market - Revenue and Forecast to 2030(US$ Million)
- Figure 28. India: Teleradiology Services Market - Revenue and Forecast to 2030(US$ Million)
- Figure 29. South Korea: Teleradiology Services Market - Revenue and Forecast to 2030(US$ Million)
- Figure 30. Australia: Teleradiology Services Market - Revenue and Forecast to 2030(US$ Million)
- Figure 31. Rest of Asia Pacific: Teleradiology Services Market - Revenue and Forecast to 2030(US$ Million)
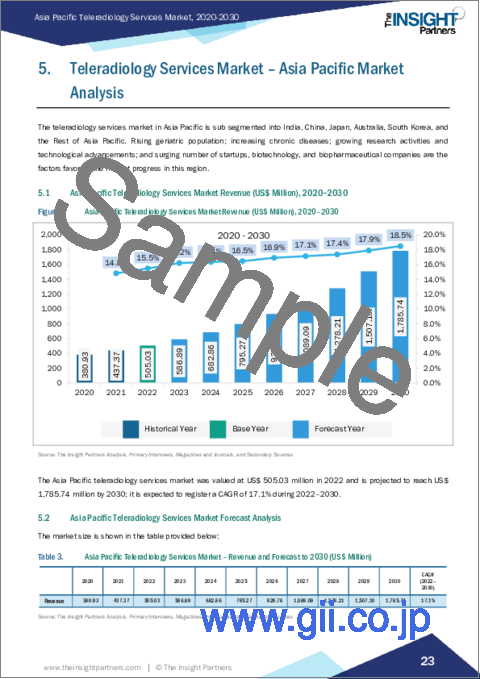
The Asia Pacific teleradiology services market was valued at US$ 505.03 million in 2022 and is expected to reach US$ 1,785.74 million by 2030; it is estimated to register a CAGR of 17.1% from 2022 to 2030.
Adoption of Artificial Intelligence (AI) in Teleradiology Boosts Asia Pacific Teleradiology Services Market
Although it is difficult in the near term to create and train the number of radiologists required to meet the demand, the adoption of smart solutions and newer technologies, such as AI and Internet of Things (IoT), can be the key to the next breakthrough in patient care. During 2011-2020, a significantly larger number of devices were connected to the Internet than ever before, and this trend will continue steadily in the coming decades as well. The emergence of the IoT has propelled the development of various health practices aimed at improving population health. These services have been extensively informative and can be used for a variety of purposes across single condition and cluster condition management, including allowing healthcare professionals to track and monitor patient progress remotely, improving self-management of chronic conditions, assisting in the early detection of abnormalities, and accelerating symptom identification and clinical diagnoses. Further, IoT-powered apps have the potential to make better use of healthcare resources while providing high-quality, low-cost medical treatment. For instance, the Mobile MIM app was the first medical app in Apple's App Store. It is used to view, register, fuse, and show medical images from SPECT, PET, CT, MRI, X-ray, and ultrasound examinations for diagnosis purposes. Mobile MIM enhances physicians' access to pictures and allows them to consult with peers by providing wireless and portable access to medical images. AI can assist in creating an inbuilt system that prioritizes cases based on protocol requirements. For example, cases of stroke and trauma can be prioritized and assigned to the Radiologist's work lists, thereby saving many lives. An integrated cloud-based RIS/PACS platform incorporating AI capabilities will help radiologists review the cases automatically and simultaneously. With faster turnaround times, reduced radiologist burnout, and fewer errors, AI-powered and IoT-powered teleradiology platforms are expected to improve radiology interpretation and provide faster reports.
Asia Pacific Teleradiology Services Market Overview
The teleradiology services market in Asia Pacific is sub segmented into India, China, Japan, Australia, South Korea, and the Rest of Asia Pacific. Rising geriatric population; increasing chronic diseases; growing research activities and technological advancements; and surging number of startups, biotechnology, and biopharmaceutical companies are the factors favoring the market progress in this region. The rising prevalence of neurological diseases and the growing adoption of teleradiology services are boosting the market growth. China has experienced a significant rise in the elderly population. Stroke is the leading cause of death among older people across the country. According to the study published by Elsevier, 17.8 million cases of stroke, 3.4 million new strokes, and 2.3 million stroke-related deaths were reported in 2020. As per the data released by the World Health Organization in April 2020, in China, there were ~4,568,754 new cancer cases and 3,002,899 deaths due to cancer. According to a study published in 2023 in the Journal of the American Medical Association, chronic kidney disease (CKD) prevalence in people aged 18 years or older in Mainland China is recorded at 8.2%. Moreover, the latest data from the International Agency for Research on Cancer (IARC) indicates that the estimated age-standardized rate (ASR) for stomach cancer in China is 21 per 100,000, and the crude rate is 33.06; for pancreatic cancer, the ASR is 5 per 100,000 with the crude rate of 8.6. As per the same source, the estimated number of new cases of stomach cancer and pancreatic cancer in people aged 0-74 in 2020 (for both sexes) was 478,508 and 124,994, respectively. Thus, the high burden of chronic diseases propels the demand for teleradiology services in China.
Asia Pacific Teleradiology Services Market Revenue and Forecast to 2030 (US$ Million)
Asia Pacific Teleradiology Services Market Segmentation
The Asia Pacific teleradiology services market is categorized into deployment type, modality, application, end user, and country.
Based on deployment type, the Asia Pacific teleradiology services market is bifurcated into cloud-based and web-based. The cloud-based segment held a larger Asia Pacific teleradiology services market share in 2022.
In terms of modality, the Asia Pacific teleradiology services market is segmented into MRI, CT-scan, X-ray, ultrasound, and others. The CT-scan segment held the largest Asia Pacific teleradiology services market share in 2022.
By application, the Asia Pacific teleradiology services market is divided into musculoskeletal system, gastroenterology, cardiology, oncology, neurology, and others. The musculoskeletal system segment held the largest Asia Pacific teleradiology services market share in 2022.
In terms of end user, the Asia Pacific teleradiology services market is categorized into hospitals and clinics, diagnostic and imaging centers, others. The hospitals and clinics segment held the largest Asia Pacific teleradiology services market share in 2022.
By country, the Asia Pacific teleradiology services market is segmented into China, Japan, Australia, India, South Korea, and the Rest of Asia Pacific. China dominated the Asia Pacific teleradiology services market share in 2022.
Aster Medical Imaging LLC, medavis GmbH, Teleradiology Solutions Inc, TeleDiagnosys LLC, and Agilus Diagnostics Ltd are some of the leading companies operating in the Asia Pacific teleradiology services market.
Table Of Contents
1. Introduction
- 1.1 The Insight Partners Research Report Guidance
- 1.2 Market Segmentation
2. Executive Summary
- 2.1 Key Insights
3. Research Methodology
- 3.1 Coverage
- 3.2 Secondary Research
- 3.3 Primary Research
4. Asia Pacific Teleradiology Services Market - Key Market Dynamics
- 4.1 Asia Pacific Teleradiology Services Market - Key Market Dynamics
- 4.2 Market Drivers:
- 4.2.1 Shortage of Radiologist and Doctors
- 4.2.2 Growing Adoption of Teleradiology Services
- 4.3 Market Restraints
- 4.3.1 Security and Privacy Concerns
- 4.4 Market Opportunities
- 4.4.1 Adoption of Artificial Intelligence (AI) in Teleradiology
- 4.5 Future Trends
- 4.5.1 Promising 5G Technology to Enhance
- 4.6 Impact of Drivers and Restraints:
5. Teleradiology Services Market - Asia Pacific Market Analysis
- 5.1 Asia Pacific Teleradiology Services Market Revenue (US$ Million), 2020-2030
- 5.2 Asia Pacific Teleradiology Services Market Forecast Analysis
6. Asia Pacific Teleradiology Services Market Analysis - by Deployment Type
- 6.1 Cloud-based
- 6.1.1 Overview
- 6.1.2 Cloud-based: Asia Pacific Teleradiology Services Market - Revenue and Forecast to 2030 (US$ Million)
- 6.2 Web-based
- 6.2.1 Overview
- 6.2.2 Web-based: Asia Pacific Teleradiology Services Market - Revenue and Forecast to 2030 (US$ Million)
7. Asia Pacific Teleradiology Services Market Analysis - by Modality
- 7.1 MRI
- 7.1.1 Overview
- 7.1.2 MRI: Asia Pacific Teleradiology Services Market - Revenue and Forecast to 2030 (US$ Million)
- 7.2 CT-Scan
- 7.2.1 Overview
- 7.2.2 CT-Scan: Asia Pacific Teleradiology Services Market - Revenue and Forecast to 2030 (US$ Million)
- 7.3 X-ray
- 7.3.1 Overview
- 7.3.2 X-ray: Asia Pacific Teleradiology Services Market - Revenue and Forecast to 2030 (US$ Million)
- 7.4 Ultrasound
- 7.4.1 Overview
- 7.4.2 Ultrasound: Asia Pacific Teleradiology Services Market - Revenue and Forecast to 2030 (US$ Million)
- 7.5 Others
- 7.5.1 Overview
- 7.5.2 Others: Asia Pacific Teleradiology Services Market - Revenue and Forecast to 2030 (US$ Million)
8. Asia Pacific Teleradiology Services Market Analysis - by Application
- 8.1 Musculoskeletal System
- 8.1.1 Overview
- 8.1.2 Musculoskeletal System: Asia Pacific Teleradiology Services Market - Revenue and Forecast to 2030 (US$ Million)
- 8.2 Gastroenterology
- 8.2.1 Overview
- 8.2.2 Gastroenterology: Asia Pacific Teleradiology Services Market - Revenue and Forecast to 2030 (US$ Million)
- 8.3 Cardiology
- 8.3.1 Overview
- 8.3.2 Cardiology: Asia Pacific Teleradiology Services Market - Revenue and Forecast to 2030 (US$ Million)
- 8.4 Oncology
- 8.4.1 Overview
- 8.4.2 Oncology: Asia Pacific Teleradiology Services Market - Revenue and Forecast to 2030 (US$ Million)
- 8.5 Neurology
- 8.5.1 Overview
- 8.5.2 Neurology: Asia Pacific Teleradiology Services Market - Revenue and Forecast to 2030 (US$ Million)
- 8.6 Others
- 8.6.1 Overview
- 8.6.2 Others: Asia Pacific Teleradiology Services Market - Revenue and Forecast to 2030 (US$ Million)
9. Asia Pacific Teleradiology Services Market Analysis - by End User
- 9.1 Hospitals and Clinics
- 9.1.1 Overview
- 9.1.2 Hospitals and Clinics: Asia Pacific Teleradiology Services Market - Revenue and Forecast to 2030 (US$ Million)
- 9.2 Diagnostic and Imaging Centers
- 9.2.1 Overview
- 9.2.2 Diagnostic and Imaging Centers: Asia Pacific Teleradiology Services Market - Revenue and Forecast to 2030 (US$ Million)
- 9.3 Others
- 9.3.1 Overview
- 9.3.2 Others: Asia Pacific Teleradiology Services Market - Revenue and Forecast to 2030 (US$ Million)
10. Asia Pacific Teleradiology Services Market - Country Analysis
- 10.1 Asia Pacific
- 10.1.1 Asia Pacific: Teleradiology Services Market - Revenue and Forecast Analysis - by Country
- 10.1.1.1 Asia Pacific: Teleradiology Services Market - Revenue and Forecast Analysis - by Country
- 10.1.1.2 China: Teleradiology Services Market - Revenue and Forecast to 2030 (US$ Million)
- 10.1.1.2.1 China: Teleradiology Services Market Breakdown, by Deployment Type
- 10.1.1.2.2 China: Teleradiology Services Market Breakdown, by Modality
- 10.1.1.2.3 China: Teleradiology Services Market Breakdown, by Application
- 10.1.1.2.4 China: Teleradiology Services Market Breakdown, by End User
- 10.1.1.3 Japan: Teleradiology Services Market - Revenue and Forecast to 2030 (US$ Million)
- 10.1.1.3.1 Japan: Teleradiology Services Market Breakdown, by Deployment Type
- 10.1.1.3.2 Japan: Teleradiology Services Market Breakdown, by Modality
- 10.1.1.3.3 Japan: Teleradiology Services Market Breakdown, by Application
- 10.1.1.3.4 Japan: Teleradiology Services Market Breakdown, by End User
- 10.1.1.4 India: Teleradiology Services Market - Revenue and Forecast to 2030 (US$ Million)
- 10.1.1.4.1 India: Teleradiology Services Market Breakdown, by Deployment Type
- 10.1.1.4.2 India: Teleradiology Services Market Breakdown, by Modality
- 10.1.1.4.3 India: Teleradiology Services Market Breakdown, by Application
- 10.1.1.4.4 India: Teleradiology Services Market Breakdown, by End User
- 10.1.1.5 South Korea: Teleradiology Services Market - Revenue and Forecast to 2030 (US$ Million)
- 10.1.1.5.1 South Korea: Teleradiology Services Market Breakdown, by Deployment Type
- 10.1.1.5.2 South Korea: Teleradiology Services Market Breakdown, by Modality
- 10.1.1.5.3 South Korea: Teleradiology Services Market Breakdown, by Application
- 10.1.1.5.4 South Korea: Teleradiology Services Market Breakdown, by End User
- 10.1.1.6 Australia: Teleradiology Services Market - Revenue and Forecast to 2030 (US$ Million)
- 10.1.1.6.1 Australia: Teleradiology Services Market Breakdown, by Deployment Type
- 10.1.1.6.2 Australia: Teleradiology Services Market Breakdown, by Modality
- 10.1.1.6.3 Australia: Teleradiology Services Market Breakdown, by Application
- 10.1.1.6.4 Australia: Teleradiology Services Market Breakdown, by End User
- 10.1.1.7 Rest of Asia Pacific: Teleradiology Services Market - Revenue and Forecast to 2030 (US$ Million)
- 10.1.1.7.1 Rest of Asia Pacific: Teleradiology Services Market Breakdown, by Deployment Type
- 10.1.1.7.2 Rest of Asia Pacific: Teleradiology Services Market Breakdown, by Modality
- 10.1.1.7.3 Rest of Asia Pacific: Teleradiology Services Market Breakdown, by Application
- 10.1.1.7.4 Rest of Asia Pacific: Teleradiology Services Market Breakdown, by End User
- 10.1.1 Asia Pacific: Teleradiology Services Market - Revenue and Forecast Analysis - by Country
11. Company Profiles
- 11.1 Aster Medical Imaging LLC
- 11.1.1 Key Facts
- 11.1.2 Business Description
- 11.1.3 Products and Services
- 11.1.4 Financial Overview
- 11.1.5 SWOT Analysis
- 11.1.6 Key Developments
- 11.2 medavis GmbH
- 11.2.1 Key Facts
- 11.2.2 Business Description
- 11.2.3 Products and Services
- 11.2.4 Financial Overview
- 11.2.5 SWOT Analysis
- 11.2.6 Key Developments
- 11.3 Teleradiology Solutions Inc
- 11.3.1 Key Facts
- 11.3.2 Business Description
- 11.3.3 Products and Services
- 11.3.4 Financial Overview
- 11.3.5 SWOT Analysis
- 11.3.6 Key Developments
- 11.4 TeleDiagnosys LLC
- 11.4.1 Key Facts
- 11.4.2 Business Description
- 11.4.3 Products and Services
- 11.4.4 Financial Overview
- 11.4.5 SWOT Analysis
- 11.4.6 Key Developments
- 11.5 Agilus Diagnostics Ltd
- 11.5.1 Key Facts
- 11.5.2 Business Description
- 11.5.3 Products and Services
- 11.5.4 Financial Overview
- 11.5.5 SWOT Analysis
- 11.5.6 Key Developments
12. Appendix
- 12.1 About Us
- 12.2 Glossary of Terms
