|
|
市場調査レポート
商品コード
1533065
粉塵防止剤/抑制剤のアジア太平洋市場、2030年までの予測 - 地域別分析:化学物質タイプ別、最終用途産業別Asia Pacific Dust Control or Suppression Chemicals Market Forecast to 2030 - Regional Analysis - by Chemical Type and End-Use Industry |
||||||
|
|||||||
|
|||||||

| 粉塵防止剤/抑制剤のアジア太平洋市場、2030年までの予測 - 地域別分析:化学物質タイプ別、最終用途産業別 |
|
出版日: 2024年06月04日
発行: The Insight Partners
ページ情報: 英文 106 Pages
納期: 即納可能
|

全表示
- 概要
- 図表
- 目次
アジア太平洋の粉塵防止剤/抑制剤市場は、2022年に3億6,331万米ドルと評価され、2030年には5億1,283万米ドルに達し、2022年から2030年までのCAGRで4.4%の成長が予測されています。
製薬・食品加工産業の力強い成長がアジア太平洋の粉塵防止剤/抑制剤市場を後押し
アジア太平洋の医薬品市場は、北米に次いで世界第2位です。アジア太平洋市場は2021年までに、現在3位の西欧を上回ると予想されています。この背景には、人口規模、特に高齢者人口、1人当たりGDP、医療費、規制の枠組み、医師の意識、疾患の流行など、数多くの要因があります。例えば、Invest Indiaによると、インドの医薬品市場は2024年には650億米ドル、2030年には1,300億米ドルに成長すると予想されています。製薬業界の発展は技術革新を後押しし、国内で臨床研究を行うための環境を整えます。原薬製造、錠剤プレス、錠剤コーティング、噴霧乾燥、造粒などの製薬工程は、粉塵の発生につながります。
現在、アジア太平洋地域では、加工食品の量は国によって異なります。日本はアジア最大の食品加工市場を持ち続けていますが、市場が飽和しているため、将来的には中国やインドよりも成長が鈍化すると予測されています。中国とインドの食品加工部門は、一人当たり所得の上昇、労働者階級の拡大、調理済み食品の人気の高まりによって牽引されると予想されます。国際貿易協定や地域貿易協定によってもたらされた貿易自由化は、アジア太平洋地域の食品加工セクターの成長を促進し、市場参入企業に市場アクセスの拡大をもたらします。例えば、2021年 4月から2022年 3月にかけてのインドの食品加工セクターへの直接投資は7億972万米ドルでした。また、タイは現在、その急速な発展により、東南アジア全体で最も先進的な食品加工産業の1つを保有しています。多くの中規模以上の食品加工業者が、国内市場と国際市場の両方に向けてより高品質の商品を生産しています。2020年、タイの加工食品輸出額は194億米ドルに達しました。粉塵防止剤/抑制剤は、食品安全と従業員の健康の両方の観点から、食品加工において重要な側面です。加工環境に粉塵が存在すると、衛生上の懸念、微生物汚染、健康問題、その他の危険の原因となります。食品加工業者はまた、いくつかの政府機関や国際機関による食品加工粉塵の管理に関する規制を遵守しています。このように、食品加工産業の強い存在は、粉塵防止剤/抑制剤市場に有利な機会を創出すると予測されています。
アジア太平洋の粉塵防止剤/抑制剤市場の概要
アジア太平洋地域では都市化が進み、商業および住宅プロジェクトの建設が増加しています。さらに、この地域の一人当たり所得は、手頃な価格の住宅ビルの開発と相まって増加しています。アジア太平洋地域における外資系企業の進出が増加していることから、新しいオフィス、生産拠点、ビルに対する需要が生まれ、同地域の建設セクターを牽引しています。そのため、同地域の建設業界の成長は、粉塵抑制剤の需要を押し上げています。
アジア太平洋地域は、中国とインドによる消費が最も多く、世界市場を独占しています。インド政府は、高速道路網を強化するため、経済回廊、高速道路、国境・沿岸道路を6万6,100km建設するインフラプロジェクトを開始しました。同様に、国際貿易局によると、2019年から2021年にかけて、中国の建設業界の収益は9,680億米ドルから1兆1,000億米ドルに増加すると予想されています。中国の都市化率は世界で最も高い水準にあります。したがって、インドの道路や高速道路建設への巨額の投資と中国の建設産業の成長により、粉塵抑制剤市場は予測期間中に大幅に成長すると予測されます。
アジア太平洋の粉塵防止剤/抑制剤市場の収益と2030年までの予測(金額)
アジア太平洋の粉塵防止剤/抑制剤市場のセグメンテーション
アジア太平洋の粉塵防止剤/抑制剤市場は、化学物質タイプ、最終用途産業、国に基づいてセグメント化されます。化学物質タイプ別では、アジア太平洋地域の粉塵防止剤/抑制剤市場は、リグニンスルホン酸塩、塩化カルシウム、塩化マグネシウム、アスファルトエマルジョン、オイルエマルジョン、ポリマーエマルジョン、その他に区分されます。塩化カルシウムセグメントは2022年に最大の市場シェアを占めました。
最終用途産業の観点から、アジア太平洋の粉塵防止剤/抑制剤市場は鉱業、建設、石油・ガス、食品・食品・飲料、繊維、ガラス・セラミックス、医薬品、その他に分類されます。2022年には鉱業セグメントが最大の市場シェアを占めています。
国別に見ると、アジア太平洋地域の粉塵防止剤/抑制剤市場は、オーストラリア、中国、インド、日本、韓国、その他アジア太平洋地域に区分されます。2022年のアジア太平洋の粉塵防止剤/抑制剤市場シェアは中国が独占。
Benetech Inc、Veolia Environnement SA、Ecolab Inc、Quaker Chemical Corp、Dow Inc、BASF SE、Solenis LLC、Borregaard ASAは、アジア太平洋の粉塵防止剤/抑制剤市場で事業を展開する大手企業の一部です。
目次
第1章 イントロダクション
第2章 エグゼクティブサマリー
- 主要市場洞察
- 市場の魅力
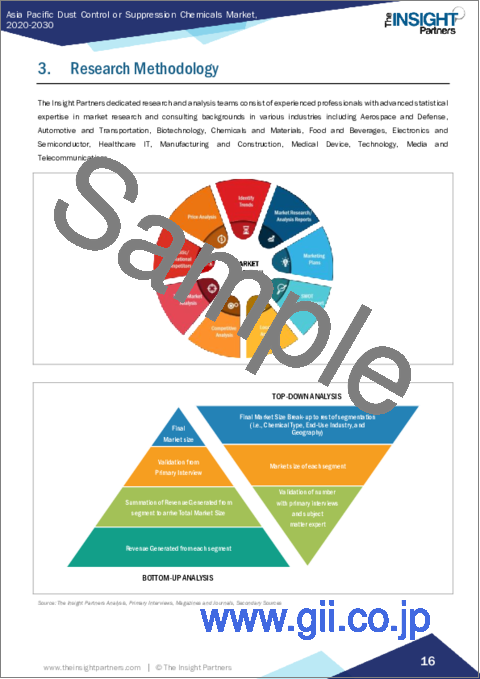
第3章 調査手法
- 調査範囲
- 2次調査
- 1次調査
第4章 アジア太平洋の粉塵防止剤/抑制剤市場情勢
- ポーターのファイブフォース分析
- 供給企業の交渉力
- 買い手の交渉力
- 新規参入業者の脅威
- 競争企業間の敵対関係
- 代替品の脅威
- エコシステム分析
第5章 アジア太平洋の粉塵防止剤/抑制剤市場:主要産業力学
- 市場促進要因
- 建設業界における粉塵防止剤/抑制剤需要の増加
- 鉱業部門における投資と操業の増加
- 市場抑制要因
- 代替品の入手可能性
- 市場機会
- 製薬・食品加工産業の力強い成長
- 今後の動向
- バイオベース粉塵抑制剤に関する研究
- 促進要因と抑制要因の影響
第6章 粉塵防止剤/抑制剤市場:アジア太平洋の市場分析
- 粉塵防止剤/抑制剤市場の収益、2022年~2030年
- 粉塵防止剤/抑制剤市場の数量(キロトン)、2022年~2030年
- 粉塵防止剤/抑制剤市場の予測・分析
第7章 アジア太平洋の粉塵防止剤/抑制剤市場分析:化学物質タイプ別
- リグニンスルホン酸塩
- 塩化カルシウム
- 塩化マグネシウム
- アスファルトエマルジョン
- オイルエマルジョン
- ポリマーエマルジョン
- その他
第8章 アジア太平洋の粉塵防止剤/抑制剤市場分析:最終用途産業別
- 鉱業
- 建設
- 石油・ガス
- 食品・飲料
- 繊維
- ガラス・セラミックス
- 医薬品
- その他
第9章 アジア太平洋の粉塵防止剤/抑制剤市場:国別分析
第10章 業界情勢
- 製品発売
第11章 競合情勢
- 主要プレーヤーによるヒートマップ分析
第12章 企業プロファイル
- Benetech Inc
- Veolia Environnement SA
- Ecolab Inc
- Quaker Chemical Corp
- Dow Inc
- BASF SE
- Solenis LLC
- Borregaard ASA
第13章 付録
List Of Tables
- Table 1. Dust Control or Suppression Chemicals Market Segmentation
- Table 2. Dust Control or Suppression Chemicals Market Revenue and Forecasts to 2030 (US$ Million)
- Table 3. Dust Control or Suppression Chemicals Market Volume and Forecasts to 2030 (Kilo Tons)
- Table 4. Dust Control or Suppression Chemicals Market Revenue and Forecasts to 2030 (US$ Million) - Chemical Type
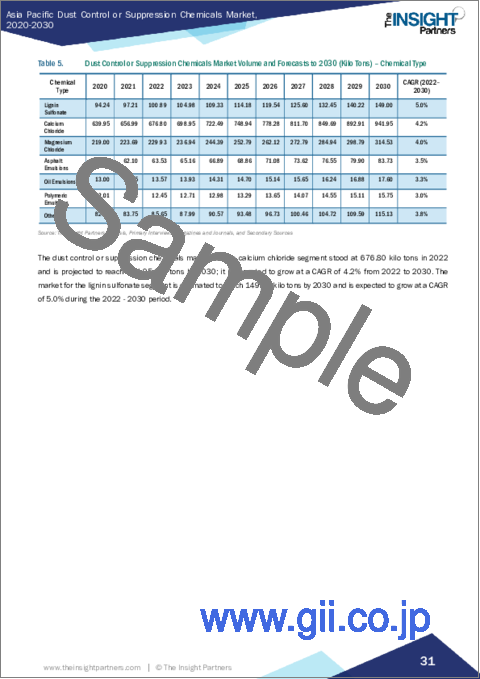
- Table 5. Dust Control or Suppression Chemicals Market Volume and Forecasts to 2030 (Kilo Tons) - Chemical Type
- Table 6. Dust Control or Suppression Chemicals Market Revenue and Forecasts to 2030 (US$ Million) - End-Use Industry
- Table 7. Australia Dust Control or Suppression Chemicals Market Revenue and Forecasts to 2030 (US$ Mn) - By Chemical Type
- Table 8. Australia Dust Control or Suppression Chemicals Market Volume and Forecasts to 2030 (Kilo Tons) - By Chemical Type
- Table 9. Australia Dust Control or Suppression Chemicals Market Revenue and Forecasts to 2030 (US$ Mn) - By End-Use Industry
- Table 10. China Dust Control or Suppression Chemicals Market Revenue and Forecasts to 2030 (US$ Mn) - By Chemical Type
- Table 11. China Dust Control or Suppression Chemicals Market Volume and Forecasts to 2030 (Kilo Tons) - By Chemical Type
- Table 12. China Dust Control or Suppression Chemicals Market Revenue and Forecasts to 2030 (US$ Mn) - By End-Use Industry
- Table 13. India Dust Control or Suppression Chemicals Market Revenue and Forecasts to 2030 (US$ Mn) - By Chemical Type
- Table 14. India Dust Control or Suppression Chemicals Market Volume and Forecasts to 2030 (Kilo Tons) - By Chemical Type
- Table 15. India Dust Control or Suppression Chemicals Market Revenue and Forecasts to 2030 (US$ Mn) - By End-Use Industry
- Table 16. Japan Dust Control or Suppression Chemicals Market Revenue and Forecasts to 2030 (US$ Mn) - By Chemical Type
- Table 17. Japan Dust Control or Suppression Chemicals Market Volume and Forecasts to 2030 (Kilo Tons) - By Chemical Type
- Table 18. Japan Dust Control or Suppression Chemicals Market Revenue and Forecasts to 2030 (US$ Mn) - By End-Use Industry
- Table 19. South Korea Dust Control or Suppression Chemicals Market Revenue and Forecasts to 2030 (US$ Mn) - By Chemical Type
- Table 20. South Korea Dust Control or Suppression Chemicals Market Volume and Forecasts to 2030 (Kilo Tons) - By Chemical Type
- Table 21. South Korea Dust Control or Suppression Chemicals Market Revenue and Forecasts to 2030 (US$ Mn) - By End-Use Industry
- Table 22. Rest of Asia Pacific Dust Control or Suppression Chemicals Market Revenue and Forecasts to 2030 (US$ Mn) - By Chemical Type
- Table 23. Rest of Asia Pacific Dust Control or Suppression Chemicals Market Volume and Forecasts to 2030 (Kilo Tons) - By Chemical Type
- Table 24. Rest of Asia Pacific Dust Control or Suppression Chemicals Market Revenue and Forecasts to 2030 (US$ Mn) - By End-Use Industry
List Of Figures
- Figure 1. Dust Control or Suppression Chemicals Market Segmentation, By Country
- Figure 2. Porter's Five Forces Analysis
- Figure 3. Ecosystem: Dust Control or Suppression Chemicals Market
- Figure 4. Dust Control or Suppression Chemicals Market - Key Industry Dynamics
- Figure 5. Impact Analysis of Drivers and Restraints
- Figure 6. Dust Control or Suppression Chemicals Market Revenue (US$ Million), 2022 - 2030
- Figure 7. Dust Control or Suppression Chemicals Market Volume (Kilo Tons), 2022 - 2030
- Figure 8. Dust Control or Suppression Chemicals Market Share (%) - Chemical Type, 2022 and 2030
- Figure 9. Lignin Sulfonate Market Revenue and Forecasts to 2030 (US$ Million)
- Figure 10. Lignin Sulfonate Market Volume and Forecasts to 2030 (Kilo Tons)
- Figure 11. Calcium Chloride Market Revenue and Forecasts to 2030 (US$ Million)
- Figure 12. Calcium Chloride Market Volume and Forecasts to 2030 (Kilo Tons)
- Figure 13. Magnesium Chloride Market Revenue and Forecasts to 2030 (US$ Million)
- Figure 14. Magnesium Chloride Market Volume and Forecasts to 2030 (Kilo Tons)
- Figure 15. Asphalt Emulsions Market Revenue and Forecasts to 2030 (US$ Million)
- Figure 16. Asphalt Emulsions Market Volume and Forecasts to 2030 (Kilo Tons)
- Figure 17. Oil Emulsions Market Revenue and Forecasts to 2030 (US$ Million)
- Figure 18. Oil Emulsions Market Volume and Forecasts to 2030 (Kilo Tons)
- Figure 19. Polymeric Emulsions Market Revenue and Forecasts to 2030 (US$ Million)
- Figure 20. Polymeric Emulsions Market Volume and Forecasts to 2030 (Kilo Tons)
- Figure 21. Others Market Revenue and Forecasts to 2030 (US$ Million)
- Figure 22. Others Market Volume and Forecasts to 2030 (Kilo Tons)
- Figure 23. Dust Control or Suppression Chemicals Market Share (%) - End-Use Industry, 2022 and 2030
- Figure 24. Mining Market Revenue and Forecasts to 2030 (US$ Million)
- Figure 25. Construction Market Revenue and Forecasts to 2030 (US$ Million)
- Figure 26. Oil and Gas Market Revenue and Forecasts to 2030 (US$ Million)
- Figure 27. Food and Beverage Market Revenue and Forecasts to 2030 (US$ Million)
- Figure 28. Textile Market Revenue and Forecasts to 2030 (US$ Million)
- Figure 29. Glass and Ceramics Market Revenue and Forecasts to 2030 (US$ Million)
- Figure 30. Pharmaceuticals Market Revenue and Forecasts to 2030 (US$ Million)
- Figure 31. Others Market Revenue and Forecasts to 2030 (US$ Million)
- Figure 32. Asia Pacific Dust Control or Suppression Chemicals Market, by Key Countries - Revenue (2022) (US$ Million)
- Figure 33. Asia Pacific Dust Control or Suppression Chemicals Market Breakdown By Key Countries, 2022 And 2030 (%)
- Figure 34. Australia Dust Control or Suppression Chemicals Market Revenue and Forecasts to 2030 (US$ Mn)
- Figure 35. Australia Dust Control or Suppression Chemicals Market Volume and Forecasts to 2030 (Kilo Tons)
- Figure 36. China Dust Control or Suppression Chemicals Market Revenue and Forecasts to 2030 (US$ Mn)
- Figure 37. China Dust Control or Suppression Chemicals Market Volume and Forecasts to 2030 (Kilo Tons)
- Figure 38. India Dust Control or Suppression Chemicals Market Revenue and Forecasts to 2030 (US$ Mn)
- Figure 39. India Dust Control or Suppression Chemicals Market Volume and Forecasts to 2030 (Kilo Tons)
- Figure 40. Japan Dust Control or Suppression Chemicals Market Revenue and Forecasts to 2030 (US$ Mn)
- Figure 41. Japan Dust Control or Suppression Chemicals Market Volume and Forecasts to 2030 (Kilo Tons)
- Figure 42. South Korea Dust Control or Suppression Chemicals Market Revenue and Forecasts to 2030 (US$ Mn)
- Figure 43. South Korea Dust Control or Suppression Chemicals Market Volume and Forecasts to 2030 (Kilo Tons)
- Figure 44. Rest of Asia Pacific Dust Control or Suppression Chemicals Market Revenue and Forecasts to 2030 (US$ Mn)
- Figure 45. Rest of Asia Pacific Dust Control or Suppression Chemicals Market Volume and Forecasts to 2030 (Kilo Tons)
- Figure 46. Heat Map Analysis by Key Players
The Asia Pacific dust control or suppression chemicals market was valued at US$ 363.31 million in 2022 and is expected to reach US$ 512.83 million by 2030; it is estimated to record a CAGR of 4.4% from 2022 to 2030.
Strong Growth in Pharmaceutical and Food Processing Industry Boosts Asia Pacific Dust Control or Suppression Chemicals Market
The pharmaceutical market in Asia Pacific is the second largest globally, following that of North America. It is anticipated that the Asia Pacific market will surpass Western Europe, which is presently ranked third, by 2021. Numerous factors are responsible for this, including the size of the population, particularly the geriatric population, GDP per capita, health care costs, regulatory frameworks, attitudes of physicians, and the prevalence of disease. For instance, as per Invest India, it is anticipated that India's pharmaceutical market will grow to US$ 65 billion and US$ 130 billion by 2024 and 2030, respectively. The development of the pharmaceutical industry boosts innovation and creates a conducive environment for conducting clinical research in the country. Pharmaceutical processes such as active pharmaceutical ingredients production, tablet presses, tablet coating, spray drying, and granulation lead to dust formation.
Currently, the amount of processed food varies from nation to nation in the Asia-Pacific region. Japan continues to have the biggest food processing market in Asia, but due to market saturation, it is predicted to grow more slowly in the future than China and India. The food processing sectors in China and India are anticipated to be driven by rising per capita income, an expanding working class, and the growing popularity of ready-to-eat food. Trade liberalization brought about by international and regional trade agreements is fostering growth in the Asia-Pacific food processing sector and will provide industry participants with increased access to markets. For instance, the FDI in India's food processing sector was US$ 709.72 million during April 2021-March 2022. Also, Thailand now possesses one of the most advanced food processing industries in all of Southeast Asia, owing to its rapid development. Many medium-sized and larger food processors create higher-quality goods for both local and international markets. In 2020, Thai exports of processed foods were valued at US$ 19.4 billion. Dust control or suppression is a significant aspect of food processing from both food safety and employee health perspective. The presence of dust in the processing environment can cause sanitation concerns, microbial contamination, health issues, and other hazards. Food processors also adhere to regulations for controlling food processing dust by several government and international authorities. Thus, strong presence of food processing industry is projected to create lucrative opportunities for the dust control or suppression chemicals market.
Asia Pacific Dust Control or Suppression Chemicals Market Overview
Asia Pacific is witnessing urbanization and the rising construction of commercial and residential projects. Additionally, the per capita income in the region has been increasing, coupled with the development of affordable residential buildings. The increasing expansion of foreign companies in Asia Pacific has created a demand for new offices, production houses, and buildings, thereby driving the construction sector in the region. Thus, the growing construction industry in the region boosts the demand for dust suppressant chemicals.
Asia Pacific dominated the market worldwide, with the largest consumption coming from China and India. The Government of India launched an infrastructure project to build 66,100 km of economic corridors, expressways, and border & coastal roads to boost the highway network. Similarly, according to the International Trade Administration, from 2019 to 2021, China's construction industry revenue is expected to increase from US$ 968 billion to US$ 1.1 trillion. China's urbanization rate is among the highest in the world. Thus, with the huge investment in roads and highway construction in India and the growing construction industry in China, the dust suppressant chemicals market is estimated to grow considerably during the forecast period.
Asia Pacific Dust Control or Suppression Chemicals Market Revenue and Forecast to 2030 (US$ Million)
Asia Pacific Dust Control or Suppression Chemicals Market Segmentation
The Asia Pacific dust control or suppression chemicals market is segmented based on chemical type, end-use industry, and country. Based on chemical type, the Asia Pacific dust control or suppression chemicals market is segmented into lignin sulfonate, calcium chloride, magnesium chloride, asphalt emulsions, oil emulsions, polymeric emulsions, and others. The calcium chloride segment held the largest market share in 2022.
In terms of end-use industry, the Asia Pacific dust control or suppression chemicals market is categorized into mining, construction, oil and gas, food and beverage, textile, glass and ceramics, pharmaceuticals, and others. The mining segment held the largest market share in 2022.
Based on country, the Asia Pacific dust control or suppression chemicals market is segmented into Australia, China, India, Japan, South Korea, and the Rest of Asia Pacific. China dominated the Asia Pacific dust control or suppression chemicals market share in 2022.
Benetech Inc, Veolia Environnement SA, Ecolab Inc, Quaker Chemical Corp, Dow Inc, BASF SE, Solenis LLC, and Borregaard ASA are some of the leading players operating in the Asia Pacific dust control or suppression chemicals market.
Table Of Contents
1. Introduction
- 1.1 The Insight Partners Research Report Guidance
- 1.2 Market Segmentation
2. Executive Summary
- 2.1 Key Market Insights
- 2.2 Market Attractiveness
3. Research Methodology
- 3.1 Coverage
- 3.2 Secondary Research
- 3.3 Primary Research
4. Asia Pacific Dust Control or Suppression Chemicals Market Landscape
- 4.1 Overview
- 4.2 Porter's Five Forces Analysis
- 4.2.1 Bargaining Power of Suppliers
- 4.2.2 Bargaining Power of Buyers
- 4.2.3 Threat of New Entrants
- 4.2.4 Intensity of Competitive Rivalry
- 4.2.5 Threat of Substitutes
- 4.3 Ecosystem Analysis
5. Asia Pacific Dust Control or Suppression Chemicals Market - Key Industry Dynamics
- 5.1 Market Drivers
- 5.1.1 Rising Demand for Dust Control or Suppression Chemicals from Construction Industry
- 5.1.2 Increasing Investments and Operations in Mining Sector
- 5.2 Market Restraints
- 5.2.1 Availability of Alternatives
- 5.3 Market Opportunities
- 5.3.1 Strong Growth in Pharmaceutical and Food Processing Industry
- 5.4 Future Trends
- 5.4.1 Research Related to Bio-Based Dust Suppression Agents
- 5.5 Impact of Drivers and Restraints:
6. Dust Control or Suppression Chemicals Market - Asia Pacific Market Analysis
- 6.1 Dust Control or Suppression Chemicals Market Revenue (US$ Million), 2022 - 2030
- 6.2 Dust Control or Suppression Chemicals Market Volume (Kilo Tons), 2022 - 2030
- 6.3 Dust Control or Suppression Chemicals Market Forecast and Analysis
7. Asia Pacific Dust Control or Suppression Chemicals Market Analysis - Chemical Type
- 7.1 Lignin Sulfonate
- 7.1.1 Overview
- 7.1.2 Lignin Sulfonate Market Revenue and Forecast to 2030 (US$ Million)
- 7.1.3 Lignin Sulfonate Market Volume and Forecast to 2030 (Kilo Tons)
- 7.2 Calcium Chloride
- 7.2.1 Overview
- 7.2.2 Calcium Chloride Market Revenue and Forecast to 2030 (US$ Million)
- 7.2.3 Calcium Chloride Market Volume and Forecast to 2030 (Kilo Tons)
- 7.3 Magnesium Chloride
- 7.3.1 Overview
- 7.3.2 Magnesium Chloride Market Revenue and Forecast to 2030 (US$ Million)
- 7.3.3 Magnesium Chloride Market Volume and Forecast to 2030 (Kilo Tons)
- 7.4 Asphalt Emulsions
- 7.4.1 Overview
- 7.4.2 Asphalt Emulsions Market Revenue and Forecast to 2030 (US$ Million)
- 7.4.3 Asphalt Emulsions Market Volume and Forecast to 2030 (Kilo Tons)
- 7.5 Oil Emulsions
- 7.5.1 Overview
- 7.5.2 Oil Emulsions Market Revenue and Forecast to 2030 (US$ Million)
- 7.5.3 Oil Emulsions Market Volume and Forecast to 2030 (Kilo Tons)
- 7.6 Polymeric Emulsions
- 7.6.1 Overview
- 7.6.2 Polymeric Emulsions Market Revenue and Forecast to 2030 (US$ Million)
- 7.6.3 Polymeric Emulsions Market Volume and Forecast to 2030 (Kilo Tons)
- 7.7 Others
- 7.7.1 Overview
- 7.7.2 Others Market Revenue and Forecast to 2030 (US$ Million)
- 7.7.3 Others Market Volume and Forecast to 2030 (Kilo Tons)
8. Asia Pacific Dust Control or Suppression Chemicals Market Analysis - End-Use Industry
- 8.1 Mining
- 8.1.1 Overview
- 8.1.2 Mining Market Revenue and Forecast to 2030 (US$ Million)
- 8.2 Construction
- 8.2.1 Overview
- 8.2.2 Construction Market Revenue and Forecast to 2030 (US$ Million)
- 8.3 Oil and Gas
- 8.3.1 Overview
- 8.3.2 Oil and Gas Market Revenue and Forecast to 2030 (US$ Million)
- 8.4 Food and Beverage
- 8.4.1 Overview
- 8.4.2 Food and Beverage Market Revenue and Forecast to 2030 (US$ Million)
- 8.5 Textile
- 8.5.1 Overview
- 8.5.2 Textile Market Revenue and Forecast to 2030 (US$ Million)
- 8.6 Glass and Ceramics
- 8.6.1 Overview
- 8.6.2 Glass and Ceramics Market Revenue and Forecast to 2030 (US$ Million)
- 8.7 Pharmaceuticals
- 8.7.1 Overview
- 8.7.2 Pharmaceuticals Market Revenue and Forecast to 2030 (US$ Million)
- 8.8 Others
- 8.8.1 Overview
- 8.8.2 Others Market Revenue and Forecast to 2030 (US$ Million)
9. Asia Pacific Dust Control or Suppression Chemicals Market - by Country Analysis
- 9.1 Asia Pacific Dust Control or Suppression Chemicals Market
- 9.1.1 Overview
- 9.1.1.1 Dust Control or Suppression Chemicals Market Breakdown by Country
- 9.1.1.2 Australia Dust Control or Suppression Chemicals Market Revenue and Forecasts to 2030 (US$ Mn)
- 9.1.1.3 Australia Dust Control or Suppression Chemicals Market Volume and Forecasts to 2030 (Kilo Tons)
- 9.1.1.3.1 Australia Dust Control or Suppression Chemicals Market Breakdown by Chemical Type
- 9.1.1.3.2 Australia Dust Control or Suppression Chemicals Market Breakdown by End-Use Industry
- 9.1.1.4 China Dust Control or Suppression Chemicals Market Revenue and Forecasts to 2030 (US$ Mn)
- 9.1.1.5 China Dust Control or Suppression Chemicals Market Volume and Forecasts to 2030 (Kilo Tons)
- 9.1.1.5.1 China Dust Control or Suppression Chemicals Market Breakdown by Chemical Type
- 9.1.1.5.2 China Dust Control or Suppression Chemicals Market Breakdown by End-Use Industry
- 9.1.1.6 India Dust Control or Suppression Chemicals Market Revenue and Forecasts to 2030 (US$ Mn)
- 9.1.1.7 India Dust Control or Suppression Chemicals Market Volume and Forecasts to 2030 (Kilo Tons)
- 9.1.1.7.1 India Dust Control or Suppression Chemicals Market Breakdown by Chemical Type
- 9.1.1.7.2 India Dust Control or Suppression Chemicals Market Breakdown by End-Use Industry
- 9.1.1.8 Japan Dust Control or Suppression Chemicals Market Revenue and Forecasts to 2030 (US$ Mn)
- 9.1.1.9 Japan Dust Control or Suppression Chemicals Market Volume and Forecasts to 2030 (Kilo Tons)
- 9.1.1.9.1 Japan Dust Control or Suppression Chemicals Market Breakdown by Chemical Type
- 9.1.1.9.2 Japan Dust Control or Suppression Chemicals Market Breakdown by End-Use Industry
- 9.1.1.10 South Korea Dust Control or Suppression Chemicals Market Revenue and Forecasts to 2030 (US$ Mn)
- 9.1.1.11 South Korea Dust Control or Suppression Chemicals Market Volume and Forecasts to 2030 (Kilo Tons)
- 9.1.1.11.1 South Korea Dust Control or Suppression Chemicals Market Breakdown by Chemical Type
- 9.1.1.11.2 South Korea Dust Control or Suppression Chemicals Market Breakdown by End-Use Industry
- 9.1.1.12 Rest of Asia Pacific Dust Control or Suppression Chemicals Market Revenue and Forecasts to 2030 (US$ Mn)
- 9.1.1.13 Rest of Asia Pacific Dust Control or Suppression Chemicals Market Volume and Forecasts to 2030 (Kilo Tons)
- 9.1.1.13.1 Rest of Asia Pacific Dust Control or Suppression Chemicals Market Breakdown by Chemical Type
- 9.1.1.13.2 Rest of Asia Pacific Dust Control or Suppression Chemicals Market Breakdown by End-Use Industry
- 9.1.1 Overview
10. Industry Landscape
- 10.1 Overview
- 10.2 Product launch
11. Competitive Landscape
- 11.1 Heat Map Analysis by Key Players
12. Company Profiles
- 12.1 Benetech Inc
- 12.1.1 Key Facts
- 12.1.2 Business Description
- 12.1.3 Products and Services
- 12.1.4 Financial Overview
- 12.1.5 SWOT Analysis
- 12.1.6 Key Developments
- 12.2 Veolia Environnement SA
- 12.2.1 Key Facts
- 12.2.2 Business Description
- 12.2.3 Products and Services
- 12.2.4 Financial Overview
- 12.2.5 SWOT Analysis
- 12.2.6 Key Developments
- 12.3 Ecolab Inc
- 12.3.1 Key Facts
- 12.3.2 Business Description
- 12.3.3 Products and Services
- 12.3.4 Financial Overview
- 12.3.5 SWOT Analysis
- 12.3.6 Key Developments
- 12.4 Quaker Chemical Corp
- 12.4.1 Key Facts
- 12.4.2 Business Description
- 12.4.3 Products and Services
- 12.4.4 Financial Overview
- 12.4.5 SWOT Analysis
- 12.4.6 Key Developments
- 12.5 Dow Inc
- 12.5.1 Key Facts
- 12.5.2 Business Description
- 12.5.3 Products and Services
- 12.5.4 Financial Overview
- 12.5.5 SWOT Analysis
- 12.5.6 Key Developments
- 12.6 BASF SE
- 12.6.1 Key Facts
- 12.6.2 Business Description
- 12.6.3 Products and Services
- 12.6.4 Financial Overview
- 12.6.5 SWOT Analysis
- 12.6.6 Key Developments
- 12.7 Solenis LLC
- 12.7.1 Key Facts
- 12.7.2 Business Description
- 12.7.3 Products and Services
- 12.7.4 Financial Overview
- 12.7.5 SWOT Analysis
- 12.7.6 Key Developments
- 12.8 Borregaard ASA
- 12.8.1 Key Facts
- 12.8.2 Business Description
- 12.8.3 Products and Services
- 12.8.4 Financial Overview
- 12.8.5 SWOT Analysis
- 12.8.6 Key Developments

