|
|
市場調査レポート
商品コード
1533045
北米のバイオリアクター市場の予測(~2030年):地域別分析 - 規模別、用途別、技術別、エンドユーザー別North America Bioreactors Market Forecast to 2030 - Regional Analysis - by Scale, Application, Technology, and End User |
||||||
|
|||||||
|
|||||||

| 北米のバイオリアクター市場の予測(~2030年):地域別分析 - 規模別、用途別、技術別、エンドユーザー別 |
|
出版日: 2024年06月05日
発行: The Insight Partners
ページ情報: 英文 76 Pages
納期: 即納可能
|

全表示
- 概要
- 図表
- 目次
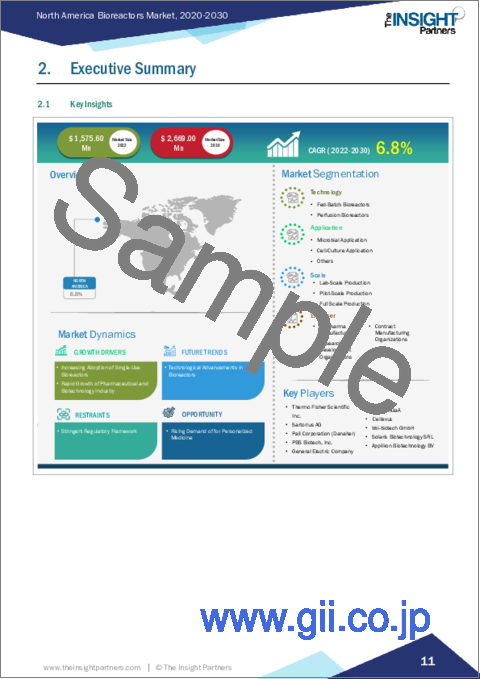
北米のバイオリアクターの市場規模は、2022年に15億7,560万米ドルに達し、2022~2030年にかけてCAGR 6.8%で成長し、2030年には26億6,900万米ドルに達すると予測されています。
シングルユースバイオリアクターの普及が北米のバイオリアクター市場を活性化
シングルユースバイオリアクター(SUB)は堅牢で、バイオ医薬品の商業生産に必要な高性能を発揮するため、さまざまなメーカーが開発を進めています。フィルム技術、攪拌機構、バイオリアクター設計、センサーシステムなどの利点が、ラボから生産スケールへの使い捨てリアクターの採用拡大に貢献しています。シングルユースバイオリアクターは、次世代細胞・遺伝子治療と連続バイオプロセスを提供します。細胞培養プロセスの進歩は、より高い力価と細胞密度を開発し、SUBの採用を促進しています。
シングルユースバイオリアクターは、コンタミネーションのリスクを軽減し、生産ターンアラウンドタイムを短縮します。ここ数年、シングルユースバイオリアクターの使用は、柔軟性の向上、投資の削減、運用コストの抑制という独自の能力により、最新のバイオ医薬品プロセスで増加しています。また、多くの企業が幅広い治療薬を製造するためのシングルユースバイオリアクターを開発しています。例えば、Thermo Fischer Scientificは2021年3月、3,000Lと5,000LのHyPerforma DynaDriveシングルユースバイオリアクターを発売しました。
検証時間の短縮は、シングルユースバイオリアクターの本質的な利点の一つです。シングルユースバイオリアクターの上流バイオプロセスへの採用が増加していることが、市場成長の原動力となっています。例えば、Sartorius AGは、幅広いシングルユースバイオリアクターを提供しています。同社は、10~15mLのマイクロバイオリアクタースケール向けにambr 15を、50~2000L向けにBiostat STRを提供しています。治療薬の生産にシングルユースバイオリアクターが受け入れられつつあることが、バイオリアクター市場を牽引しています。
北米のバイオリアクターの市場概要
米国はバイオリアクターの最大市場であり、米国の複数の市場プレーヤーが製薬会社やバイオテクノロジー企業の様々な用途向けにバイオリアクターを製造しています。新しいバイオリアクターの発売、地理的拡大、市場プレイヤーによる提携が市場の成長を牽引しています。2023年4月、BioMADEは、バイオリアクター技術を進歩させることにより、米国のバイオ工業製造における研究と採用のギャップに対処することに焦点を当てた5つの新規プロジェクトを発表しました。1,050万米ドルの資金提供を約束したこれらのプロジェクトは、エンジニアリング、ハードウェア開発、拡張性にまたがり、強固な経済を加速するための障壁に対処します。これらのプロジェクトは技術革新に重点を置き、Schmidt Futuresが支援するバイオリアクターの設計と開発を進めます。2023年4月、Cytivaは、シングルユース製品で上流のバイオプロセス業務を簡素化するXプラットフォームバイオリアクターを発売しました。当初、バイオリアクターのサイズは50Lと200Lでした。しかし、X-Platformバイオリアクターは、Figurate自動化ソリューションソフトウェアを搭載し、人間工学的改善、生産能力、サプライチェーン業務の簡素化を通じてプロセス効率を高めることができます。
北米のバイオリアクターの市場収益と2030年までの予測(100万米ドル)
北米のバイオリアクター市場セグメンテーション
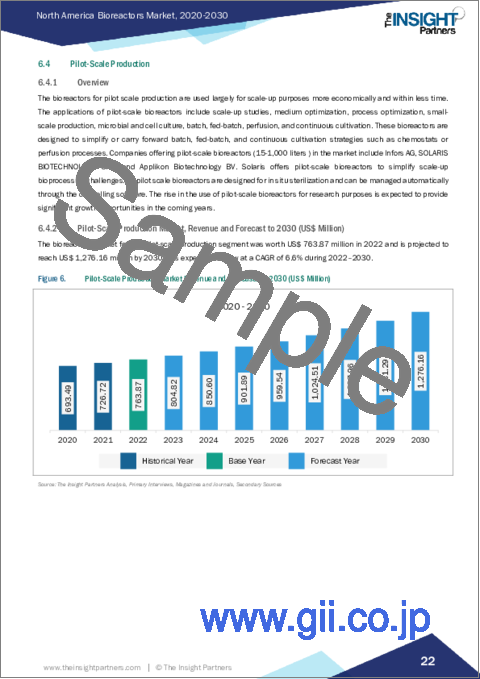
北米のバイオリアクター市場は、規模、用途、技術、エンドユーザー、国によって区分されます。規模に基づいて、北米のバイオリアクター市場はラボスケール生産、パイロットスケール生産、フルスケール生産に区分されます。パイロットスケール生産セグメントが2022年に最大の市場シェアを占めました。
用途別では、北米のバイオリアクター市場は微生物用途、細胞培養用途、その他に区分されます。細胞培養用途セグメントが2022年に最大の市場シェアを占めました。
技術別では、北米のバイオリアクター市場はフェドバッチバイオリアクターと灌流バイオリアクターに二分されます。フェドバッチバイオリアクターセグメントが2022年に大きな市場シェアを占めました。
エンドユーザーに基づき、北米のバイオリアクター市場はバイオ医薬品メーカー、研究開発機関、受託製造機関に分類されます。研究開発機関セグメントが2022年に最大の市場シェアを占めました。
国別では、北米のバイオリアクター市場は米国、カナダ、メキシコに区分されます。米国が2022年の北米のバイオリアクター市場シェアを独占しました。
PBS Biotech Inc、General Electric Co、Merck KGaA、Thermo Fisher Scientific Inc、Sartorius AG、Pall Corp、Solaris Biotechnology SRL、Applikon Biotechnology BVは、北米のバイオリアクター市場で事業展開している大手企業です。
目次
第1章 イントロダクション
第2章 エグゼクティブサマリー
- 主要な洞察
第3章 調査手法
- 調査範囲
- 2次調査
- 1次調査
第4章 北米のバイオリアクター市場 - 主要産業力学
- バイオリアクター市場:主要産業力学
- 市場促進要因
- シングルユースバイオリアクターの採用増加
- 製薬・バイオ産業の急成長
- 市場抑制要因
- 厳しい規制枠組み
- 市場機会
- 個別化医療に対する需要の高まり
- 今後の動向
- バイオリアクターの技術進歩
- 促進要因と抑制要因の影響
第5章 バイオリアクター市場:北米市場分析
- バイオリアクターの市場収益(2020~2030年)
第6章 北米のバイオリアクター市場分析:規模
- 概要
- バイオリアクター市場の収益シェア、規模別(2022年・2030年)
- ラボスケール生産
- パイロットスケール生産
- フルスケール生産
第7章 北米のバイオリアクター市場分析:用途
- 概要
- バイオリアクター市場の収益シェア、用途別(2022年・2030年)
- 微生物用途
- 細胞培養用途
- その他
第8章 北米のバイオリアクター市場分析:技術
- 概要
- バイオリアクター市場の収益シェア、技術別(2022年・2030年)
- フェドバッチバイオリアクター
- 灌流バイオリアクター
第9章 北米のバイオリアクター市場分析:エンドユーザー
- 概要
- バイオリアクター市場の収益シェア、エンドユーザー別(2022年・2030年)
- バイオ医薬品メーカー
- 研究開発機関
- 製造受託機関
第10章 北米のバイオリアクター市場:国別分析
第11章 バイオリアクター市場 - 産業情勢
- バイオリアクター市場における成長戦略
- 無機的成長戦略
- 有機的成長戦略
第12章 企業プロファイル
- PBS Biotech Inc
- General Electric Co
- Merck KGaA
- Thermo Fisher Scientific Inc
- Sartorius AG
- Pall Corp
- Solaris Biotechnology SRL
- Applikon Biotechnology BV
第13章 付録
List Of Tables
- Table 1. Bioreactors Market Segmentation
- Table 2. United States Bioreactors Market Revenue and Forecasts to 2030 (US$ Mn) - By Scale
- Table 3. United States Bioreactors Market Revenue and Forecasts to 2030 (US$ Mn) - By Application
- Table 4. United States Bioreactors Market Revenue and Forecasts to 2030 (US$ Mn) - By Technology
- Table 5. United States Bioreactors Market Revenue and Forecasts to 2030 (US$ Mn) - By End User
- Table 6. Canada Bioreactors Market Revenue and Forecasts to 2030 (US$ Mn) - By Scale
- Table 7. Canada Bioreactors Market Revenue and Forecasts to 2030 (US$ Mn) - By Application
- Table 8. Canada Bioreactors Market Revenue and Forecasts to 2030 (US$ Mn) - By Technology
- Table 9. Canada Bioreactors Market Revenue and Forecasts to 2030 (US$ Mn) - By End User
- Table 10. Mexico Bioreactors Market Revenue and Forecasts to 2030 (US$ Mn) - By Scale
- Table 11. Mexico Bioreactors Market Revenue and Forecasts to 2030 (US$ Mn) - By Application
- Table 12. Mexico Bioreactors Market Revenue and Forecasts to 2030 (US$ Mn) - By Technology
- Table 13. Mexico Bioreactors Market Revenue and Forecasts to 2030 (US$ Mn) - By End User
- Table 14. Recent Inorganic Growth Strategies in the Bioreactors Market
- Table 15. Recent Organic Growth Strategies in the Bioreactors Market
- Table 16. Glossary of Terms, Bioreactors Market
List Of Figures
- Figure 1. Bioreactors Market Segmentation, By Country
- Figure 2. Impact Analysis of Drivers and Restraints
- Figure 3. Bioreactors Market Revenue (US$ Million), 2020 - 2030
- Figure 4. Bioreactors Market Revenue Share, by Scale 2022 & 2030 (%)
- Figure 5. Lab-Scale Production Market Revenue and Forecasts to 2030 (US$ Million)
- Figure 6. Pilot-Scale Production Market Revenue and Forecasts to 2030 (US$ Million)
- Figure 7. Full-Scale Production Market Revenue and Forecasts to 2030 (US$ Million)
- Figure 8. Bioreactors Market Revenue Share, by Application 2022 & 2030 (%)
- Figure 9. Microbial Application Market Revenue and Forecasts to 2030 (US$ Million)
- Figure 10. Cell Culture Application Market Revenue and Forecasts to 2030 (US$ Million)
- Figure 11. Others Market Revenue and Forecasts to 2030 (US$ Million)
- Figure 12. Bioreactors Market Revenue Share, by Technology 2022 & 2030 (%)
- Figure 13. Fed-Batch Bioreactors Market Revenue and Forecasts to 2030 (US$ Million)
- Figure 14. Perfusion Bioreactors Market Revenue and Forecasts to 2030 (US$ Million)
- Figure 15. Bioreactors Market Revenue Share, by End User 2022 & 2030 (%)
- Figure 16. Biopharma Manufacturers Market Revenue and Forecasts to 2030 (US$ Million)
- Figure 17. Research and Development Organizations Market Revenue and Forecasts to 2030 (US$ Million)
- Figure 18. Contract Manufacturing Organization Market Revenue and Forecasts to 2030 (US$ Million)
- Figure 19. North America: Bioreactors Market, by Key Country - Revenue (2022) (US$ Million)
- Figure 20. North America Bioreactors Market Breakdown by Key Countries, 2022 and 2030 (%)
- Figure 21. United States Bioreactors Market Revenue and Forecasts to 2030 (US$ Mn)
- Figure 22. Canada Bioreactors Market Revenue and Forecasts to 2030 (US$ Mn)
- Figure 23. Mexico Bioreactors Market Revenue and Forecasts to 2030 (US$ Mn)
- Figure 24. Growth Strategies in the Bioreactors Market
The North America bioreactors market was valued at US$ 1,575.60 million in 2022 and is expected to reach US$ 2,669.00 million by 2030; it is estimated to grow at a CAGR of 6.8% from 2022 to 2030 .
Increasing Adoption of Single-Use Bioreactors Fuels North America Bioreactors Market
Various manufacturers are developing single-use bioreactors (SUBs) as they are robust and provide the high performance required for commercial manufacturing of biopharmaceuticals. Advantages such as film technologies, stirring mechanisms, bioreactor designs, and sensor systems have contributed toward increasing the adoption of disposable reactors from the lab to the production scale. The single-use bioreactors provide next-generation cell and gene therapies and continuous bioprocessing. The advancements in cell-culture processes have developed higher titers and cell densities, which have facilitated the adoption of SUBs.
Single-use bioreactors reduce the risks of contamination and decrease production turnaround times. In the last few years, the use of single-use bioreactors has increased in modern biopharmaceutical processes owing to their unique ability to enhance flexibility, reduce investment, and limit operational costs. Also, many companies have developed single-use bioreactors for producing a wide range of therapeutics. For instance, in March 2021, Thermo Fischer Scientific launched the 3,000 L and 5,000 L HyPerforma DynaDrive single-use bioreactors.
The reduction in validation time has been one of the essential benefits of single-use bioreactors. The rising adoption of single-use bioreactors for upstream bioprocessing is driving the market growth. For instance, Sartorius AG offers a wide range of single-use bioreactors. The company provides ambr 15 for a 10-15 mL micro bioreactor scale and Biostat STR for 50-2000L. The increasing acceptance of single-use bioreactors for the production of therapeutics is driving the market for bioreactors.
North America Bioreactors Market Overview
The US is the largest market for bioreactors-several market players in the US manufacture bioreactors for various applications in pharmaceutical and biotechnology companies. Launch of new bioreactors, geographical expansion, and partnerships by market players drive the growth of the market. In April 2023, BioMADE announced five new projects focused on addressing the research and adoption gaps in bioindustrial manufacturing in the US by advancing bioreactor technology. With a funding commitment of US$ 10.5 million, these projects would span engineering, hardware development, and scalability to address the barriers to accelerate a robust economy. These projects focus on innovation and will advance the design and development of bioreactors, supported by Schmidt Futures. In April 2023, Cytiva launched X-platform bioreactors to simplify upstream bioprocessing operations with single-use products. Initially, available sizes of bioreactors were 50 and 200L. However, the X-Platform bioreactors are equipped with Figurate automation solution software and can increase process efficiency through ergonomic improvements, production capacity, and simplified supply chain operations.
North America Bioreactors Market Revenue and Forecast to 2030 (US$ Million)
North America Bioreactors Market Segmentation
The North America bioreactors market is segmented based on scale, application, technology, end user, and country. Based on scale, the North America bioreactors market is segmented into lab-scale production, pilot-scale production, and full-scale production. The pilot-scale production segment held the largest market share in 2022.
In terms of application, the North America bioreactors market is segmented into microbial application, cell culture application, and others. The cell culture application segment held the largest market share in 2022.
By technology, the North America bioreactors market is bifurcated into fed-batch bioreactors and perfusion bioreactors. The fed-batch bioreactors segment held a larger market share in 2022.
Based on end user, the North America bioreactors market is categorized into biopharma manufacturers, research and development organizations, and contract manufacturing organization. The research and development organizations segment held the largest market share in 2022.
Based on country, the North America bioreactors market is segmented into the US, Canada, and Mexico. The US dominated the North America bioreactors market share in 2022.
PBS Biotech Inc, General Electric Co, Merck KGaA, Thermo Fisher Scientific Inc, Sartorius AG, Pall Corp, Solaris Biotechnology SRL, and Applikon Biotechnology BV are some of the leading players operating in the North America bioreactors market.
Table Of Contents
1. Introduction
- 1.1 The Insight Partners Research Report Guidance
- 1.2 Market Segmentation
2. Executive Summary
- 2.1 Key Insights
3. Research Methodology
- 3.1 Coverage
- 3.2 Secondary Research
- 3.3 Primary Research
4. North America Bioreactors Market - Key Industry Dynamics
- 4.1 Bioreactors Market - Key Industry Dynamics
- 4.2 Market Drivers
- 4.2.1 Increasing Adoption of Single-Use Bioreactors
- 4.2.2 Rapid Growth of Pharmaceutical and Biotechnology Industry
- 4.3 Market Restraints
- 4.3.1 Stringent Regulatory Framework
- 4.4 Market Opportunities
- 4.4.1 Rising Demand for Personalized Medicine
- 4.5 Future Trends
- 4.5.1 Technological Advancements in Bioreactors
- 4.6 Impact of Drivers and Restraints:
5. Bioreactors Market - North America Market Analysis
- 5.1 Overview
- 5.2 Bioreactors Market Revenue (US$ Million), 2020 - 2030
6. North America Bioreactors Market Analysis - Scale
- 6.1 Overview
- 6.2 Bioreactors Market Revenue Share, by Scale 2022 & 2030 (%)
- 6.3 Lab-Scale Production
- 6.3.1 Overview
- 6.3.2 Lab-Scale Production Market, Revenue and Forecast to 2030 (US$ Million)
- 6.4 Pilot-Scale Production
- 6.4.1 Overview
- 6.4.2 Pilot-Scale Production Market, Revenue and Forecast to 2030 (US$ Million)
- 6.5 Full-Scale Productions
- 6.5.1 Overview
- 6.5.2 Full-Scale Production Market, Revenue and Forecast to 2030 (US$ Million)
7. North America Bioreactors Market Analysis - Application
- 7.1 Overview
- 7.2 Bioreactors Market Revenue Share, by Application 2022 & 2030 (%)
- 7.3 Microbial Application
- 7.3.1 Overview
- 7.3.2 Microbial Application Market, Revenue and Forecast to 2030 (US$ Million)
- 7.4 Cell Culture Application
- 7.4.1 Overview
- 7.4.2 Cell Culture Application Market, Revenue and Forecast to 2030 (US$ Million)
- 7.5 Others
- 7.5.1 Overview
- 7.5.2 Others Market, Revenue and Forecast to 2030 (US$ Million)
8. North America Bioreactors Market Analysis - Technology
- 8.1 Overview
- 8.2 Bioreactors Market Revenue Share, by Technology 2022 & 2030 (%)
- 8.3 Fed-Batch Bioreactors
- 8.3.1 Overview
- 8.3.2 Fed-Batch Bioreactors Market, Revenue and Forecast to 2030 (US$ Million)
- 8.4 Perfusion Bioreactors
- 8.4.1 Overview
- 8.4.2 Perfusion Bioreactors Market, Revenue and Forecast to 2030 (US$ Million)
9. North America Bioreactors Market Analysis - End User
- 9.1 Overview
- 9.2 Bioreactors Market Revenue Share, by End User 2022 & 2030 (%)
- 9.3 Biopharma Manufacturers
- 9.3.1 Overview
- 9.3.2 Biopharma Manufacturers Market, Revenue and Forecast to 2030 (US$ Million)
- 9.4 Research and Development Organizations
- 9.4.1 Overview
- 9.4.2 Research and Development Organizations Market, Revenue and Forecast to 2030 (US$ Million)
- 9.5 Contract Manufacturing Organization
- 9.5.1 Overview
- 9.5.2 Contract Manufacturing Organization Market, Revenue and Forecast to 2030 (US$ Million)
10. North America Bioreactors Market - by Country Analysis
- 10.1 North America: Bioreactors Market
- 10.1.1 North America Bioreactors Market Revenue and Forecasts and Analysis - By Country
- 10.1.1.1 United States
- 10.1.1.2 Overview
- 10.1.1.3 US: Bioreactors Market - Revenue and Forecast to 2030 (US$ Million)
- 10.1.1.3.1 United States Bioreactors Market Breakdown by Scale
- 10.1.1.3.2 United States Bioreactors Market Breakdown by Application
- 10.1.1.3.3 United States Bioreactors Market Breakdown by Technology
- 10.1.1.3.4 United States Bioreactors Market Breakdown by End User
- 10.1.1.4 Canada
- 10.1.1.5 Overview
- 10.1.1.6 Canada: Bioreactors Market - Revenue and Forecast to 2030 (US$ Million)
- 10.1.1.6.1 Canada Bioreactors Market Breakdown by Scale
- 10.1.1.6.2 Canada Bioreactors Market Breakdown by Application
- 10.1.1.6.3 Canada Bioreactors Market Breakdown by Technology
- 10.1.1.6.4 Canada Bioreactors Market Breakdown by End User
- 10.1.1.7 Mexico
- 10.1.1.8 Overview
- 10.1.1.9 Mexico: Bioreactors Market - Revenue and Forecast to 2030 (US$ Million)
- 10.1.1.9.1 Mexico Bioreactors Market Breakdown by Scale
- 10.1.1.9.2 Mexico Bioreactors Market Breakdown by Application
- 10.1.1.9.3 Mexico Bioreactors Market Breakdown by Technology
- 10.1.1.9.4 Mexico Bioreactors Market Breakdown by End User
- 10.1.1 North America Bioreactors Market Revenue and Forecasts and Analysis - By Country
11. Bioreactors Market-Industry Landscape
- 11.1 Overview
- 11.2 Growth Strategies in the Bioreactors Market
- 11.3 Inorganic Growth Strategies
- 11.3.1 Overview
- 11.4 Organic Growth Strategies
- 11.4.1 Overview
12. Company Profiles
- 12.1 PBS Biotech Inc
- 12.1.1 Key Facts
- 12.1.2 Business Description
- 12.1.3 Products and Services
- 12.1.4 Financial Overview
- 12.1.5 SWOT Analysis
- 12.1.6 Key Developments
- 12.2 General Electric Co
- 12.2.1 Key Facts
- 12.2.2 Business Description
- 12.2.3 Products and Services
- 12.2.4 Financial Overview
- 12.2.5 SWOT Analysis
- 12.2.6 Key Developments
- 12.3 Merck KGaA
- 12.3.1 Key Facts
- 12.3.2 Business Description
- 12.3.3 Products and Services
- 12.3.4 Financial Overview
- 12.3.5 SWOT Analysis
- 12.3.6 Key Developments
- 12.4 Thermo Fisher Scientific Inc
- 12.4.1 Key Facts
- 12.4.2 Business Description
- 12.4.3 Products and Services
- 12.4.4 Financial Overview
- 12.4.5 SWOT Analysis
- 12.4.6 Key Developments
- 12.5 Sartorius AG
- 12.5.1 Key Facts
- 12.5.2 Business Description
- 12.5.3 Products and Services
- 12.5.4 Financial Overview
- 12.5.5 SWOT Analysis
- 12.5.6 Key Developments
- 12.6 Pall Corp
- 12.6.1 Key Facts
- 12.6.2 Business Description
- 12.6.3 Products and Services
- 12.6.4 Financial Overview
- 12.6.5 SWOT Analysis
- 12.6.6 Key Developments
- 12.7 Solaris Biotechnology SRL
- 12.7.1 Key Facts
- 12.7.2 Business Description
- 12.7.3 Products and Services
- 12.7.4 Financial Overview
- 12.7.5 SWOT Analysis
- 12.7.6 Key Developments
- 12.8 Applikon Biotechnology BV
- 12.8.1 Key Facts
- 12.8.2 Business Description
- 12.8.3 Products and Services
- 12.8.4 Financial Overview
- 12.8.5 SWOT Analysis
- 12.8.6 Key Developments
13. Appendix
- 13.1 About The Insight Partners
- 13.2 Glossary of Terms

