|
|
市場調査レポート
商品コード
1510729
北米の航空燃料カード市場:地域別分析 - タイプ別、用途別、予測(~2030年)North America Aviation Fuel Card Market Forecast to 2030 - Regional Analysis - by Type (Merchant and Branded) and Application (Commercial and Private) |
||||||
|
|||||||
| 北米の航空燃料カード市場:地域別分析 - タイプ別、用途別、予測(~2030年) |
|
出版日: 2024年05月07日
発行: The Insight Partners
ページ情報: 英文 72 Pages
納期: 即納可能
|
全表示
- 概要
- 図表
- 目次
北米の航空燃料カードの市場規模は、2022年に13億6,179万米ドルに達し、2022~2030年にかけてCAGR 8.0%で成長し、2030年には25億2,251万米ドルに達すると予測されています。
燃料消費の増加が北米の航空燃料カード市場を牽引
航空需要が高いため、燃料消費量が増加しています。2022年に米国の航空会社が運んだ旅客数は2021年より1億9,400万人増え、前年比30%増となりました。2022年1月から12月までに米国の航空会社が取り扱った旅客数は8億5,300万人で、2021年の6億5,800万人、2020年の3億8,800万人を上回りました。
国際クリーン輸送評議会が2019年に発表したデータによると、2018年、米国の国内航空会社は125億ガロンの燃料を消費し、2009年以来17%増加しました。2020年に米国エネルギー省が発表した予測によると、現在1,060億ガロンを消費している世界の商業用ジェット燃料市場は、2050年までに2,300億ガロン以上に成長すると予想されています。したがって、上記の統計は、航空旅行の増加に伴い燃料消費量が増加していることを示しています。歴史的に、航空産業は、燃料産業の経済状況や存在する協定に応じて、さまざまな方法で燃料の代金を支払ってきました。航空会社やその他の航空産業は、石油会社から直接、あるいは燃料ブローカーを通じて、スポット市場で燃料を購入することが多いです。しかし、従来の方法は、そのプロセスに多くの利害関係者が存在するため、はるかに高価でした。燃料カードによって、航空会社は認証されたサプライヤーや製造会社から直接購入できるようになった。加えて、燃料カードは燃料消費と追跡を可能にし、消費の最適化にさらに役立っています。このように、航空旅行の増加は全体的な燃料消費を増加させ、割引、コスト追跡、燃料品質などの様々な利点により燃料カードの採用を促進しています。
北米の航空燃料カードの市場概要
米国などの新興国市場は持続可能な航空燃料の開発に力を入れており、航空燃料カード市場に有利な機会を生み出しています。米国政府説明責任局によると、近年、米国では持続可能な航空燃料の生産と使用が増加しており、この燃料は現在、カリフォルニア州の2つの主要民間空港で航空会社に使用されています。米国では2022年に1,580万ガロンが生産されたが、米国の主要航空会社が使用するジェット燃料全体の0.1%に満たないです。航空燃料カードが提供する薄利多売と利点を考慮すると、航空燃料カードの採用と利用は予測期間中に増加すると予測されます。
北米の航空燃料カード市場の収益と2030年までの予測(100万米ドル)
北米の航空燃料カード市場セグメンテーション
北米の航空燃料カード市場は、タイプ、用途、国に分類されます。
タイプ別では、北米の航空燃料カード市場は加盟店とブランドに二分されます。2022年の北米の航空燃料カード市場シェアは、加盟店セグメントが大きいです。
用途別では、北米の航空燃料カード市場は商業用とプライベート用に二分されます。2022年の北米の航空燃料カード市場シェアは商業用セグメントが大きいです。
国別では、北米の航空燃料カード市場は米国、カナダ、メキシコに区分されます。米国が2022年の北米の航空燃料カード市場シェアを独占しました。
Shell Plc、BP Plc、Associated Energy Group LLC、TITAN Aviation Fuels Inc、CSI Enterprises Inc、TotalEnergies SE、EPIC Aviation LLC、Kropp Holdings Inc、Avfuel Corp、Multi Service Corp.などが北米の航空燃料カード市場で事業を展開している大手企業です。
目次
目次
第1章 イントロダクション
第2章 エグゼクティブサマリー
- 主要洞察
- 市場の魅力
第3章 調査手法
- 調査範囲
- 2次調査
- 1次調査
第4章 北米の航空燃料カードの市場情勢
- ポーター分析
- エコシステム分析
- 燃料カードサプライヤー
- エンドユーザー
- 航空燃料カードサプライヤーの一覧
第5章 北米の航空燃料カード市場:主要産業力学
- 北米の航空燃料カード市場:主要産業力学
- 市場促進要因
- 燃料消費量の増加
- 燃料カードによるコスト最適化の需要の高まり
- 市場抑制要因
- 代替決済手段の存在
- 市場機会
- 持続可能な航空燃料の採用拡大
- 今後の動向
- 新空港および固定基地オペレーターセンター建設への投資の増加
- 促進要因と抑制要因の影響
第6章 航空燃料カード市場:北米市場分析
- 北米の航空燃料カード市場収益(2020~2030年)
- 北米の航空燃料カード市場の予測と分析
第7章 北米の航空燃料カードの市場分析:タイプ別
- 加盟店
- ブランド
第8章 北米の航空燃料カードの市場分析:用途別
- 商業用
- プライベート用
第9章 北米の航空燃料カード市場:国別分析
- 米国
- カナダ
- メキシコ
第10章 産業情勢
- 市場イニシアティブ
- 製品開発
- 合併と買収
第11章 企業プロファイル
- Shell Plc
- BP Plc
- Associated Energy Group LLC
- TITAN Aviation Fuels Inc
- CSI Enterprises Inc
- TotalEnergies SE
- EPIC Aviation LLC
- Kropp Holdings Inc
- Avfuel Corp
- Multi Service Corp
第12章 付録
List Of Tables
- Table 1. North America Aviation Fuel Card Market Segmentation
- Table 2. List of Vendors in the Value Chain
- Table 3. North America Aviation Fuel Card Market Revenue and Forecasts to 2030 (US$ Million)
- Table 4. North America Aviation Fuel Card Market Revenue and Forecasts to 2030 (US$ Million) - Type
- Table 5. North America Aviation Fuel Card Market Revenue and Forecasts to 2030 (US$ Million) - Application
- Table 6. North America Aviation Fuel Card Market Revenue and Forecasts to 2030 (US$ Mn) - By Country
- Table 7. US Aviation Fuel Card Market Revenue and Forecasts to 2030 (US$ Mn) - By Type
- Table 8. US Aviation Fuel Card Market Revenue and Forecasts to 2030 (US$ Mn) - By Application
- Table 9. Canada Aviation Fuel Card Market Revenue and Forecasts to 2030 (US$ Mn) - By Type
- Table 10. Canada Aviation Fuel Card Market Revenue and Forecasts to 2030 (US$ Mn) - By Application
- Table 11. Mexico Aviation Fuel Card Market Revenue and Forecasts to 2030 (US$ Mn) - By Type
- Table 12. Mexico Aviation Fuel Card Market Revenue and Forecasts to 2030 (US$ Mn) - By Application
- Table 13. List of Abbreviation
List Of Figures
- Figure 1. North America Aviation Fuel Card Market Segmentation, By Country
- Figure 2. PORTER Analysis
- Figure 3. Ecosystem: North America Aviation Fuel Card Market
- Figure 4. Impact Analysis of Drivers and Restraints
- Figure 5. North America Aviation Fuel Card Market Revenue (US$ Million), 2020 - 2030
- Figure 6. North America Aviation Fuel Card Market Share (%) - Type, 2022 and 2030
- Figure 7. Merchant: North America Aviation Fuel Card Market Revenue and Forecasts to 2030 (US$ Million)
- Figure 8. Branded: North America Aviation Fuel Card Market Revenue and Forecasts to 2030 (US$ Million)
- Figure 9. North America Aviation Fuel Card Market Share (%) - Application, 2022 and 2030
- Figure 10. Commercial : North America Aviation Fuel Card Market Revenue and Forecasts to 2030 (US$ Million)
- Figure 11. Private : North America Aviation Fuel Card Market Revenue and Forecasts to 2030 (US$ Million)
- Figure 12. North America Aviation Fuel Card Market Revenue, by Key Countries, (2022) (US$ Mn)
- Figure 13. North America Aviation Fuel Card Market Breakdown by Key Countries, 2022 and 2030 (%)
- Figure 14. US Aviation Fuel Card Market Revenue and Forecasts to 2030 (US$ Mn)
- Figure 15. Canada Aviation Fuel Card Market Revenue and Forecasts to 2030 (US$ Mn)
- Figure 16. Mexico Aviation Fuel Card Market Revenue and Forecasts to 2030 (US$ Mn)
The North America Aviation fuel card market was valued at US$ 1,361.79 million in 2022 and is expected to reach US$ 2,522.51 million by 2030; it is estimated to register a CAGR of 8.0% from 2022 to 2030.
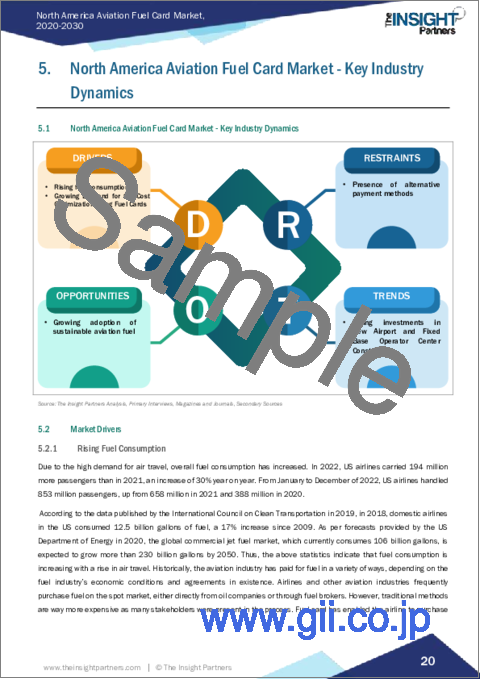
Rising Fuel Consumption Drives North America Aviation Fuel Card Market
Due to the high demand for air travel, overall fuel consumption has increased. In 2022, US airlines carried 194 million more passengers than in 2021, an increase of 30% year on year. From January to December of 2022, US airlines handled 853 million passengers, up from 658 million in 2021 and 388 million in 2020.
According to the data published by the International Council on Clean Transportation in 2019, in 2018, domestic airlines in the US consumed 12.5 billion gallons of fuel, a 17% increase since 2009. As per forecasts provided by the US Department of Energy in 2020, the global commercial jet fuel market, which currently consumes 106 billion gallons, is expected to grow more than 230 billion gallons by 2050. Thus, the above statistics indicate that fuel consumption is increasing with a rise in air travel. Historically, the aviation industry has paid for fuel in a variety of ways, depending on the fuel industry's economic conditions and agreements in existence. Airlines and other aviation industries frequently purchase fuel on the spot market, either directly from oil companies or through fuel brokers. However, traditional methods are way more expensive as many stakeholders were present in the process. Fuel card has enabled the airline to purchase directly from certified suppliers or the production company. In addition, fuel card allows fuel consumption and tracking, which further helps consumption optimization. Thus, growing air travel has increased overall fuel consumption, which drives the adoption of fuel cards owing to various benefits such as discounts, cost tracking, and fuel quality.
North America Aviation Fuel Card Market Overview
Developed nations such as the US is heavily developing sustainable aviation fuel, which is generating lucrative opportunities for the aviation fuel card market. As per the U.S. Government Accountability Office, in recent years, sustainable aviation fuel production and use in the US has increased; this fuel is now used by airlines at two major commercial airports in California. While the US produced 15.8 million gallons in 2022, it contributed to less than 0.1% of total jet fuel utilized by major U.S. airlines. Considering the thin margins and benefits offered by aviation fuel cards, the adoption and usage of aviation fuel card is projected to increase during the forecast period.
North America Aviation Fuel Card Market Revenue and Forecast to 2030 (US$ Million)
North America Aviation Fuel Card Market Segmentation
The North America aviation fuel card market is categorized into type, application, and country.
Based on type, the North America aviation fuel card market is bifurcated into merchant and branded. The merchant segment held a larger North America aviation fuel card market share in 2022.
In terms of application, the North America aviation fuel card market is bifurcated into commercial and private. The commercial segment held a larger North America aviation fuel card market share in 2022.
By country, the North America aviation fuel card market is segmented into the US, Canada, and Mexico. The US dominated the North America aviation fuel card market share in 2022.
Shell Plc, BP Plc, Associated Energy Group LLC, TITAN Aviation Fuels Inc, CSI Enterprises Inc, TotalEnergies SE, EPIC Aviation LLC, Kropp Holdings Inc, Avfuel Corp, and Multi Service Corp. are among the leading companies operating in the North America aviation fuel card market.
Table Of Contents
Table of Content
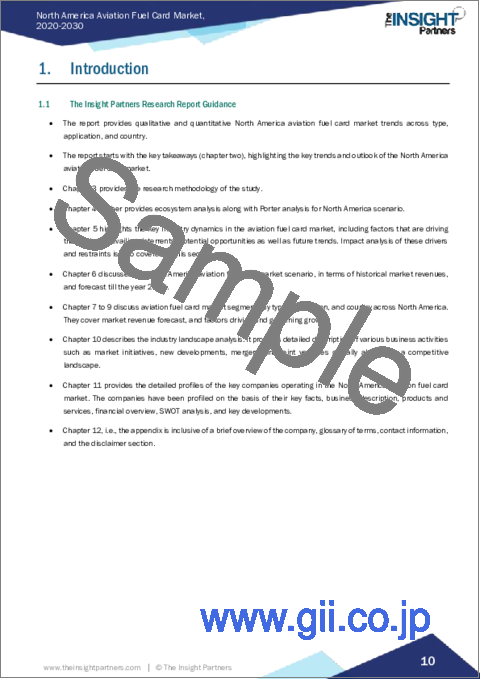
1. Introduction
- 1.1 The Insight Partners Research Report Guidance
- 1.2 Market Segmentation
2. Executive Summary
- 2.1 Key Insights
- 2.2 Market Attractiveness
3. Research Methodology
- 3.1 Coverage
- 3.2 Secondary Research
- 3.3 Primary Research
4. North America Aviation Fuel Card Market Landscape
- 4.1 Overview
- 4.2 PORTER Analysis
- 4.3 Ecosystem Analysis
- 4.3.1 Fuel Card Suppliers
- 4.3.1.1 Branded Fuel Card Suppliers
- 4.3.1.2 Merchant Fuel Card Suppliers
- 4.3.2 End Users
- 4.3.3 List of Aviation Fuel Card Suppliers
- 4.3.1 Fuel Card Suppliers
5. North America Aviation Fuel Card Market - Key Industry Dynamics
- 5.1 North America Aviation Fuel Card Market - Key Industry Dynamics
- 5.2 Market Drivers
- 5.2.1 Rising Fuel Consumption
- 5.2.2 Growing Demand for the Cost Optimization Using Fuel Cards
- 5.3 Market Restraints
- 5.3.1 Presence of Alternative Payment Methods
- 5.4 Market Opportunities
- 5.4.1 Growing Adoption of Sustainable Aviation Fuel
- 5.5 Future Trends
- 5.5.1 Rising Investments in New Airport and Fixed Base Operator Center Construction
- 5.6 Impact of Drivers and Restraints:
6. Aviation Fuel Card Market - North America Market Analysis
- 6.1 North America Aviation Fuel Card Market Revenue (US$ Million), 2020 - 2030
- 6.2 North America Aviation Fuel Card Market Forecast and Analysis
7. North America Aviation Fuel Card Market Analysis - Type
- 7.1 Merchant
- 7.1.1 Overview
- 7.1.2 Merchant: North America Aviation Fuel Card Market Revenue and Forecast to 2030 (US$ Million)
- 7.2 Branded
- 7.2.1 Overview
- 7.2.2 Branded: North America Aviation Fuel Card Market, Revenue and Forecast to 2030 (US$ Million)
8. North America Aviation Fuel Card Market Analysis - Application
- 8.1 Commercial
- 8.1.1 Overview
- 8.1.2 Commercial : North America Aviation Fuel Card Market Revenue and Forecast to 2030 (US$ Million)
- 8.2 Private
- 8.2.1 Overview
- 8.2.2 Private : North America Aviation Fuel Card Market Revenue and Forecast to 2030 (US$ Million)
9. North America Aviation Fuel Card Market - Country Analysis
- 9.1 Overview
- 9.1.1 North America Aviation Fuel Card Market Overview
- 9.1.2 North America Aviation Fuel Card Market Revenue and Forecasts and Analysis - By Country
- 9.1.2.1 North America Aviation Fuel Card Market Revenue and Forecasts and Analysis - By Country
- 9.1.2.2 US Aviation Fuel Card Market Revenue and Forecasts to 2030 (US$ Mn)
- 9.1.2.2.1 US Aviation Fuel Card Market Breakdown by Type
- 9.1.2.2.2 US Aviation Fuel Card Market Breakdown by Application
- 9.1.2.3 Canada Aviation Fuel Card Market Revenue and Forecasts to 2030 (US$ Mn)
- 9.1.2.3.1 Canada Aviation Fuel Card Market Breakdown by Type
- 9.1.2.3.2 Canada Aviation Fuel Card Market Breakdown by Application
- 9.1.2.4 Mexico Aviation Fuel Card Market Revenue and Forecasts to 2030 (US$ Mn)
- 9.1.2.4.1 Mexico Aviation Fuel Card Market Breakdown by Type
- 9.1.2.4.2 Mexico Aviation Fuel Card Market Breakdown by Application
10. Industry Landscape
- 10.1 Overview
- 10.2 Market Initiative
- 10.3 Product Development
- 10.4 Mergers & Acquisitions
11. Company Profiles
- 11.1 Shell Plc
- 11.1.1 Key Facts
- 11.1.2 Business Description
- 11.1.3 Products and Services
- 11.1.4 Financial Overview
- 11.1.5 SWOT Analysis
- 11.1.6 Key Developments
- 11.2 BP Plc
- 11.2.1 Key Facts
- 11.2.2 Business Description
- 11.2.3 Products and Services
- 11.2.4 Financial Overview
- 11.2.5 SWOT Analysis
- 11.2.6 Key Developments
- 11.3 Associated Energy Group LLC
- 11.3.1 Key Facts
- 11.3.2 Business Description
- 11.3.3 Products and Services
- 11.3.4 Financial Overview
- 11.3.5 SWOT Analysis
- 11.3.6 Key Developments
- 11.4 TITAN Aviation Fuels Inc
- 11.4.1 Key Facts
- 11.4.2 Business Description
- 11.4.3 Products and Services
- 11.4.4 Financial Overview
- 11.4.5 SWOT Analysis
- 11.4.6 Key Developments
- 11.5 CSI Enterprises Inc
- 11.5.1 Key Facts
- 11.5.2 Business Description
- 11.5.3 Products and Services
- 11.5.4 Financial Overview
- 11.5.5 SWOT Analysis
- 11.5.6 Key Developments
- 11.6 TotalEnergies SE
- 11.6.1 Key Facts
- 11.6.2 Business Description
- 11.6.3 Products and Services
- 11.6.4 Financial Overview
- 11.6.5 SWOT Analysis
- 11.6.6 Key Developments
- 11.7 EPIC Aviation LLC
- 11.7.1 Key Facts
- 11.7.2 Business Description
- 11.7.3 Products and Services
- 11.7.4 Financial Overview
- 11.7.5 SWOT Analysis
- 11.7.6 Key Developments
- 11.8 Kropp Holdings Inc
- 11.8.1 Key Facts
- 11.8.2 Business Description
- 11.8.3 Products and Services
- 11.8.4 Financial Overview
- 11.8.5 SWOT Analysis
- 11.8.6 Key Developments
- 11.9 Avfuel Corp
- 11.9.1 Key Facts
- 11.9.2 Business Description
- 11.9.3 Products and Services
- 11.9.4 Financial Overview
- 11.9.5 SWOT Analysis
- 11.9.6 Key Developments
- 11.10 Multi Service Corp
- 11.10.1 Key Facts
- 11.10.2 Business Description
- 11.10.3 Products and Services
- 11.10.4 Financial Overview
- 11.10.5 SWOT Analysis
- 11.10.6 Key Developments
12. Appendix
- 12.1 Word Index


