|
|
市場調査レポート
商品コード
1510657
北米の堅牢タブレット市場予測(~2030年):地域別分析 - タイプ、OS、用途別North America Rugged Tablet Market Forecast to 2030 - Regional Analysis - by Type, Operating System, and Application |
||||||
|
|||||||
|
|||||||

| 北米の堅牢タブレット市場予測(~2030年):地域別分析 - タイプ、OS、用途別 |
|
出版日: 2024年05月07日
発行: The Insight Partners
ページ情報: 英文 86 Pages
納期: 即納可能
|

全表示
- 概要
- 図表
- 目次
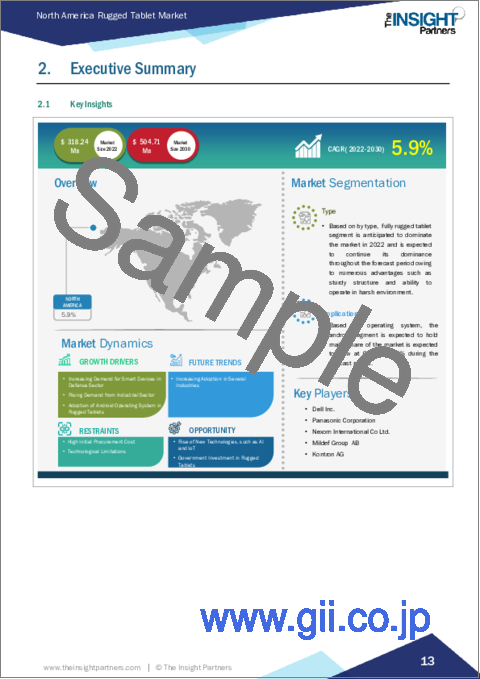
北米の堅牢タブレットの市場規模は、2022年に3億1,824万米ドルとなり、2030年には5億471万米ドルに達すると予測され、2022年~2030年のCAGRは5.9%で成長すると予測されています。
産業部門からの需要増加が北米の堅牢タブレット市場を後押し
製造、金属加工、建設、自動車などの産業部門は年々成長しています。米国では、2023年8月の鉱工業生産が前年同月比0.2%増となりました。堅牢タブレットは、産業分野でいくつかの用途があります。堅牢タブレットは、産業グレードの堅牢タブレットまたは産業用タブレットPCとも呼ばれ、産業環境における過酷な気候条件や厳しい操作に耐えられるように設計された特殊なタブレットコンピュータです。堅牢タブレットは、製造現場など最も過酷な状況にある産業用製造業で、在庫管理、機器の性能チェック、生産スケジュールのフォローなどに頻繁に使用されています。その強度と防水性により、埃や破片、液体への暴露にも耐えることができるため、厳しい産業環境での使用に最適です。耐久性の評価は、産業用製造環境において不可欠な要素です。
建設ユーティリティ製造部門向けに堅牢タブレットを提供している企業はいくつかあります。例えば、Zebra Technologies Corporationは、業界のワークフローを強化するためにZebra Xpad L10堅牢タブレットを提供しています。このように、産業部門からの需要の増加は、堅牢タブレット市場の成長を推進しています。
北米の堅牢タブレット市場の概要
北米の堅牢タブレット市場は、米国、カナダ、メキシコに区分されます。すべての産業事業の中で、米国の航空宇宙部門は最大の貿易収支(2019年に776億米ドル)と2番目に多い輸出量(1,480億米ドル相当)を生み出し続けています。過去10年間の平均5.31%の航空宇宙輸出の伸びと航空宇宙貿易収支の上昇により、この主導的地位は2010年以来数十年間、平均4.64%のまま維持されています。米国陸軍の戦闘指揮プラットフォームは、DRS Network & Imaging Systems LLCが提供する堅牢タブレットを使用しています。このように、航空宇宙・防衛産業の成長が米国の堅牢タブレット市場の成長を後押ししています。
さらに、複数の企業が堅牢タブレットのラインを拡大しています。2020年1月、Samsung Electronics CanadaはGalaxy Tab Active Proをカナダで発売すると宣言しました。CES Event OrganizationのInnovation Award Honoreeに選ばれた新しいギャラクシータブ・アクティブ・プロは、現場や道路、悪天候の中など、オフィスの外にいる人々のために設計されています。このような事例が北米の堅牢タブレット市場の成長を後押ししています。
北米の堅牢タブレット市場の収益と2030年までの予測(金額)
北米の堅牢タブレット市場のセグメンテーション
北米の堅牢タブレット市場は、タイプ、OS、用途、国によって区分されます。タイプ別では、北米の堅牢タブレット市場はフル堅牢タブレット、セミ牢タブレット、ウルトラ堅牢タブレットに区分されます。2022年には、フル堅牢タブレットセグメントが最大の市場シェアを占めました。
OSでは、北米の堅牢タブレット市場はAndroid、Windows、iOSに分類されます。Androidセグメントが2022年に最大の市場シェアを占めました。
用途別では、北米の堅牢タブレット市場は、航空宇宙・防衛、自動車、建設、エネルギー・公共事業、製造、石油・ガス、その他に分類されます。2022年には、航空宇宙・防衛セグメントが最大の市場シェアを占めました。
国別では、北米の堅牢タブレット市場は米国、カナダ、メキシコに区分されます。米国が2022年の北米の堅牢タブレット市場シェアを独占しました。
AAEON Technology Inc、Dell Technologies Inc、DT Research Inc、Panasonic Holdings Corp、Getac Holdings Corp、MilDef Group AB、NEXCOM International Co Ltd、Leonardo DRS Inc、Zebra Technologies Corp、Kontron AGは、北米の堅牢タブレット市場で事業を展開している主要企業の一部です。
目次
目次
第1章 イントロダクション
第2章 エグゼクティブサマリー
- 主要洞察
- 市場の魅力
第3章 調査手法
- 調査範囲
- 2次調査
- 1次調査
第4章 北米の堅牢タブレット市場情勢
- バリューチェーンのベンダー一覧
第5章 北米の堅牢タブレット市場:主要産業力学
- 促進要因
- 防衛分野におけるスマートデバイス需要の増加
- 産業分野からの需要増加
- 堅牢タブレットにおけるAndroidOSの採用
- 抑制要因
- 初期調達コストの高さ
- 技術的限界
- 機会
- AIやIoTなどの新技術の台頭
- 堅牢タブレットへの政府投資
- 今後の動向
- 複数の産業における採用の増加
- 促進要因と抑制要因の影響
第6章 堅牢タブレット市場:北米市場分析
- 北米の堅牢タブレット市場収益:2022年~2030年
第7章 北米の堅牢タブレット市場分析:タイプ
- フル堅牢タブレット
- フル堅牢タブレット市場の2030年までの収益と予測
- セミ堅牢タブレット
- セミ堅牢タブレット市場の2030年までの収益と予測
- ウルトラ堅牢タブレット
- ウルトラ堅牢タブレット市場の2030年までの市場収益と予測
第8章 北米の堅牢タブレット市場分析:OS
- Android
- Android市場の2030年までの収益と予測
- Windows
- Windows市場の2030年までの収益と予測
- iOS
- iO市場の2030年までの収益と予測
第9章 北米の堅牢タブレット市場分析:用途別
- 航空宇宙・防衛
- 航空宇宙・防衛市場の2030年までの収益と予測
- 自動車
- 自動車市場の2030年までの収益と予測
- 建設
- 建設市場の2030年までの収益と予測
- エネルギー・公益事業
- エネルギー・公益事業市場の2030年までの収益と予測
- 製造業
- 製造業市場の2030年までの収益と予測
- 石油・ガス
- 石油・ガス市場お2030年までの収益と予測
- その他
- その他市場の2030年までの収益と予測
第10章 北米の堅牢タブレット市場:国別分析
- 北米
- 米国
- カナダ
- メキシコ
第11章 堅牢タブレット市場業界情勢
- 市場イニシアティブ
- 新製品開発
- 合併と買収
第12章 企業プロファイル
- AAEON Technology Inc
- Dell Technologies Inc
- DT Research Inc
- Panasonic Holdings Corp
- Getac Holdings Corp
- MilDef Group AB
- NEXCOM International Co Ltd
- Leonardo DRS Inc
- Zebra Technologies Corp
- Kontron AG
第13章 付録
List Of Tables
- Table 1. Rugged Tablet Market Segmentation
- Table 2. Rugged Tablet Market Revenue and Forecasts to 2030 (US$ Million) - Type
- Table 3. Rugged Tablet Market Revenue and Forecasts to 2030 (US$ Million) - Operating System
- Table 4. Rugged Tablet Market Revenue and Forecasts to 2030 (US$ Million) - Application
- Table 5. North America Rugged Tablet Market, by Country - Revenue and Forecast to 2030 (USD Million)
- Table 6. US Rugged Tablet Market Revenue and Forecasts to 2030 (US$ Mn) - By Type
- Table 7. US Rugged Tablet Market Revenue and Forecasts to 2030 (US$ Mn) - By Operating System
- Table 8. US Rugged Tablet Market Revenue and Forecasts to 2030 (US$ Mn) - By Application
- Table 9. Canada Rugged Tablet Market Revenue and Forecasts to 2030 (US$ Mn) - By Type
- Table 10. Canada Rugged Tablet Market Revenue and Forecasts to 2030 (US$ Mn) - By Operating System
- Table 11. Canada Rugged Tablet Market Revenue and Forecasts to 2030 (US$ Mn) - By Application
- Table 12. Mexico Rugged Tablet Market Revenue and Forecasts to 2030 (US$ Mn) - By Type
- Table 13. Mexico Rugged Tablet Market Revenue and Forecasts to 2030 (US$ Mn) - By Operating System
- Table 14. Mexico Rugged Tablet Market Revenue and Forecasts to 2030 (US$ Mn) - By Application
- Table 15. List of Abbreviation
List Of Figures
- Figure 1. Rugged Tablet Market Segmentation, By Country
- Figure 2. Ecosystem: Rugged Tablet Market
- Figure 3. Rugged Tablet Market - Key Industry Dynamics
- Figure 4. Impact Analysis of Drivers and Restraints
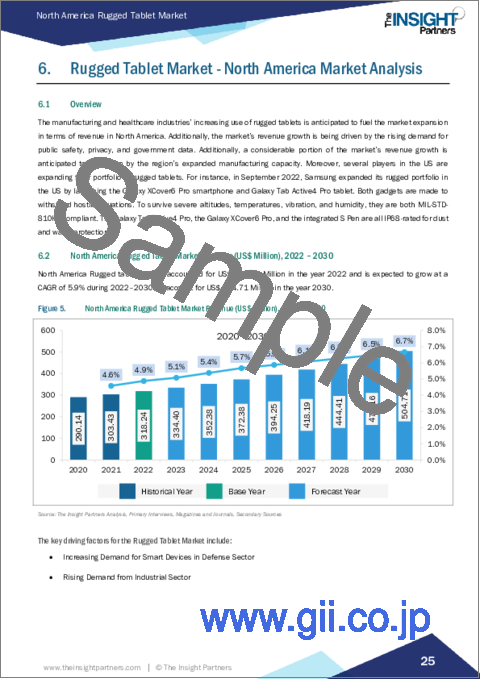
- Figure 5. North America Rugged Tablet Market Revenue (US$ Million), 2022 - 2030
- Figure 6. Rugged Tablet Market Share (%) - Type, 2022 and 2030
- Figure 7. Fully Rugged Tablet: Market Revenue and Forecasts to 2030 (US$ Million)
- Figure 8. Semi Rugged Tablet: Market Revenue and Forecasts to 2030 (US$ Million)
- Figure 9. Ultra Rugged Tablet: Market Revenue and Forecasts to 2030 (US$ Million)
- Figure 10. Rugged Tablet Market Share (%) - Operating System, 2022 and 2030
- Figure 11. Android: Market Revenue and Forecasts to 2030 (US$ Million)
- Figure 12. Windows: Market Revenue and Forecasts to 2030 (US$ Million)
- Figure 13. iOS: Market Revenue and Forecasts to 2030 (US$ Million)
- Figure 14. Rugged Tablet Market Share (%) - Application, 2022 and 2030
- Figure 15. Aerospace & Defense: Market Revenue and Forecasts to 2030 (US$ Million)
- Figure 16. Automotive: Market Revenue and Forecasts to 2030 (US$ Million)
- Figure 17. Construction: Market Revenue and Forecasts to 2030 (US$ Million)
- Figure 18. Energy & Utilities: Market Revenue and Forecasts to 2030 (US$ Million)
- Figure 19. Manufacturing: Market Revenue and Forecasts to 2030 (US$ Million)
- Figure 20. Oil & Gas: Market Revenue and Forecasts to 2030 (US$ Million)
- Figure 21. Others: Market Revenue and Forecasts to 2030 (US$ Million)
- Figure 22. Rugged Tablet market, by Key Countries - Revenue (2022) (US$ Million)
- Figure 23. Rugged Tablet market Breakdown by Key Countries, 2022 and 2030 (%)
- Figure 24. US Rugged Tablet Market Revenue and Forecasts to 2030 (US$ Mn)
- Figure 25. Canada Rugged Tablet Market Revenue and Forecasts to 2030 (US$ Mn)
- Figure 26. Mexico Rugged Tablet Market Revenue and Forecasts to 2030 (US$ Mn)
The North America rugged tablet market was valued at US$ 318.24 million in 2022 and is expected to reach US$ 504.71 million by 2030; it is estimated to grow at a CAGR of 5.9% from 2022 to 2030.
Rising Demand from Industrial Sector Fuels North America Rugged Tablet Market
The industrial sector, including manufacturing, metal fabrication, construction, and automotive, is growing year on year. In the US, the industrial production rose 0.2% YoY in August 2023. The rugged tablet has several applications in the industrial sector. A rugged tablet, also known as an industrial-grade ruggedized tablet or an industrial tablet PC, is a specialized tablet computer built to survive harsh climatic conditions and demanding operations in industrial environments. Rugged tablets are frequently used in industrial manufacturing in the roughest situations, such as on the manufacturing floor, to manage inventories, check equipment performance, and follow production schedules. They are perfect for use in demanding industrial conditions because of their strength and waterproofness, which can endure dust, debris, and liquid exposure. Ratings for durability are an essential factor in an industrial manufacturing environment.
Several players provide rugged tablets for the construction utilities manufacturing sectors. For instance, Zebra Technologies Corporation provides the Zebra Xpad l10 rugged tablet to enhance industry workflow. Thus, rising demand from the industrial sector propels the growth of the rugged tablet market.
North America Rugged Tablet Market Overview
The rugged tablet market in North America is segmented into the US, Canada, and Mexico. Among all industrial businesses, the aerospace sector in the US continues to produce the greatest trade balance (US $77.6 billion in 2019) and the second-highest volume of exports (worth US $148 billion). With growing aerospace exports at an average rate of 5.31% over the last ten years and the rising aerospace trade balance, this leading position has remained intact for decades at an average rate of 4.64% since 2010. The US Army battle command platform uses rugged tablets provided by the DRS Network & Imaging Systems LLC. Thus, growth of the aerospace & defense industry propels the US rugged tablet market growth.
Moreover, several players expand their line on rugged tablets. In January 2020, Samsung Electronics Canada declared that the Galaxy Tab Active Pro is now available in Canada. The new Galaxy Tab Active Pro, selected as an Innovation Award Honoree by the CES Event Organization, is designed for people outside the office, such as in the field, on the road, or in bad weather. Such instances boost the rugged tablet market growth in North America.
North America Rugged Tablet Market Revenue and Forecast to 2030 (US$ Million)
North America Rugged Tablet Market Segmentation
The North America rugged tablet market is segmented based on type, operating system, application, and country. Based on type, the North America rugged tablet market is segmented into fully rugged tablet, semi rugged tablet, and ultra rugged tablet. The fully rugged tablet segment held the largest market share in 2022.
In terms of operating system, the North America rugged tablet market is categorized into android, windows, and iOS. The android segment held the largest market share in 2022.
By application, the North America rugged tablet market is segmented into aerospace & defense, automotive, construction, energy & utilities, manufacturing, oil & gas, and others. The aerospace & defense segment held the largest market share in 2022.
Based on country, the North America rugged tablet market is segmented into the US, Canada, and Mexico. The US dominated the North America rugged tablet market share in 2022.
AAEON Technology Inc, Dell Technologies Inc, DT Research Inc, Panasonic Holdings Corp, Getac Holdings Corp, MilDef Group AB, NEXCOM International Co Ltd, Leonardo DRS Inc, Zebra Technologies Corp, and Kontron AG are some of the leading players operating in the North America rugged tablet market.
Table Of Contents
Table of Content
1. Introduction
- 1.1 The Insight Partners Research Report Guidance
- 1.2 Market Segmentation
2. Executive Summary
- 2.1 Key Insights
- 2.2 Market Attractiveness
3. Research Methodology
- 3.1 Coverage
- 3.2 Secondary Research
- 3.3 Primary Research
4. North America Rugged Tablet Market Landscape
- 4.1 Overview
- 4.1.1 List of Vendors in Value Chain
5. North America Rugged Tablet Market - Key Industry Dynamics
- 5.1 Drivers
- 5.1.1 Increasing Demand for Smart Devices in Defense Sector
- 5.1.2 Rising Demand from Industrial Sector
- 5.1.3 Adoption of Android Operating System in Rugged Tablets
- 5.2 Restraints
- 5.2.1 High Initial Procurement Cost
- 5.2.2 Technological Limitations
- 5.3 Opportunity
- 5.3.1 Rise of New Technologies, such as AI and IoT
- 5.3.2 Government Investment in Rugged Tablets
- 5.4 Future Trend
- 5.4.1 Increasing Adoption in Several Industries
- 5.5 Impact of Drivers and Restraints:
6. Rugged Tablet Market - North America Market Analysis
- 6.1 Overview
- 6.2 North America Rugged Tablet Market Revenue (US$ Million), 2022 - 2030
7. North America Rugged Tablet Market Analysis - Type
- 7.1 Fully Rugged Tablet
- 7.1.1 Overview
- 7.1.2 Fully Rugged Tablet: Market Revenue and Forecasts to 2030 (US$ Million)
- 7.2 Semi Rugged Tablet
- 7.2.1 Overview
- 7.2.2 Semi Rugged Tablet: Market Revenue and Forecasts to 2030 (US$ Million)
- 7.3 Ultra Rugged Tablet
- 7.3.1 Overview
- 7.3.2 Ultra Rugged Tablet: Market Revenue and Forecasts to 2030 (US$ Million)
8. North America Rugged Tablet Market Analysis - Operating System
- 8.1 Android
- 8.1.1 Overview
- 8.1.2 Android: Market Revenue and Forecasts to 2030 (US$ Million)
- 8.2 Windows
- 8.2.1 Overview
- 8.2.2 Windows: Market Revenue and Forecasts to 2030 (US$ Million)
- 8.3 iOS
- 8.3.1 Overview
- 8.3.2 iOS: Market Revenue and Forecasts to 2030 (US$ Million)
9. North America Rugged Tablet Market Analysis - Application
- 9.1 Aerospace & Defense
- 9.1.1 Overview
- 9.1.2 Aerospace & Defense: Market Revenue and Forecasts to 2030 (US$ Million)
- 9.2 Automotive
- 9.2.1 Overview
- 9.2.2 Automotive: Market Revenue and Forecasts to 2030 (US$ Million)
- 9.3 Construction
- 9.3.1 Overview
- 9.3.2 Construction: Market Revenue and Forecasts to 2030 (US$ Million)
- 9.4 Energy & Utilities
- 9.4.1 Overview
- 9.4.2 Energy & Utilities: Market Revenue and Forecasts to 2030 (US$ Million)
- 9.5 Manufacturing
- 9.5.1 Overview
- 9.5.2 Manufacturing: Market Revenue and Forecasts to 2030 (US$ Million)
- 9.6 Oil & Gas
- 9.6.1 Overview
- 9.6.2 Oil & Gas: Market Revenue and Forecasts to 2030 (US$ Million)
- 9.7 Others
- 9.7.1 Overview
- 9.7.2 Others: Market Revenue and Forecasts to 2030 (US$ Million)
10. North America Rugged Tablet Market - Country Analysis
- 10.1 North America
- 10.1.1 North America Rugged Tablet Market Revenue and Forecasts and Analysis - By Countries
- 10.1.1.1 North America Rugged Tablet Market Revenue and Forecasts and Analysis - By Country
- 10.1.1.2 US Rugged Tablet Market Revenue and Forecasts to 2030 (US$ Mn)
- 10.1.1.2.1 US Rugged Tablet Market Breakdown by Type
- 10.1.1.2.2 US Rugged Tablet Market Breakdown by Operating System
- 10.1.1.2.3 US Rugged Tablet Market Breakdown by Application
- 10.1.1.3 Canada Rugged Tablet Market Revenue and Forecasts to 2030 (US$ Mn)
- 10.1.1.3.1 Canada Rugged Tablet Market Breakdown by Type
- 10.1.1.3.2 Canada Rugged Tablet Market Breakdown by Operating System
- 10.1.1.3.3 Canada Rugged Tablet Market Breakdown by Application
- 10.1.1.4 Mexico Rugged Tablet Market Revenue and Forecasts to 2030 (US$ Mn)
- 10.1.1.4.1 Mexico Rugged Tablet Market Breakdown by Type
- 10.1.1.4.2 Mexico Rugged Tablet Market Breakdown by Operating System
- 10.1.1.4.3 Mexico Rugged Tablet Market Breakdown by Application
- 10.1.1 North America Rugged Tablet Market Revenue and Forecasts and Analysis - By Countries
11. Rugged Tablet Market Industry Landscape
- 11.1 Overview
- 11.2 Market Initiative
- 11.3 New Product Development
- 11.4 Merger and Acquisition
12. Company Profiles
- 12.1 AAEON Technology Inc
- 12.1.1 Key Facts
- 12.1.2 Business Description
- 12.1.3 Products and Services
- 12.1.4 Financial Overview
- 12.1.5 SWOT Analysis
- 12.1.6 Key Developments
- 12.2 Dell Technologies Inc
- 12.2.1 Key Facts
- 12.2.2 Business Description
- 12.2.3 Products and Services
- 12.2.4 Financial Overview
- 12.2.5 SWOT Analysis
- 12.2.6 Key Developments
- 12.3 DT Research Inc
- 12.3.1 Key Facts
- 12.3.2 Business Description
- 12.3.3 Products and Services
- 12.3.4 Financial Overview
- 12.3.5 SWOT Analysis
- 12.3.6 Key Developments
- 12.4 Panasonic Holdings Corp
- 12.4.1 Key Facts
- 12.4.2 Business Description
- 12.4.3 Products and Services
- 12.4.4 Financial Overview
- 12.4.5 SWOT Analysis
- 12.4.6 Key Developments
- 12.5 Getac Holdings Corp
- 12.5.1 Key Facts
- 12.5.2 Business Description
- 12.5.3 Products and Services
- 12.5.4 Financial Overview
- 12.5.5 SWOT Analysis
- 12.5.6 Key Developments
- 12.6 MilDef Group AB
- 12.6.1 Key Facts
- 12.6.2 Business Description
- 12.6.3 Products and Services
- 12.6.4 Financial Overview
- 12.6.5 SWOT Analysis
- 12.6.6 Key Developments
- 12.7 NEXCOM International Co Ltd
- 12.7.1 Key Facts
- 12.7.2 Business Description
- 12.7.3 Products and Services
- 12.7.4 Financial Overview
- 12.7.5 SWOT Analysis
- 12.7.6 Key Developments
- 12.8 Leonardo DRS Inc
- 12.8.1 Key Facts
- 12.8.2 Business Description
- 12.8.3 Products and Services
- 12.8.4 Financial Overview
- 12.8.5 SWOT Analysis
- 12.8.6 Key Developments
- 12.9 Zebra Technologies Corp
- 12.9.1 Key Facts
- 12.9.2 Business Description
- 12.9.3 Products and Services
- 12.9.4 Financial Overview
- 12.9.5 SWOT Analysis
- 12.9.6 Key Developments
- 12.10 Kontron AG
- 12.10.1 Key Facts
- 12.10.2 Business Description
- 12.10.3 Products and Services
- 12.10.4 Financial Overview
- 12.10.5 SWOT Analysis
- 12.10.6 Key Developments
13. Appendix
- 13.1 About The Insight Partners
- 13.2 Word Index

