|
|
市場調査レポート
商品コード
1498578
地熱発電の市場規模・予測、世界・地域別シェア、動向、成長機会分析レポート:プラントタイプ別、エンドユーザー別、地域別Geothermal Power Generation Market Size and Forecast, Global and Regional Share, Trend, and Growth Opportunity Analysis Report Coverage: By Plant Type, End User, and Geography |
||||||
|
|||||||
|
|||||||

| 地熱発電の市場規模・予測、世界・地域別シェア、動向、成長機会分析レポート:プラントタイプ別、エンドユーザー別、地域別 |
|
出版日: 2024年05月23日
発行: The Insight Partners
ページ情報: 英文 136 Pages
納期: 即納可能
|

全表示
- 概要
- 図表
- 目次
地熱発電の市場規模は、2023年の154億5,000万米ドルから2031年には271億4,000万米ドルに達すると予測されており、2022年から2030年までのCAGRは7.3%を記録すると予測されています。
地熱エネルギーは、発電のための主要な再生可能エネルギー源のひとつです。発電に十分なエネルギーを生み出すために、地熱発電所は地表から数キロメートル下に存在する熱に依存しています。地域によっては、地球のコアに水蒸気や熱水の形で自然に熱が存在することもあります。多くの国々が、フラッシュ蒸気、バイナリーサイクル、直接乾式蒸気など、地熱エネルギーを利用する方法を開発しています。地熱発電の種類は世界各地で異なります。例えば、アイスランドには簡単にアクセスできる温泉が数多くあり、ほとんどの人が安全で信頼性が高く、安価なエネルギー源として地熱泉に頼ることができます。米国のような他の国では、エネルギーを利用するためにコストのかかる地熱掘削プロセスが必要です。
フラッシュ蒸気発電所は、最も一般的なタイプの地熱発電所であり、2023年の地熱発電市場シェアで最大を記録しました。火山活動が活発な島国アイスランドは、一連のフラッシュ蒸気地熱発電所によって電力需要のほぼすべてをまかなっています。フラッシュ・スチーム・プロセスによって生成される蒸気と余剰温水は、寒い北極圏の冬に凍った歩道や駐車場を暖める。世界の地熱発電市場成長の原動力となっているのは、クリーンな発電に対する需要の高まり、地熱発電の認知度の向上、世界各地の地熱エネルギーの潜在力を利用するための投資です。しかし、地熱エネルギーの掘削や探査のコストが高いことや、地震が発生しやすい地殻変動地域の近くに地熱資源があることが、地熱発電市場の成長を抑制する要因のひとつとなっています。
とはいえ、技術の進歩は地熱発電市場の今後の動向を形成する上で重要な役割を果たしています。技術革新の主な分野の一つは、増進型地熱システム(EGS)の開発です。EGS技術は、熱交換を促進するために割れ目に水を注入することで、地下深くの高温の岩層に人工貯留層を形成するものです。これは、地熱事業の地理的範囲を大幅に拡大し、これまで未開拓だった資源を掘り起こす可能性を秘めています。従来の熱水システムに伴ういくつかの制限を克服することで、EGSは地熱発電の容量拡大と普及の可能性を開いた。
EGSに加え、バイナリーサイクルシステムの進歩は、もう一つの重要な技術的機会を示しています。バイナリーサイクル技術は、以前は不経済とされていた低温の地熱資源の利用を可能にします。このシステムは、水よりも沸点の低い二次流体を使ってタービンを駆動し、100℃という低温の地熱貯留層からエネルギーを回収します。この技術革新により、地熱発電が可能な場所の幅が広がり、より地理的に多様な場所からエネルギーを利用することが可能になります。このような技術の継続的な改善と導入は、地熱発電の経済的な実行可能性に貢献し、世界のエネルギー情勢において、地熱発電をより魅力的な選択肢にしています。
世界の地熱発電市場の分析は、プラントタイプ、エンドユーザー、地域によって区分されます。プラントタイプに基づき、地熱発電市場は直接乾式蒸気、フラッシュ蒸気、バイナリーサイクルに区分されます。エンドユーザー別では、住宅用、商業用、産業用に区分されます。地域別では、世界の地熱発電市場は4つの主要地域に区分される:北米、欧州、アジア太平洋地域、その他アジア太平洋地域、世界のその他の諸国です。
Northern California Power Agency、Turboden SpA、Toshiba Energy Systems &Solutions Corp、Berkshire Hathaway Inc、NIBE Industrier AB、General Electric Co.
地熱発電市場全体の規模は、一次情報と二次情報の両方を用いて導き出されています。徹底的な二次調査は、地熱発電市場シェアに関連する質的・量的情報を得るために、社内外の情報源を用いて実施されました。このプロセスはまた、すべての市場セグメントに関する概要と地熱発電市場予測を得るのにも役立っています。また、データを検証し、分析的洞察を得るために、業界関係者に複数の一次インタビューを行った。このプロセスには、副社長、市場開拓マネージャー、マーケットインテリジェンスマネージャー、国内営業マネージャーなどの業界専門家と、地熱発電市場を専門とする評価専門家、研究アナリスト、キーオピニオンリーダーなどの外部コンサルタントが参加しています。
目次
第1章 イントロダクション
第2章 エグゼクティブサマリー
- 主要洞察
- 市場の魅力分析
第3章 調査手法
第4章 地熱発電市場の情勢
- PEST分析
- エコシステム分析
- バリューチェーンのベンダー一覧
第5章 地熱発電市場- 主な市場力学
- 主な市場促進要因
- 主な市場抑制要因
- 主な市場機会
- 今後の動向
- 促進要因と抑制要因の影響分析
第6章 地熱発電市場-世界市場分析
- 地熱発電-世界市場概要
- 地熱発電の世界市場と2030年までの予測
第7章 地熱発電市場- 収益分析- プラントタイプ別、2020-2030年
- 直接乾燥蒸気
- フラッシュ蒸気
- バイナリーサイクル
第8章 地熱発電市場- 収益分析- エンドユーザー別、2020-2030年
- 住宅用
- 商業用
- 産業用
第9章 地熱発電市場- 収益分析- 地域別、2020-2030年
- 北米
- メキシコ
- 米国
- 欧州
- トルコ
- イタリア
- ロシア
- アイスランド
- その他欧州
- アジア太平洋
- 日本
- インドネシア
- フィリピン
- ニュージーランド
- その他アジア太平洋地域
- 世界のその他の地域
- チリ
- ケニア
- エルサルバドル
- 世界のその他の地域
第10章 業界情勢
- 合併と買収
- 契約、提携、合弁事業
- 新製品の上市
- 事業拡大とその他の戦略的展開
第11章 競合情勢
- 主要プレーヤーによるヒートマップ分析
- 企業のポジショニングと集中度
第12章 地熱発電市場- 主要企業プロファイル
- Enel Green Power
- Ormat Technologies Inc
- Toshiba Energy Systems and Solutions Corporation
- US Geothermal Inc
- Calpine Corporation
- Federal Electricity Commission
- Kenya Electricity Generating Company
- Reykjavik Energy
- Pertamina Geothermal Energy
- CalEnergy Generation
- Northern California Power Agency
第13章 付録
List Of Tables
- Table 1. Geothermal Power Generation Market Segmentation
- Table 2. Geothermal Power Generation Market - Revenue and Forecast to 2031 (US$ Million)
- Table 3. Geothermal Power Generation Market - Revenue and Forecast to 2031 (US$ Million) - by Plant Type
- Table 4. Geothermal Power Generation Market - Revenue and Forecast to 2031 (US$ Million) - by End User
- Table 5. North America: Geothermal Power Generation Market - Revenue and Forecast to 2031(US$ Million) - by Plant Type
- Table 6. North America: Geothermal Power Generation Market - Revenue and Forecast to 2031(US$ Million) - by End User
- Table 7. North America: Geothermal Power Generation Market - Revenue and Forecast to 2031(US$ Million) - by Country
- Table 8. United States: Geothermal Power Generation Market - Revenue and Forecast to 2031(US$ Million) - by Plant Type
- Table 9. United States: Geothermal Power Generation Market - Revenue and Forecast to 2031(US$ Million) - by End User
- Table 10. Mexico: Geothermal Power Generation Market - Revenue and Forecast to 2031(US$ Million) - by Plant Type
- Table 11. Mexico: Geothermal Power Generation Market - Revenue and Forecast to 2031(US$ Million) - by End User
- Table 12. Europe: Geothermal Power Generation Market - Revenue and Forecast to 2031(US$ Million) - by Plant Type
- Table 13. Europe: Geothermal Power Generation Market - Revenue and Forecast to 2031(US$ Million) - by End User
- Table 14. Europe: Geothermal Power Generation Market - Revenue and Forecast to 2031(US$ Million) - by Country
- Table 15. Turkey: Geothermal Power Generation Market - Revenue and Forecast to 2031(US$ Million) - by Plant Type
- Table 16. Turkey: Geothermal Power Generation Market - Revenue and Forecast to 2031(US$ Million) - by End User
- Table 17. Iceland: Geothermal Power Generation Market - Revenue and Forecast to 2031(US$ Million) - by Plant Type
- Table 18. Iceland: Geothermal Power Generation Market - Revenue and Forecast to 2031(US$ Million) - by End User
- Table 19. Italy: Geothermal Power Generation Market - Revenue and Forecast to 2031(US$ Million) - by Plant Type
- Table 20. Italy: Geothermal Power Generation Market - Revenue and Forecast to 2031(US$ Million) - by End User
- Table 21. Russia: Geothermal Power Generation Market - Revenue and Forecast to 2031(US$ Million) - by Plant Type
- Table 22. Russia: Geothermal Power Generation Market - Revenue and Forecast to 2031(US$ Million) - by End User
- Table 23. Rest of Europe: Geothermal Power Generation Market - Revenue and Forecast to 2031(US$ Million) - by Plant Type
- Table 24. Rest of Europe: Geothermal Power Generation Market - Revenue and Forecast to 2031(US$ Million) - by End User
- Table 25. Asia Pacific: Geothermal Power Generation Market - Revenue and Forecast to 2031(US$ Million) - by Plant Type
- Table 26. Asia Pacific: Geothermal Power Generation Market - Revenue and Forecast to 2031(US$ Million) - by End User
- Table 27. Asia Pacific: Geothermal Power Generation Market - Revenue and Forecast to 2031(US$ Million) - by Country
- Table 28. Japan: Geothermal Power Generation Market - Revenue and Forecast to 2031(US$ Million) - by Plant Type
- Table 29. Japan: Geothermal Power Generation Market - Revenue and Forecast to 2031(US$ Million) - by End User
- Table 30. Indonesia: Geothermal Power Generation Market - Revenue and Forecast to 2031(US$ Million) - by Plant Type
- Table 31. Indonesia: Geothermal Power Generation Market - Revenue and Forecast to 2031(US$ Million) - by End User
- Table 32. New Zealand: Geothermal Power Generation Market - Revenue and Forecast to 2031(US$ Million) - by Plant Type
- Table 33. New Zealand: Geothermal Power Generation Market - Revenue and Forecast to 2031(US$ Million) - by End User
- Table 34. Philippines: Geothermal Power Generation Market - Revenue and Forecast to 2031(US$ Million) - by Plant Type
- Table 35. Philippines: Geothermal Power Generation Market - Revenue and Forecast to 2031(US$ Million) - by End User
- Table 36. Rest of Asia Pacific: Geothermal Power Generation Market - Revenue and Forecast to 2031(US$ Million) - by Plant Type
- Table 37. Rest of Asia Pacific: Geothermal Power Generation Market - Revenue and Forecast to 2031(US$ Million) - by End User
- Table 38. Rest of World: Geothermal Power Generation Market - Revenue and Forecast to 2031(US$ Million) - by Plant Type
- Table 39. Rest of World: Geothermal Power Generation Market - Revenue and Forecast to 2031(US$ Million) - by End User
- Table 40. Rest of World: Geothermal Power Generation Market - Revenue and Forecast to 2031(US$ Million) - by Country
- Table 41. Chile: Geothermal Power Generation Market - Revenue and Forecast to 2031(US$ Million) - by Plant Type
- Table 42. Chile: Geothermal Power Generation Market - Revenue and Forecast to 2031(US$ Million) - by End User
- Table 43. Kenya: Geothermal Power Generation Market - Revenue and Forecast to 2031(US$ Million) - by Plant Type
- Table 44. Kenya: Geothermal Power Generation Market - Revenue and Forecast to 2031(US$ Million) - by End User
- Table 45. El Salvador: Geothermal Power Generation Market - Revenue and Forecast to 2031(US$ Million) - by Plant Type
- Table 46. El Salvador: Geothermal Power Generation Market - Revenue and Forecast to 2031(US$ Million) - by End User
- Table 47. Others: Geothermal Power Generation Market - Revenue and Forecast to 2031(US$ Million) - by Plant Type
- Table 48. Others: Geothermal Power Generation Market - Revenue and Forecast to 2031(US$ Million) - by End User
List Of Figures
- Figure 1. Geothermal Power Generation Market Segmentation, by Geography
- Figure 2. PEST Analysis
- Figure 3. Ecosystem Analysis
- Figure 4. Impact Analysis of Drivers and Restraints
- Figure 5. Geothermal Power Generation Market Revenue (US$ Million), 2021-2031
- Figure 6. Geothermal Power Generation Market Share (%) - by Plant Type (2023 and 2031)
- Figure 7. Direct Dry Steam: Geothermal Power Generation Market - Revenue and Forecast to 2031 (US$ Million)
- Figure 8. Flash Steam: Geothermal Power Generation Market - Revenue and Forecast to 2031 (US$ Million)
- Figure 9. Binary Cycle: Geothermal Power Generation Market - Revenue and Forecast to 2031 (US$ Million)
- Figure 10. Geothermal Power Generation Market Share (%) - by End User (2023 and 2031)
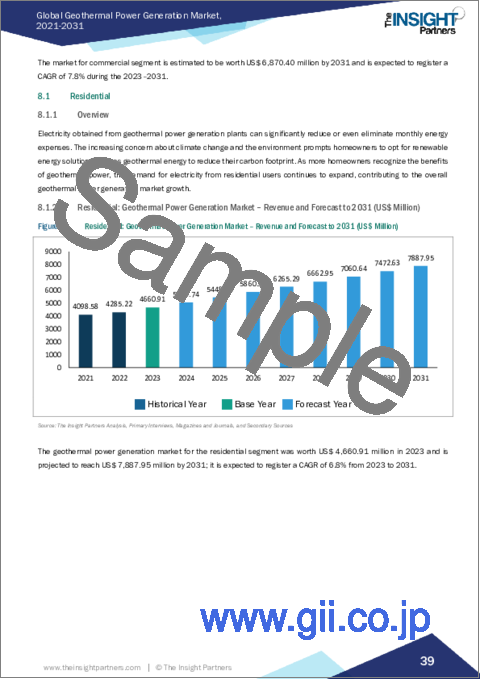
- Figure 11. Residential: Geothermal Power Generation Market - Revenue and Forecast to 2031 (US$ Million)
- Figure 12. Commercial: Geothermal Power Generation Market - Revenue and Forecast to 2031 (US$ Million)
- Figure 13. Industrial: Geothermal Power Generation Market - Revenue and Forecast to 2031 (US$ Million)
- Figure 14. Geothermal Power Generation Market Breakdown by Region, 2023 and 2031 (%)
- Figure 15. North America: Geothermal Power Generation Market - Revenue and Forecast to 2031(US$ Million)
- Figure 16. North America: Geothermal Power Generation Market Breakdown, by Plant Type (2023 and 2031)
- Figure 17. North America: Geothermal Power Generation Market Breakdown, by End User (2023 and 2031)
- Figure 18. North America: Geothermal Power Generation Market Breakdown, by Key Countries, 2023 and 2031 (%)
- Figure 19. United States: Geothermal Power Generation Market - Revenue and Forecast to 2031(US$ Million)
- Figure 20. Mexico: Geothermal Power Generation Market - Revenue and Forecast to 2031(US$ Million)
- Figure 21. Europe: Geothermal Power Generation Market - Revenue and Forecast to 2031(US$ Million)
- Figure 22. Europe: Geothermal Power Generation Market Breakdown, by Plant Type (2023 and 2031)
- Figure 23. Europe: Geothermal Power Generation Market Breakdown, by End User (2023 and 2031)
- Figure 24. Europe: Geothermal Power Generation Market Breakdown, by Key Countries, 2023 and 2031 (%)
- Figure 25. Turkey: Geothermal Power Generation Market - Revenue and Forecast to 2031(US$ Million)
- Figure 26. Iceland: Geothermal Power Generation Market - Revenue and Forecast to 2031(US$ Million)
- Figure 27. Italy: Geothermal Power Generation Market - Revenue and Forecast to 2031(US$ Million)
- Figure 28. Russia: Geothermal Power Generation Market - Revenue and Forecast to 2031(US$ Million)
- Figure 29. Rest of Europe: Geothermal Power Generation Market - Revenue and Forecast to 2031(US$ Million)
- Figure 30. Asia Pacific: Geothermal Power Generation Market - Revenue and Forecast to 2031(US$ Million)
- Figure 31. Asia Pacific: Geothermal Power Generation Market Breakdown, by Plant Type (2023 and 2031)
- Figure 32. Asia Pacific: Geothermal Power Generation Market Breakdown, by End User (2023 and 2031)
- Figure 33. Asia Pacific: Geothermal Power Generation Market Breakdown, by Key Countries, 2023 and 2031 (%)
- Figure 34. Japan: Geothermal Power Generation Market - Revenue and Forecast to 2031(US$ Million)
- Figure 35. Indonesia: Geothermal Power Generation Market - Revenue and Forecast to 2031(US$ Million)
- Figure 36. New Zealand: Geothermal Power Generation Market - Revenue and Forecast to 2031(US$ Million)
- Figure 37. Philippines: Geothermal Power Generation Market - Revenue and Forecast to 2031(US$ Million)
- Figure 38. Rest of Asia Pacific: Geothermal Power Generation Market - Revenue and Forecast to 2031(US$ Million)
- Figure 39. Rest of World: Geothermal Power Generation Market - Revenue and Forecast to 2031(US$ Million)
- Figure 40. Rest of World: Geothermal Power Generation Market Breakdown, by Plant Type (2023 and 2031)
- Figure 41. Rest of World: Geothermal Power Generation Market Breakdown, by End User (2023 and 2031)
- Figure 42. Rest of World: Geothermal Power Generation Market Breakdown, by Key Countries, 2023 and 2031 (%)
- Figure 43. Chile: Geothermal Power Generation Market - Revenue and Forecast to 2031(US$ Million)
- Figure 44. Kenya: Geothermal Power Generation Market - Revenue and Forecast to 2031(US$ Million)
- Figure 45. El Salvador: Geothermal Power Generation Market - Revenue and Forecast to 2031(US$ Million)
- Figure 46. Others: Geothermal Power Generation Market - Revenue and Forecast to 2031(US$ Million)
- Figure 47. Company Positioning & Concentration
- Figure 48. Heat Map Analysis
The geothermal power generation market size is projected to reach US$ 27.14 billion by 2031 from US$ 15.45 billion in 2023; it is estimated to record a CAGR of 7.3% from 2022 to 2030.
Geothermal energy is one of the key renewable energy sources for generating electricity. In order to generate enough energy to generate electricity, geothermal power plants rely on heat that exists several kilometers beneath the Earth's surface. In some areas, heat may exist naturally in the Earth's core in the form of steam or hot water. Many countries have developed methods of using geothermal energy such as flash steam, binary cycle, and direct dry steam. Different types of geothermal power are available in different parts of the world. For example, Iceland has numerous hot springs that are easily accessible, allowing most people to rely on geothermal springs as a safe, reliable, and inexpensive source of energy. In other countries, such as the US, a cost-intensive geothermal drilling process is involved in harnessing energy.
Flash steam power plants are the most common type of geothermal power plants, which registered the largest geothermal power generation market share in 2023. The volcanically active island nation of Iceland covers almost all of its electricity needs through a series of flash steam geothermal power plants. The steam and excess warm water produced by the flash steam process heats icy sidewalks and parking lots in the cold arctic winter. The driving factors behind the global geothermal power generation market growth are a rise in demand for clean power generation, an increase in awareness of geothermal power extraction, and investment in tapping the geothermal energy potential across the globe. However, the high cost of drilling and exploration of geothermal energy and the availability of geothermal resources near tectonically active areas, which are prone to earthquakes, are among the factors restraining the geothermal power generation market growth.
Nevertheless, technological advancements play a crucial role in shaping the future of geothermal power generation market trends. One key area of innovation is the development of Enhanced Geothermal Systems (EGS). EGS technology involves creating engineered reservoirs in hot rock formations deep underground by injecting water into fractures to stimulate heat exchange. This has the potential to significantly expand the geographic reach of geothermal projects, tapping into previously untapped resources. By overcoming some of the limitations associated with traditional hydrothermal systems, EGS opened possibilities for increased capacity and widespread adoption of geothermal power.
In addition to EGS, advancements in binary cycle systems represent another significant technological opportunity. Binary cycle technology allows for the utilization of lower-temperature geothermal resources that were previously considered uneconomical. These systems operate by using a secondary fluid with a lower boiling point than water to drive a turbine, capturing energy from geothermal reservoirs with temperatures as low as 100°C. This innovation broadens the range of viable geothermal sites, making it possible to harness energy from more geographically diverse locations. The continuous improvement and deployment of such technologies contribute to the economic viability of geothermal power, making it a more attractive option in the global energy landscape.
The global geothermal power generation market analysis is segmented based on plant type, end user, and geography. Based on plant type, the geothermal power generation market is segmented into direct dry steam, flash steam, and binary cycle. Based on end users, the market is segmented into residential, commercial, and industrial. In terms of geography, the global geothermal power generation market is segmented into four major regions: North America, Europe, Asia Pacific (APAC), and the Rest of the World.
Northern California Power Agency, Turboden SpA, Toshiba Energy Systems & Solutions Corp, Berkshire Hathaway Inc, NIBE Industrier AB, General Electric Co., Fuji Electric Co Ltd, Kenya Electricity Generating Co Ltd, Carrier Global Corp., and Danfoss AS are among the key players profiled in the geothermal power generation market report.
The overall geothermal power generation market size has been derived using both primary and secondary sources. Exhaustive secondary research has been conducted using internal and external sources to obtain qualitative and quantitative information related to the geothermal power generation market share. The process also helps obtain an overview and geothermal power generation market forecast with respect to all the market segments. Also, multiple primary interviews have been conducted with industry participants to validate the data and gain analytical insights. This process includes industry experts such as VPs, business development managers, market intelligence managers, and national sales managers, along with external consultants such as valuation experts, research analysts, and key opinion leaders, specializing in the geothermal power generation market.
Table Of Contents
1. Introduction
- 1.1 Scope of the Study
- 1.2 Market Definition, Assumptions and Limitations
- 1.3 Market Segmentation
2. Executive Summary
- 2.1 Key Insights
- 2.2 Market Attractiveness Analysis
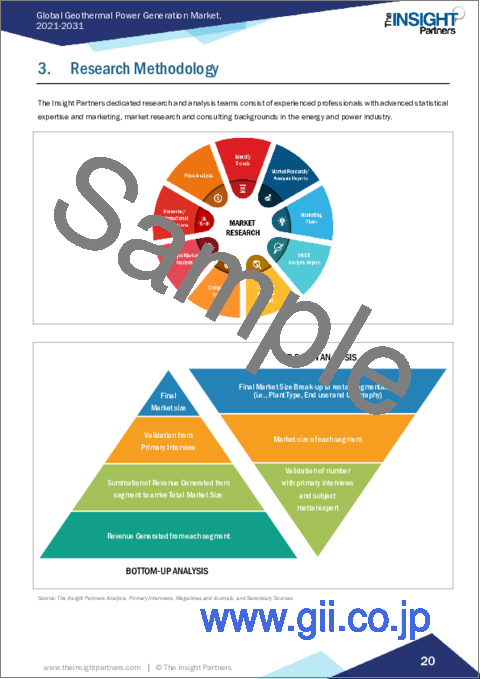
3. Research Methodology
4. Geothermal Power Generation Market Landscape
- 4.1 Overview
- 4.2 PEST Analysis
- 4.3 Ecosystem Analysis
- 4.3.1 List of Vendors in the Value Chain
5. Geothermal Power Generation Market - Key Market Dynamics
- 5.1 Key Market Drivers
- 5.2 Key Market Restraints
- 5.3 Key Market Opportunities
- 5.4 Future Trends
- 5.5 Impact Analysis of Drivers and Restraints
6. Geothermal Power Generation Market - Global Market Analysis
- 6.1 Geothermal Power Generation - Global Market Overview
- 6.2 Geothermal Power Generation - Global Market and Forecast to 2030
7. Geothermal Power Generation Market - Revenue Analysis (USD Million) - By Plant Type, 2020-2030
- 7.1 Overview
- 7.2 Direct Dry Steam
- 7.3 Flash Steam
- 7.4 Binary Cycle
8. Geothermal Power Generation Market - Revenue Analysis (USD Million) - By End-User, 2020-2030
- 8.1 Overview
- 8.2 Residential
- 8.3 Commercial
- 8.4 Industrial
9. Geothermal Power Generation Market - Revenue Analysis (USD Million), 2020-2030 - Geographical Analysis
- 9.1 North America
- 9.1.1 North America Geothermal Power Generation Market Overview
- 9.1.2 North America Geothermal Power Generation Market Revenue and Forecasts to 2030
- 9.1.3 North America Geothermal Power Generation Market Revenue and Forecasts and Analysis - By Plant Type
- 9.1.4 North America Geothermal Power Generation Market Revenue and Forecasts and Analysis - By End-User
- 9.1.5 North America Geothermal Power Generation Market Revenue and Forecasts and Analysis - By Countries
- 9.1.5.1 Mexico Geothermal Power Generation Market
- 9.1.5.1.1 Mexico Geothermal Power Generation Market, by Plant Type
- 9.1.5.1.2 Mexico Geothermal Power Generation Market, by End-User
- 9.1.5.2 US Geothermal Power Generation Market
- 9.1.5.2.1 US Geothermal Power Generation Market, by Plant Type
- 9.1.5.2.2 US Geothermal Power Generation Market, by End-User
- 9.1.5.1 Mexico Geothermal Power Generation Market
Note - Similar analysis would be provided for below mentioned regions/countries
- 9.2 Europe
- 9.2.1 Turkey
- 9.2.2 Italy
- 9.2.3 Russia
- 9.2.4 Iceland
- 9.2.5 Rest of Europe
- 9.3 Asia-Pacific
- 9.3.1 Japan
- 9.3.2 Indonesia
- 9.3.3 Philippines
- 9.3.4 New Zealand
- 9.3.5 Rest of Asia-Pacific
- 9.4 Rest of World
- 9.4.1 Chile
- 9.4.2 Kenya
- 9.4.3 El Salvador
- 9.4.4 Rest of World
10. Industry Landscape
- 10.1 Mergers and Acquisitions
- 10.2 Agreements, Collaborations, Joint Ventures
- 10.3 New Product Launches
- 10.4 Expansions and Other Strategic Developments
11. Competitive Landscape
- 11.1 Heat Map Analysis by Key Players
- 11.2 Company Positioning and Concentration
12. Geothermal Power Generation Market - Key Company Profiles
- 12.1 Enel Green Power
- 12.1.1 Key Facts
- 12.1.2 Business Description
- 12.1.3 Products and Services
- 12.1.4 Financial Overview
- 12.1.5 SWOT Analysis
- 12.1.6 Key Developments
Note - Similar information would be provided for below list of companies
- 12.2 Ormat Technologies Inc
- 12.3 Toshiba Energy Systems and Solutions Corporation
- 12.4 US Geothermal Inc
- 12.5 Calpine Corporation
- 12.6 Federal Electricity Commission
- 12.7 Kenya Electricity Generating Company
- 12.8 Reykjavik Energy
- 12.9 Pertamina Geothermal Energy
- 12.10 CalEnergy Generation
- 12.11 Northern California Power Agency
13. Appendix
- 13.1 Glossary
- 13.2 About The Insight Partners
- 13.3 Market Intelligence Cloud

