|
|
市場調査レポート
商品コード
1764930
アジア太平洋の電子データ交換市場の予測 (2031年まで) - 地域別分析 (コンポーネント別、種類別、産業別)Asia Pacific Electronic Data Interchange Market Forecast to 2031 - Regional Analysis - by Component, Type, and Industry |
||||||

|
|||||||
|
|||||||

| アジア太平洋の電子データ交換市場の予測 (2031年まで) - 地域別分析 (コンポーネント別、種類別、産業別) |
|
出版日: 2025年04月17日
発行: The Insight Partners
ページ情報: 英文 162 Pages
納期: 即納可能
|

全表示
- 概要
- 図表
- 目次
アジア太平洋の電子データ交換市場は、2023年に80億5,207万米ドルと評価され、2031年には197億6,928万米ドルに達すると予測され、2023年から2031年までのCAGRは11.9%と推定されます。
EDIアウトソーシングサービスの採用拡大がアジア太平洋電子データ交換市場を後押し
EDIプログラムのアウトソーシングは、第三者プロバイダーのEDIプラットフォームを管理・実装するマネージドサービスによって行われます。アウトソーシングにより、企業は幅広い能力とハードウェアおよびソフトウェアの設備投資にアクセスする必要があります。いくつかの企業は、内部リソースの需要を達成するのに役立つERPシステムを含む、バックオフィスシステムとEDIを統合することに積極的に注力しています。さらに、EDIへのマネージド・サービス・アプローチの採用は、組織の間で普及しています。EDIアウトソーシングの導入は、IT業界の他の分野のアウトソーシングよりも魅力的です。EDIアウトソーシングの重要な目的は、顧客にサービスを提供するための適切なレベルのスキルへのアクセスを確保することで、インフラへの投資コストを削減することです。EDIアウトソーシングの導入は、最新技術へのアクセス、外部システムとの接続、世界な取引を可能にする付加価値サービスへのアクセスなど、さまざまなメリットをもたらします。EDIは、ユーザーが迅速に新しい市場に参入し、業績、サプライチェーン、ビジネスパートナーに関連する詳細かつ高度な情報を供給することにより、ビジネスの生産性を高めることにより、ビジネスの俊敏性を向上させます。そのため、EDIアウトソーシング・サービスに対する需要の高まりは、電子データ交換(EDI)市場の成長機会を生み出すと期待されています。
アジア太平洋電子データ交換市場の概要
アジア太平洋(APAC)の電子データ交換(EDI)市場は、地域各国の過去、現在、将来の動向に基づいて分析されています。小売、IT・通信、物流、BFSIなど、さまざまな業界でEDIのニーズが比較的高いため、同地域のEDI市場プレーヤーは、自社のソリューションやサービスに対する大きな需要を経験しています。この地域のほとんどの国が経済的に発展しているため、先進技術への投資が増加しており、EDI市場のプレーヤーにいくつかの成長機会をもたらしています。中国と日本はAPAC EDI市場の主要国です。中国と日本では、さまざまな産業でハイエンドの自動化ソリューションの採用が増加しており、EDIソリューションとサービスの需要が急増しています。BFSI、小売、物流、ITなど、APACのいくつかの産業は活況を呈しており、予測期間中も大幅な上昇を続けると予想されるため、EDIソリューションとサービスの調達が増加し、EDI市場の活性化につながっています。EDIソリューションは、組織が取引先と正確かつ安全にデータを交換するのに役立ちます。また、運用コストの削減や品質の向上も可能にします。APAC市場における電子請求書発行の範囲は徐々に拡大しています。政府の取り組み、標準、税制上の障害、規制の枠組み、ユーザーによるシステムの適切な理解の欠如などが、EDIソリューションの採用を妨げています。しかし、APAC全体で交換される電子請求書の量は、B2C組織から増加しています。そのため、「ペーパーレス貿易」への投資が促進され、APACのEDI市場の成長をさらに後押ししています。
アジア太平洋の電子データ交換市場の収益と2031年までの予測(金額)
アジア太平洋の電子データ交換市場のセグメンテーション
アジア太平洋の電子データ交換市場は、コンポーネント、種類、産業、国に分類されます。
コンポーネントに基づいて、アジア太平洋の電子データ交換市場はソリューションとサービスに二分されます。2023年には、ソリューションセグメントがより大きな市場シェアを占めています。
種類別では、アジア太平洋電子データ交換市場は、ダイレクトEDI、AS2経由EDI、VAN経由EDI、モバイルEDI、Web EDI、EDIアウトソーシング、その他に分類されます。2023年には、AS2経由のEDIセグメントが最大の市場シェアを占めています。
産業別では、アジア太平洋の電子データ交換市場は、BFSI、小売業・消費財、医療、IT・通信、運輸・物流、その他に区分されます。2023年には小売業・消費財セグメントが最大の市場シェアを占めています。
国別では、アジア太平洋の電子データ交換市場は、オーストラリア、中国、日本、インド、韓国、その他アジア太平洋に区分されます。2023年のアジア太平洋電子データ交換市場シェアは中国が独占。
MuleSoft, LLC、Optum Inc、Pacific Commerce Pty Ltd、SPS Commerce Inc、TrueCommerce Inc、Cerner Corp、International Business Machines Corp、Boomi, Inc、GoAnywhere MFT、Cleo、The Descartes Systems Group Inc、Crossinx GmbH、EDICOM、Comarch SA、InterTrade Systems, Inc.は、アジア太平洋電子データ交換市場で事業を展開している主要企業です。
目次
第1章 イントロダクション
第2章 エグゼクティブサマリー
- 主要洞察
- 市場の魅力
第3章 分析手法
- 二次調査
- 一次調査
- 仮説の策定
- マクロ経済要因分析
- 基礎数値の開発
- データの三角測量
- 国レベルのデータ
第4章 アジア太平洋の電子データ交換市場の情勢
- PEST分析
- エコシステム分析
- バリューチェーンのベンダー一覧
第5章 アジア太平洋の電子データ交換市場:主な市場力学
- 市場促進要因
- EDIトランザクション・基準の採用の増加
- 各業界におけるDX (デジタルトランスフォーメーション) の進展
- 中小企業におけるEDI導入の増加
- 市場抑制要因
- セキュリティ脅威と攻撃の出現
- 初期コストの高さ
- 市場機会
- EDIアウトソーシングサービスの採用拡大
- クラウドベースEDIの導入
- 今後の動向
- ブロックチェーン技術を用いたEDIソリューションの採用増加
- 促進要因と抑制要因の影響
第6章 電子データ交換市場:世界市場の分析
- 電子データ交換市場の収益 (2021~2031年)
- 電子データ交換市場の予測・分析
第7章 アジア太平洋の電子データ交換市場の分析:コンポーネント別
- ソリューション
- サービス
第8章 アジア太平洋の電子データ交換市場の分析:種類別
- ダイレクトEDI
- AS2経由EDI
- VAN経由EDI
- モバイルEDI
- Web EDI
- EDIアウトソーシング
- その他
第9章 アジア太平洋の電子データ交換市場の分析:産業別
- BFSI
- 小売業・消費財
- 医療
- IT・通信
- 運輸・物流
- その他
第10章 アジア太平洋の電子データ交換市場:国別分析
- アジア太平洋
- オーストラリア
- 中国
- インド
- 日本
- 韓国
- その他アジア太平洋諸国
第11章 競合情勢
- ヒートマップ分析:主要企業別
- 企業のポジショニングと集中度
第12章 業界情勢
- 市場イニシアティブ
- 新製品開発
第13章 企業プロファイル
- Mulesoft, LLC
- Optum Inc
- Pacific Commerce Pty Ltd
- SPS Commerce Inc
- TrueCommerce Inc.
- Cerner Corp
- International Business Machines Corp
- Boomi, Inc.
- GoAnywhere MFT
- Cleo
- The Descartes Systems Group Inc.0
- Crossinx GmbH3
- EDICOM5
- Comarch SA7
- InterTrade Systems, Inc1
第14章 付録
- The Insight Partnersについて
- 単語索引
List Of Tables
- Table 1. Asia Pacific Electronic Data Interchange Market Segmentation
- Table 2. Electronic Data Interchange Market - Revenue and Forecast to 2031 (US$ Million)
- Table 3. Electronic Data Interchange Market - Revenue and Forecast to 2031 (US$ Million) - by Component
- Table 4. Electronic Data Interchange Market - Revenue and Forecast to 2031 (US$ Million) - by Type
- Table 5. Electronic Data Interchange Market - Revenue and Forecast to 2031 (US$ Million) - by Industry
- Table 6. Asia Pacific: Electronic Data Interchange Market - Revenue and Forecast to 2031 (US$ Million) - by Country
- Table 7. Australia: Electronic Data Interchange Market - Revenue and Forecast to 2031 (US$ Million) - by Component
- Table 8. Australia: Electronic Data Interchange Market - Revenue and Forecast to 2031 (US$ Million) - by Type
- Table 9. Australia: Electronic Data Interchange Market - Revenue and Forecast to 2031 (US$ Million) - by Industry
- Table 10. China: Electronic Data Interchange Market - Revenue and Forecast to 2031 (US$ Million) - by Component
- Table 11. China: Electronic Data Interchange Market - Revenue and Forecast to 2031 (US$ Million) - by Type
- Table 12. China: Electronic Data Interchange Market - Revenue and Forecast to 2031 (US$ Million) - by Industry
- Table 13. India: Electronic Data Interchange Market - Revenue and Forecast to 2031 (US$ Million) - by Component
- Table 14. India: Electronic Data Interchange Market - Revenue and Forecast to 2031 (US$ Million) - by Type
- Table 15. India: Electronic Data Interchange Market - Revenue and Forecast to 2031 (US$ Million) - by Industry
- Table 16. Japan: Electronic Data Interchange Market - Revenue and Forecast to 2031 (US$ Million) - by Component
- Table 17. Japan: Electronic Data Interchange Market - Revenue and Forecast to 2031 (US$ Million) - by Type
- Table 18. Japan: Electronic Data Interchange Market - Revenue and Forecast to 2031 (US$ Million) - by Industry
- Table 19. South Korea: Electronic Data Interchange Market - Revenue and Forecast to 2031 (US$ Million) - by Component
- Table 20. South Korea: Electronic Data Interchange Market - Revenue and Forecast to 2031 (US$ Million) - by Type
- Table 21. South Korea: Electronic Data Interchange Market - Revenue and Forecast to 2031 (US$ Million) - by Industry
- Table 22. Rest of APAC: Electronic Data Interchange Market - Revenue and Forecast to 2031 (US$ Million) - by Component
- Table 23. Rest of APAC: Electronic Data Interchange Market - Revenue and Forecast to 2031 (US$ Million) - by Type
- Table 24. Rest of APAC: Electronic Data Interchange Market - Revenue and Forecast to 2031 (US$ Million) - by Industry
- Table 25. Heat Map Analysis by Key Players
- Table 26. List of Abbreviation
List Of Figures
- Figure 1. Asia Pacific Electronic Data Interchange Market Segmentation, by Country
- Figure 2. PEST Analysis
- Figure 3. Ecosystem: Electronic Data Interchange (EDI) Market
- Figure 4. Electronic Data Interchange Market - Key Market Dynamics
- Figure 5. Impact Analysis of Drivers and Restraints
- Figure 6. Electronic Data Interchange Market Revenue (US$ Million), 2021-2031
- Figure 7. Electronic Data Interchange Market Share (%) - by Component (2023 and 2031)
- Figure 8. Solution: Electronic Data Interchange Market - Revenue and Forecast to 2031 (US$ Million)
- Figure 9. Services: Electronic Data Interchange Market - Revenue and Forecast to 2031 (US$ Million)
- Figure 10. Electronic Data Interchange Market Share (%) - by Type (2023 and 2031)
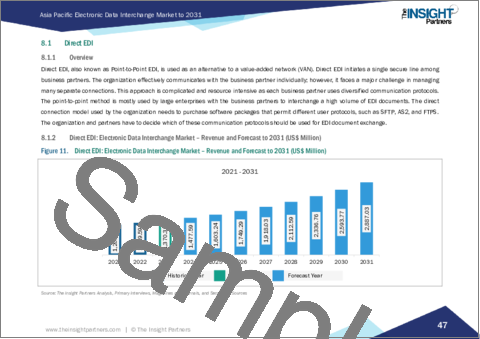
- Figure 11. Direct EDI: Electronic Data Interchange Market - Revenue and Forecast to 2031 (US$ Million)
- Figure 12. EDI via AS2: Electronic Data Interchange Market - Revenue and Forecast to 2031 (US$ Million)
- Figure 13. EDI via VAN: Electronic Data Interchange Market - Revenue and Forecast to 2031 (US$ Million)
- Figure 14. Mobile EDI: Electronic Data Interchange Market - Revenue and Forecast to 2031 (US$ Million)
- Figure 15. Web EDI: Electronic Data Interchange Market - Revenue and Forecast to 2031 (US$ Million)
- Figure 16. EDI Outsourcing: Electronic Data Interchange Market - Revenue and Forecast to 2031 (US$ Million)
- Figure 17. Others: Electronic Data Interchange Market - Revenue and Forecast to 2031 (US$ Million)
- Figure 18. Electronic Data Interchange Market Share (%) - by Industry (2023 and 2031)
- Figure 19. BFSI: Electronic Data Interchange Market - Revenue and Forecast to 2031 (US$ Million)
- Figure 20. Retail & Consumer Goods: Electronic Data Interchange Market - Revenue and Forecast to 2031 (US$ Million)
- Figure 21. Healthcare: Electronic Data Interchange Market - Revenue and Forecast to 2031 (US$ Million)
- Figure 22. IT & Telecommunication: Electronic Data Interchange Market - Revenue and Forecast to 2031 (US$ Million)
- Figure 23. Transportation & Logistics: Electronic Data Interchange Market - Revenue and Forecast to 2031 (US$ Million)
- Figure 24. Others: Electronic Data Interchange Market - Revenue and Forecast to 2031 (US$ Million)
- Figure 25. Asia Pacific Electronic Data Interchange Market, by Key Country - Revenue (2023) (US$ Million)
- Figure 26. Asia Pacific: Electronic Data Interchange Market Breakdown, by Key Countries, 2023 and 2031 (%)
- Figure 27. Australia: Electronic Data Interchange Market - Revenue and Forecast to 2031 (US$ Million)
- Figure 28. China: Electronic Data Interchange Market - Revenue and Forecast to 2031 (US$ Million)
- Figure 29. India: Electronic Data Interchange Market - Revenue and Forecast to 2031 (US$ Million)
- Figure 30. Japan: Electronic Data Interchange Market - Revenue and Forecast to 2031 (US$ Million)
- Figure 31. South Korea: Electronic Data Interchange Market - Revenue and Forecast to 2031 (US$ Million)
- Figure 32. Rest of APAC: Electronic Data Interchange Market - Revenue and Forecast to 2031 (US$ Million)
- Figure 33. Company Positioning & Concentration
The Asia Pacific electronic data interchange market was valued at US$ 8,052.07 million in 2023 and is expected to reach US$ 19,769.28 million by 2031; it is estimated to register a CAGR of 11.9% from 2023 to 2031.
Growing Adoption of EDI Outsourcing Services Boosts Asia Pacific Electronic Data Interchange Market
The outsourcing of the EDI program is done via managed services by managing and implementing an EDI platform for a third-party provider. Outsourcing necessitates the organizations to access a wide range of abilities and capital investment of the hardware and software. Several companies are actively focusing on integrating EDI with their back-office systems, including an ERP system that helps achieve the demand for internal resources. Furthermore, the adoption of the managed services approach to EDI has become popular among organizations. The implementation of EDI outsourcing is more engaging than outsourcing across other areas of the IT industry. The significant aim of EDI outsourcing is to reduce the cost of investing in infrastructure by ensuring access to the right level of skills for delivering services to the customer. The implementation of EDI outsourcing offers various benefits such as providing access to the latest technology, getting connected with the external systems, and providing access to the value-added services to permit the user to trade globally. EDI enhances business agility by allowing users to quickly enter new markets and boost business productivity by supplying further and advanced information related to performance, the supply chain, and the business partners. Therefore, the growing demand for EDI outsourcing services is expected to create an opportunity for the growth of the electronic data interchange (EDI) market.
Asia Pacific Electronic Data Interchange Market Overview
The electronic data interchange (EDI) market in Asia Pacific (APAC) has been analyzed based on historical, current, and future trends in countries across the region. The EDI market players in the region are experiencing significant demand for their solutions and services as the need for EDI is comparatively high across various industries which include retail, IT & telecom, logistics, BFSI, and others. Most of the countries in the region are economically developing, and thus, investment in advanced technologies has increased, facilitating several growth opportunities for the EDI market players. China and Japan are the leading countries in the APAC EDI market due to the steep industrialization rise. The rising adoption of high-end automation solutions among various industries in China and Japan has surged the demand for EDI solutions and services. Several industries, such as BFSI, retail, logistics, and IT, are booming in APAC and are also anticipated to continue to climb substantially during the forecast period, resulting in a rise in the procurement of EDI solutions and services, thereby catalyzing the EDI market. The EDI solution helps the organization to exchange data accurately and securely with their trading partners. They also enable the organization to reduce operational costs and enhance quality. The electronic invoicing scope in the APAC market is increasing gradually. The lack of government initiatives, standards, tax impediments, regulatory framework, and proper understanding of the system within the users are among a few aspects hindering the adoption of EDI solutions. However, the volume of e-invoices exchanged across APAC is increasing from B2C organizations. Thus, it encourages organizations to invest more in "paperless trade," which further boosts the EDI market growth in APAC.
Asia Pacific Electronic Data Interchange Market Revenue and Forecast to 2031 (US$ Million)
Asia Pacific Electronic Data Interchange Market Segmentation
The Asia Pacific electronic data interchange market is categorized into component, type, industry, and country.
Based on component, the Asia Pacific electronic data interchange market is bifurcated into solutions and services. The solutions segment held a larger market share in 2023.
In terms of type, the Asia Pacific electronic data interchange market is categorized into direct EDI, EDI via AS2, EDI via VAN, mobile EDI, web EDI, EDI outsourcing, and others. The EDI via AS2 segment held the largest market share in 2023.
By industry, the Asia Pacific electronic data interchange market is segmented into BFSI, retail & consumer goods, healthcare, IT & telecommunication, transportation & logistics, and others. The retail & consumer goods segment held the largest market share in 2023.
By country, the Asia Pacific electronic data interchange market is segmented into Australia, China, Japan, India, South Korea, and the Rest of Asia Pacific. China dominated the Asia Pacific electronic data interchange market share in 2023.
MuleSoft, LLC; Optum Inc; Pacific Commerce Pty Ltd; SPS Commerce Inc; TrueCommerce Inc; Cerner Corp; International Business Machines Corp; Boomi, Inc; GoAnywhere MFT; Cleo; The Descartes Systems Group Inc; Crossinx GmbH; EDICOM; Comarch SA; and InterTrade Systems, Inc. are some of the leading companies operating in the Asia Pacific electronic data interchange market.
Table Of Contents
1. Introduction
- 1.1 The Insight Partners Research Report Guidance
- 1.2 Market Segmentation
2. Executive Summary
- 2.1 Key Insights
- 2.2 Market Attractiveness
3. Research Methodology
- 3.1 Secondary Research
- 3.2 Primary Research
- 3.2.1 Hypothesis formulation:
- 3.2.2 Macro-economic factor analysis:
- 3.2.3 Developing base number:
- 3.2.4 Data Triangulation:
- 3.2.5 Country level data:
4. Asia Pacific Electronic Data Interchange Market Landscape
- 4.1 Overview
- 4.2 PEST Analysis
- 4.3 Ecosystem Analysis
- 4.3.1 List of Vendors in Value Chain:
5. Asia Pacific Electronic Data Interchange Market - Key Market Dynamics
- 5.1 Drivers
- 5.1.1 Increasing Adoption of EDI Transactions and Standards
- 5.1.2 Rising Digital Transformation Across Industries
- 5.1.3 Growing Adoption of EDI in SMEs
- 5.2 Market Restraints
- 5.2.1 Emergence of Security Threats and Attacks
- 5.2.2 High Initial Cost
- 5.3 Market Opportunities
- 5.3.1 Growing Adoption of EDI Outsourcing Services
- 5.3.2 Deployment of Cloud-based EDI
- 5.4 Future Trends
- 5.4.1 Rising Adoption of EDI Solution with Blockchain Technology
- 5.5 Impact of Drivers and Restraints:
6. Electronic Data Interchange Market - Global Analysis
- 6.1 Electronic Data Interchange Market Revenue (US$ Million), 2021-2031
- 6.2 Electronic Data Interchange Market Forecast Analysis
7. Asia Pacific Electronic Data Interchange Market Analysis - by Component
- 7.1 Solution
- 7.1.1 Overview
- 7.1.2 Solution: Electronic Data Interchange Market - Revenue and Forecast to 2031 (US$ Million)
- 7.2 Services
- 7.2.1 Overview
- 7.2.2 Services: Electronic Data Interchange Market - Revenue and Forecast to 2031 (US$ Million)
8. Asia Pacific Electronic Data Interchange Market Analysis - by Type
- 8.1 Direct EDI
- 8.1.1 Overview
- 8.1.2 Direct EDI: Electronic Data Interchange Market - Revenue and Forecast to 2031 (US$ Million)
- 8.2 EDI via AS2
- 8.2.1 Overview
- 8.2.2 EDI via AS2: Electronic Data Interchange Market - Revenue and Forecast to 2031 (US$ Million)
- 8.3 EDI via VAN
- 8.3.1 Overview
- 8.3.2 EDI via VAN: Electronic Data Interchange Market - Revenue and Forecast to 2031 (US$ Million)
- 8.4 Mobile EDI
- 8.4.1 Overview
- 8.4.2 Mobile EDI: Electronic Data Interchange Market - Revenue and Forecast to 2031 (US$ Million)
- 8.5 Web EDI
- 8.5.1 Overview
- 8.5.2 Web EDI: Electronic Data Interchange Market - Revenue and Forecast to 2031 (US$ Million)
- 8.6 EDI Outsourcing
- 8.6.1 Overview
- 8.6.2 EDI Outsourcing: Electronic Data Interchange Market - Revenue and Forecast to 2031 (US$ Million)
- 8.7 Others
- 8.7.1 Overview
- 8.7.2 Others: Electronic Data Interchange Market - Revenue and Forecast to 2031 (US$ Million)
9. Asia Pacific Electronic Data Interchange Market Analysis - by Industry
- 9.1 BFSI
- 9.1.1 Overview
- 9.1.2 BFSI: Electronic Data Interchange Market - Revenue and Forecast to 2031 (US$ Million)
- 9.2 Retail & Consumer Goods
- 9.2.1 Overview
- 9.2.2 Retail & Consumer Goods: Electronic Data Interchange Market - Revenue and Forecast to 2031 (US$ Million)
- 9.3 Healthcare
- 9.3.1 Overview
- 9.3.2 Healthcare: Electronic Data Interchange Market - Revenue and Forecast to 2031 (US$ Million)
- 9.4 IT & Telecommunication
- 9.4.1 Overview
- 9.4.2 IT & Telecommunication: Electronic Data Interchange Market - Revenue and Forecast to 2031 (US$ Million)
- 9.5 Transportation & Logistics
- 9.5.1 Overview
- 9.5.2 Transportation & Logistics: Electronic Data Interchange Market - Revenue and Forecast to 2031 (US$ Million)
- 9.6 Others
- 9.6.1 Overview
- 9.6.2 Others: Electronic Data Interchange Market - Revenue and Forecast to 2031 (US$ Million)
10. Asia Pacific Electronic Data Interchange Market - Country Analysis
- 10.1 Asia Pacific Electronic Data Interchange Market Overview
- 10.1.1 Asia Pacific: Electronic Data Interchange Market Breakdown, by Key Countries, 2023 and 2031 (%)
- 10.1.1.1 Asia Pacific: Electronic Data Interchange Market - Revenue and Forecast Analysis - by Country
- 10.1.1.2 Australia: Electronic Data Interchange Market - Revenue and Forecast to 2031 (US$ Million)
- 10.1.1.2.1 Australia: Electronic Data Interchange Market Breakdown, by Component
- 10.1.1.2.2 Australia: Electronic Data Interchange Market Breakdown, by Type
- 10.1.1.2.3 Australia: Electronic Data Interchange Market Breakdown, by Industry
- 10.1.1.3 China: Electronic Data Interchange Market - Revenue and Forecast to 2031 (US$ Million)
- 10.1.1.3.1 China: Electronic Data Interchange Market Breakdown, by Component
- 10.1.1.3.2 China: Electronic Data Interchange Market Breakdown, by Type
- 10.1.1.3.3 China: Electronic Data Interchange Market Breakdown, by Industry
- 10.1.1.4 India: Electronic Data Interchange Market - Revenue and Forecast to 2031 (US$ Million)
- 10.1.1.4.1 India: Electronic Data Interchange Market Breakdown, by Component
- 10.1.1.4.2 India: Electronic Data Interchange Market Breakdown, by Type
- 10.1.1.4.3 India: Electronic Data Interchange Market Breakdown, by Industry
- 10.1.1.5 Japan: Electronic Data Interchange Market - Revenue and Forecast to 2031 (US$ Million)
- 10.1.1.5.1 Japan: Electronic Data Interchange Market Breakdown, by Component
- 10.1.1.5.2 Japan: Electronic Data Interchange Market Breakdown, by Type
- 10.1.1.5.3 Japan: Electronic Data Interchange Market Breakdown, by Industry
- 10.1.1.6 South Korea: Electronic Data Interchange Market - Revenue and Forecast to 2031 (US$ Million)
- 10.1.1.6.1 South Korea: Electronic Data Interchange Market Breakdown, by Component
- 10.1.1.6.2 South Korea: Electronic Data Interchange Market Breakdown, by Type
- 10.1.1.6.3 South Korea: Electronic Data Interchange Market Breakdown, by Industry
- 10.1.1.7 Rest of APAC: Electronic Data Interchange Market - Revenue and Forecast to 2031 (US$ Million)
- 10.1.1.7.1 Rest of APAC: Electronic Data Interchange Market Breakdown, by Component
- 10.1.1.7.2 Rest of APAC: Electronic Data Interchange Market Breakdown, by Type
- 10.1.1.7.3 Rest of APAC: Electronic Data Interchange Market Breakdown, by Industry
- 10.1.1 Asia Pacific: Electronic Data Interchange Market Breakdown, by Key Countries, 2023 and 2031 (%)
11. Competitive Landscape
- 11.1 Heat Map Analysis by Key Players
- 11.2 Company Positioning & Concentration
12. Industry Landscape
- 12.1 Overview
- 12.2 Market Initiative
- 12.3 New Product Development
13. Company Profiles
- 13.1 Mulesoft, LLC
- 13.1.1 Key Facts
- 13.1.2 Business Description
- 13.1.3 Products and Services
- 13.1.4 Financial Overview
- 13.1.5 SWOT Analysis
- 13.1.6 Key Developments
- 13.2 Optum Inc
- 13.2.1 Key Facts
- 13.2.2 Business Description
- 13.2.3 Products and Services
- 13.2.4 Financial Overview
- 13.2.5 SWOT Analysis
- 13.2.6 Key Developments
- 13.3 Pacific Commerce Pty Ltd
- 13.3.1 Key Facts
- 13.3.2 Business Description
- 13.3.3 Products and Services
- 13.3.4 Financial Overview
- 13.3.5 SWOT Analysis
- 13.3.6 Key Developments
- 13.4 SPS Commerce Inc
- 13.4.1 Key Facts
- 13.4.2 Business Description
- 13.4.3 Products and Services
- 13.4.4 Financial Overview
- 13.4.5 SWOT Analysis
- 13.4.6 Key Developments
- 13.5 TrueCommerce Inc.
- 13.5.1 Key Facts
- 13.5.2 Business Description
- 13.5.3 Products and Services
- 13.5.4 Financial Overview
- 13.5.5 SWOT Analysis
- 13.5.6 Key Developments
- 13.6 Cerner Corp
- 13.6.1 Key Facts
- 13.6.2 Business Description
- 13.6.3 Products and Services
- 13.6.4 Financial Overview
- 13.6.5 SWOT Analysis
- 13.6.6 Key Developments
- 13.7 International Business Machines Corp
- 13.7.1 Key Facts
- 13.7.2 Business Description
- 13.7.3 Products and Services
- 13.7.4 Financial Overview
- 13.7.5 SWOT Analysis
- 13.7.6 Key Developments
- 13.8 Boomi, Inc.
- 13.8.1 Key Facts
- 13.8.2 Business Description
- 13.8.3 Products and Services
- 13.8.4 Financial Overview
- 13.8.5 SWOT Analysis
- 13.8.6 Key Developments
- 13.9 GoAnywhere MFT
- 13.9.1 Key Facts
- 13.9.2 Business Description
- 13.9.3 Products and Services
- 13.9.4 Financial Overview
- 13.9.5 SWOT Analysis
- 13.9.6 Key Developments
- 13.10 Cleo
- 13.10.1 Key Facts
- 13.10.2 Business Description
- 13.10.3 Products and Services
- 13.10.4 Financial Overview
- 13.10.5 SWOT Analysis
- 13.10.6 Key Developments
- 13.11 The Descartes Systems Group Inc.0
- 13.11.1 Key Facts0
- 13.11.2 Business Description0
- 13.11.3 Products and Services0
- 13.11.4 Financial Overview1
- 13.11.5 SWOT Analysis2
- 13.11.6 Key Developments2
- 13.12 Crossinx GmbH3
- 13.12.1 Key Facts3
- 13.12.2 Business Description3
- 13.12.3 Products and Services3
- 13.12.4 Financial Overview3
- 13.12.5 SWOT Analysis3
- 13.12.6 Key Developments4
- 13.13 EDICOM5
- 13.13.1 Key Facts5
- 13.13.2 Business Description5
- 13.13.3 Products and Services5
- 13.13.4 Financial Overview5
- 13.13.5 SWOT Analysis6
- 13.13.6 Key Developments6
- 13.14 Comarch SA7
- 13.14.1 Key Facts7
- 13.14.2 Business Description7
- 13.14.3 Products and Services7
- 13.14.4 Financial Overview8
- 13.14.5 SWOT Analysis9
- 13.14.6 Key Developments0
- 13.15 InterTrade Systems, Inc1
- 13.15.1 Key Facts1
- 13.15.2 Business Description1
- 13.15.3 Products and Services1
- 13.15.4 Financial Overview1
- 13.15.5 SWOT Analysis2
- 13.15.6 Key Developments3
14. Appendix4
- 14.1 About The Insight Partners4
- 14.2 Word Index5

