|
|
市場調査レポート
商品コード
1360112
アジア太平洋の垂直共振器面発光レーザーの2030年市場予測-地域別分析-タイプ、材料、データレート、波長(赤色線、近赤外線、短波長赤外線)、用途、最終用途産業別Asia Pacific Vertical Cavity Surface Emitting Laser Market Forecast to 2030 -Regional Analysis - by Type, Material, Data Rate, Wavelength,Red, Near Infrared, and Short Wave Infrared, Application, and End-use Industry |
||||||
|
|
|||||||


| アジア太平洋の垂直共振器面発光レーザーの2030年市場予測-地域別分析-タイプ、材料、データレート、波長(赤色線、近赤外線、短波長赤外線)、用途、最終用途産業別 |
|
出版日: 2023年08月17日
発行: The Insight Partners
ページ情報: 英文 184 Pages
納期: 即納可能
|
- 全表示
- 概要
- 図表
- 目次
アジア太平洋の垂直共振器面発光レーザ市場は、2023年の4億7,098万米ドルから2030年には16億3,120万米ドルに成長すると予測されています。2023年から2030年までのCAGRは19.4%と推定されています。
データセンターの増加がアジア太平洋の垂直共振器面発光レーザー市場を後押し
デジタル化、モノのインターネット(IoT)、AI、ビッグデータの利用の高まりにより、リアルタイムで処理、保存、分析する必要のある膨大な量のデータが生成されます。IoTとクラウド技術の採用により、相互接続されたデバイスやシステムの数が増加し、その結果、高速、低遅延、より優れたネットワーク接続に対するニーズが高まっています。そのため、データ生成量の増加に伴い、大容量のデータを処理するためのデータセンターの建設が増加しました。2021年12月、データセンターサービスプロバイダーのNEXTDC LTDは、オーストラリア全土に低遅延とデータセンターサービスを提供するため、クイーンズランド州に初のエッジデータセンターを開設しました。2022年10月には、15億米ドルを投資してメルボルンに10万平方メートルのデータセンターを開設しました。2022年12月、技術サービス会社であるNTTは、インドのナビ・ムンバイに、5,000ラックを収容し、30MWのIT負荷をサポートするハイパースケールデータセンターを新たに開設しました。データセンターの増加により、データセンターを維持・管理するための高速データ伝送の必要性が高まっています。垂直共振器面発光レーザーの高速発光能力は、高速データ伝送アプリケーションにとって理想的な選択肢のひとつとなっています。このように、データセンタの光インターコネクトインフラ向けの垂直共振器面発光レーザー需要の高まりは、今後数年間、アジア太平洋VSCEL市場に有利な機会を提供すると見られています。
アジア太平洋の垂直共振器面発光レーザ市場概要
国別に見ると、アジア太平洋の垂直共振器面発光レーザー市場はオーストラリア、中国、インド、日本、韓国、その他のアジア太平洋に区分されます。アジア太平洋の自動車産業は、ここ数年大きな成長を遂げています。
国際自動車工業会によると、2022年には、インド、中国、インドネシア、韓国、タイで自動車生産が大幅に増加しました。さらに、地域および世界の自動車メーカーは、地域全体で新しい自動車生産工場の設立に投資しています。例えば、2022年3月、Triton Electric Vehicle LLCはインドのグジャラート州に新しい生産工場を立ち上げると発表しました。さらに2022年6月には、BMWが22億米ドルを投資して中国に新しい電気自動車生産工場を開設すると発表しました。このように、自動車産業における投資の拡大は、新しく建設される自動車に対するセンシング技術の需要を増大させる。自動車産業では、車室内外のさまざまなセンサー用途にVSCEL技術が使用されており、同地域の垂直共振器面発光レーザー需要に貢献しています。
アジア太平洋の垂直共振器面発光レーザー市場の収益と2030年までの予測(金額)
アジア太平洋の垂直共振器面発光レーザー市場セグメンテーション
アジア太平洋の垂直共振器面発光レーザー市場は、タイプ、材料、データレート、波長、用途、最終用途産業、国に区分されます。
タイプ別では、アジア太平洋の垂直共振器面発光レーザ市場はシングルモードとマルチモードに区分されます。2023年のアジア太平洋の垂直共振器面発光レーザ市場では、シングルモードセグメントが大きなシェアを占めています。
材料ベースでは、アジア太平洋の垂直共振器面発光レーザ市場は、ガリウムヒ素(GAAS)、リン化インジウム(INP)、その他にセグメント化されます。ガリウムヒ素(GAAS)セグメントは、2023年にアジア太平洋の垂直共振器面発光レーザ市場で最大シェアを占めました。
データレートに基づいて、アジア太平洋の垂直共振器面発光レーザ市場は、10GBPS以下、10.1~25GBPS、25GBPS以上に区分されます。25GBPS以上セグメントは、2023年にアジア太平洋の垂直共振器面発光レーザ市場で最大シェアを占めました。
波長ベースでは、アジア太平洋の垂直共振器面発光レーザ市場は、赤、近赤外(NIR)、短波長赤外(SWIR)に区分されます。2023年のアジア太平洋の垂直共振器面発光レーザ市場は、赤セグメントが最大シェア。
用途別では、アジア太平洋の垂直共振器面発光レーザ市場は、センシング、データ通信、産業用加熱&印刷、その他に区分されます。センシングセグメントは、2023年にアジア太平洋の垂直共振器面発光レーザ市場で最大シェアを占めました。
最終用途産業別では、アジア太平洋の垂直共振器面発光レーザ市場は、モバイル&コンシューマ、通信&インフラ、産業、防衛&航空宇宙、医療、自動車&モビリティに区分されます。2023年のアジア太平洋の垂直共振器面発光レーザ市場では、モバイル&コンシューマセグメントが最大シェア。
国別では、アジア太平洋の垂直共振器面発光レーザ市場は、中国、インド、日本、オーストラリア、韓国、その他のアジア太平洋に区分されます。2023年のアジア太平洋の垂直共振器面発光レーザ市場は中国が圧倒的シェア。
ams-OSRAM AG;Broadcom Inc;Coherent Corp;Hamamatsu Photonics KK;IQE Plc;Leonardo SpA;Lumentum Holdings Inc;TRUMPF SE+Co KG;VERTILAS GmbH;and Vertilite Co Ltdは、アジア太平洋の垂直共振器面発光レーザ市場で事業を展開している大手企業です。
目次
第1章 イントロダクション
第2章 キーポイント
第3章 調査手法
- カバー範囲
- 2次調査
- 1次調査
第4章 アジア太平洋の垂直共振器面発光レーザー市場情勢
- 市場概要
- アジア太平洋PEST分析
- エコシステム分析
- 専門家の見解
第5章 アジア太平洋の垂直共振器面発光レーザー市場:主要市場力学
- 市場促進要因
- 3Dセンシングアプリケーションへの垂直共振器面発光レーザー採用の増加
- 通信業界の台頭
- 市場抑制要因
- 垂直共振器面発光レーザー使用に関する政府の厳しい基準
- 市場機会
- データセンターの増加
- 今後の動向
- エレクトロニクスの小型化
- 促進要因と抑制要因の影響分析
第6章 アジア太平洋の垂直共振器面発光レーザー市場分析
- アジア太平洋の垂直共振器面発光レーザー市場概要
第7章 アジア太平洋の垂直共振器面発光レーザー市場分析:タイプ別
- 概要
- アジア太平洋の垂直共振器面発光レーザー市場:タイプ別(2022年、2030年)
- シングルモード
- マルチモード
第8章 アジア太平洋の垂直共振器面発光レーザー市場分析:材料別
- 概要
- アジア太平洋の垂直共振器面発光レーザー市場:材料別(2022年、2030年)
- ガリウムヒ素(GAAS)
- リン化インジウム(INP)
- その他
第9章 アジア太平洋の垂直共振器面発光レーザー市場分析:データレート別
- 概要
- アジア太平洋の垂直共振器面発光レーザー市場:データレート別(2022年、2030年)
- 10GBPS以下
- 25GBPS以上
第10章 アジア太平洋の垂直共振器面発光レーザー市場分析:波長別
- 概要
- アジア太平洋の垂直共振器面発光レーザー市場:波長別(2022年、2030年)
- 赤色線
- 近赤外線(NIR)
- 短波長赤外線(SWIR)
第11章 アジア太平洋の垂直共振器面発光レーザー市場分析:用途別
- 概要
- アジア太平洋の垂直共振器面発光レーザー市場:用途別(2022年、2030年)
- センシング
- データ通信
- 工業用加熱・印刷
- その他
第12章 アジア太平洋の垂直共振器面発光レーザー市場分析-最終用途産業別
- 概要
- アジア太平洋の垂直共振器面発光レーザー市場:最終用途産業別(2022年、2030年)
- モバイル&コンシューマー
- 通信・インフラ
- 産業用
- 防衛・航空宇宙
- 医療
- 自動車&モビリティ
第13章 アジア太平洋の垂直共振器面発光レーザー市場:国別分析
- 中国
- インド
- 日本
- オーストラリア
- 韓国
- その他のアジア太平洋
第14章 業界情勢
- 概要
- 市場イニシアティブ
- 製品開発
- 合併と買収
第15章 企業プロファイル
- Lumentum Holdings Inc
- Coherent Corp
- TRUMPF SE+Co KG
- Broadcom Inc
- ams-OSRAM AG
- 主要データ
- 事業内容
- 製品とサービス
- 財務概要
- SWOT分析
- 主な発展
- Vertilite Co Ltd
- 主要データ
- 事業内容
- 製品とサービス
- 財務概要
- SWOT分析
- 主な発展
- Leonardo SpA
- 主要データ
- 事業内容
- 製品とサービス
- 財務概要
- SWOT分析
- 主な発展
- IQE Plc
- 主要データ
- 事業内容
- 製品とサービス
- 財務概要
- SWOT分析
- 主な発展
- VERTILAS GmbH
- 主要データ
- 事業内容
- 製品とサービス
- 財務概要
- SWOT分析
- 主な発展
- Hamamatsu Photonics KK
- 会社概要
- 事業内容
- 製品・サービス
- 財務概要
- SWOT分析
- 主な発展
第16章 付録
List Of Tables
- Table 1. Asia Pacific VCSEL Market - Revenue and Forecast to 2030 (US$ Million)
- Table 2. Asia Pacific VCSEL Market, Revenue and Forecast to 2030 - By Country (US$ Million)
- Table 3. China: Asia Pacific VCSEL Market, Revenue and Forecast to 2030 - By Type (US$ Million)
- Table 4. China: Asia Pacific VCSEL Market, Revenue and Forecast to 2030 - By Material (US$ Million)
- Table 5. China: Asia Pacific VCSEL Market, Revenue and Forecast to 2030 - By Data Rate (US$ Million)
- Table 6. China: Asia Pacific VCSEL Market, Revenue and Forecast to 2030 - By Wavelength (US$ Million)
- Table 7. China: Asia Pacific VCSEL Market, Revenue and Forecast to 2030 - By Application (US$ Million)
- Table 8. China: Asia Pacific VCSEL Market, Revenue and Forecast to 2030 - By End-use Industry (US$ Million)
- Table 9. India: Asia Pacific VCSEL Market, Revenue and Forecast to 2030 - By Type (US$ Million)
- Table 10. India: Asia Pacific VCSEL Market, Revenue and Forecast to 2030 - By Material (US$ Million)
- Table 11. India: Asia Pacific VCSEL Market, Revenue and Forecast to 2030 - By Data Rate (US$ Million)
- Table 12. India: Asia Pacific VCSEL Market, Revenue and Forecast to 2030 - By Wavelength (US$ Million)
- Table 13. India: Asia Pacific VCSEL Market, Revenue and Forecast to 2030 - By Application (US$ Million)
- Table 14. India: Asia Pacific VCSEL Market, Revenue and Forecast to 2030 - By End-use Industry (US$ Million)
- Table 15. Japan: Asia Pacific VCSEL Market, Revenue and Forecast to 2030 - By Type (US$ Million)
- Table 16. Japan: Asia Pacific VCSEL Market, Revenue and Forecast to 2030 - By Material (US$ Million)
- Table 17. Japan: Asia Pacific VCSEL Market, Revenue and Forecast to 2030 - By Data Rate (US$ Million)
- Table 18. Japan: Asia Pacific VCSEL Market, Revenue and Forecast to 2030 - By Wavelength (US$ Million)
- Table 19. Japan: Asia Pacific VCSEL Market, Revenue and Forecast to 2030 - By Application (US$ Million)
- Table 20. Japan: Asia Pacific VCSEL Market, Revenue and Forecast to 2030 - By End-use Industry (US$ Million)
- Table 21. Australia: Asia Pacific VCSEL Market, Revenue and Forecast to 2030 - By Type (US$ Million)
- Table 22. Australia: Asia Pacific VCSEL Market, Revenue and Forecast to 2030 - By Material (US$ Million)
- Table 23. Australia: Asia Pacific VCSEL Market, Revenue and Forecast to 2030 - By Data Rate (US$ Million)
- Table 24. Australia: Asia Pacific VCSEL Market, Revenue and Forecast to 2030 - By Wavelength (US$ Million)
- Table 25. Australia: Asia Pacific VCSEL Market, Revenue and Forecast to 2030 - By Application (US$ Million)
- Table 26. Australia: Asia Pacific VCSEL Market, Revenue and Forecast to 2030 - By End-use Industry (US$ Million)
- Table 27. South Korea: Asia Pacific VCSEL Market, Revenue and Forecast to 2030 - By Type (US$ Million)
- Table 28. South Korea: Asia Pacific VCSEL Market, Revenue and Forecast to 2030 - By Material (US$ Million)
- Table 29. South Korea: Asia Pacific VCSEL Market, Revenue and Forecast to 2030 - By Data Rate (US$ Million)
- Table 30. South Korea: Asia Pacific VCSEL Market, Revenue and Forecast to 2030 - By Wavelength (US$ Million)
- Table 31. South Korea: Asia Pacific VCSEL Market, Revenue and Forecast to 2030 - By Application (US$ Million)
- Table 32. South Korea: Asia Pacific VCSEL Market, Revenue and Forecast to 2030 - By End-use Industry (US$ Million)
- Table 33. Rest of Asia Pacific: Asia Pacific VCSEL Market, Revenue and Forecast to 2030 - By Type (US$ Million)
- Table 34. Rest of Asia Pacific: Asia Pacific VCSEL Market, Revenue and Forecast to 2030 - By Material (US$ Million)
- Table 35. Rest of Asia Pacific: Asia Pacific VCSEL Market, Revenue and Forecast to 2030 - By Data Rate (US$ Million)
- Table 36. Rest of Asia Pacific: Asia Pacific VCSEL Market, Revenue and Forecast to 2030 - By Wavelength (US$ Million)
- Table 37. Rest of Asia Pacific: Asia Pacific VCSEL Market, Revenue and Forecast to 2030 - By Application (US$ Million)
- Table 38. Rest of Asia Pacific: Asia Pacific VCSEL Market, Revenue and Forecast to 2030 - By End-use Industry (US$ Million)
- Table 39. List of Abbreviation
List Of Figures
- Figure 1. Asia Pacific VCSEL Market Segmentation
- Figure 2. Asia Pacific VCSEL Market Segmentation - By Country
- Figure 3. Asia Pacific VCSEL Market Overview
- Figure 4. Multi-Mode Segment held the Largest Share of Asia Pacific VCSEL Market
- Figure 5. India to Show Great Traction During Forecast Period
- Figure 6. APAC: PEST Analysis
- Figure 7. Expert Opinion
- Figure 8. Asia Pacific VCSEL Market Impact Analysis of Drivers and Restraints
- Figure 9. Asia Pacific VCSEL Market - Revenue and Forecast to 2030 (US$ Million)
- Figure 10. Asia Pacific VCSEL Market Revenue Share, By Type (2022 and 2030)
- Figure 11. Single Mode: Asia Pacific VCSEL Market - Revenue, and Forecast to 2030 (US$ Million)
- Figure 12. Multi-Mode: Asia Pacific VCSEL Market - Revenue, and Forecast to 2030 (US$ Million)
- Figure 13. Asia Pacific VCSEL Market Revenue Share, By Material (2022 and 2030)
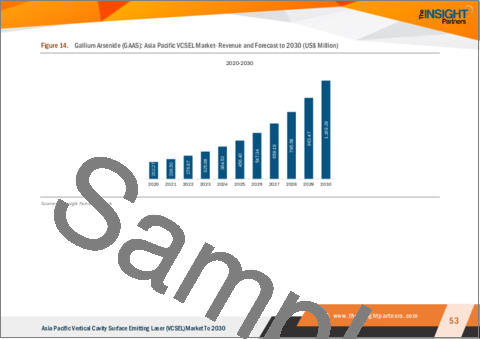
- Figure 14. Gallium Arsenide (GAAS): Asia Pacific VCSEL Market- Revenue and Forecast to 2030 (US$ Million)
- Figure 15. Indium Phosphide (INP): Asia Pacific VCSEL Market- Revenue and Forecast to 2030 (US$ Million)
- Figure 16. Others: Asia Pacific VCSEL Market- Revenue and Forecast to 2030 (US$ Million)
- Figure 17. Asia Pacific VCSEL Market Revenue Share, By Data Rate (2022 and 2030)
- Figure 18. Up to 10 GBPS: Asia Pacific VCSEL Market - Revenue, and Forecast to 2030 (US$ Million)
- Figure 19..1 to 25 GBPS: Asia Pacific VCSEL Market - Revenue, and Forecast to 2030 (US$ Million)
- Figure 20. Above 25 GBPS: Asia Pacific VCSEL Market - Revenue, and Forecast to 2030 (US$ Million)
- Figure 21. Asia Pacific VCSEL Market Revenue Share, By Wavelength (2022 and 2030)
- Figure 22. Red: Asia Pacific VCSEL Market - Revenue, and Forecast to 2030 (US$ Million)
- Figure 23. Near Infrared (NIR): Asia Pacific VCSEL Market - Revenue, and Forecast to 2030 (US$ Million)
- Figure 24. Short Wave Infrared (SWIR): Asia Pacific VCSEL Market - Revenue, and Forecast to 2030 (US$ Million)
- Figure 25. Asia Pacific VCSEL Market Revenue Share, By Application (2022 and 2030)
- Figure 26. Sensing: Asia Pacific VCSEL Market - Revenue, and Forecast to 2030 (US$ Million)
- Figure 27. Data Communication: Asia Pacific VCSEL Market - Revenue, and Forecast to 2030 (US$ Million)
- Figure 28. Industrial Heating & Printing: Asia Pacific VCSEL Market - Revenue, and Forecast to 2030 (US$ Million)
- Figure 29. Others: Asia Pacific VCSEL Market- Revenue and Forecast to 2030 (US$ Million)
- Figure 30. Asia Pacific VCSEL Market Revenue Share, By End-use Industry (2022 and 2030)
- Figure 31. Mobile & Consumer: Asia Pacific VCSEL Market - Revenue, and Forecast to 2030 (US$ Million)
- Figure 32. Telecom & Infrastructure: Asia Pacific VCSEL Market - Revenue, and Forecast to 2030 (US$ Million)
- Figure 33. Industrial: Asia Pacific VCSEL Market - Revenue, and Forecast to 2030 (US$ Million)
- Figure 34. Defense & Aerospace: Asia Pacific VCSEL Market- Revenue and Forecast to 2030 (US$ Million)
- Figure 35. Medical: Asia Pacific VCSEL Market- Revenue and Forecast to 2030 (US$ Million)
- Figure 36. Automotive & Mobility: Asia Pacific VCSEL Market- Revenue and Forecast to 2030 (US$ Million)
- Figure 37. Asia Pacific VCSEL Market, by Key Country- Revenue (2022) (US$ Million)
- Figure 38. Asia Pacific VCSEL Market Breakdown, by Country, 2022 & 2030 (%)
- Figure 39. China: Asia Pacific VCSEL Market, Revenue and Forecast to 2030 (US$ Million)
- Figure 40. India: Asia Pacific VCSEL Market, Revenue and Forecast to 2030 (US$ Million)
- Figure 41. Japan: Asia Pacific VCSEL Market, Revenue and Forecast to 2030 (US$ Million)
- Figure 42. Australia: Asia Pacific VCSEL Market, Revenue and Forecast to 2030 (US$ Million)
- Figure 43. South Korea: Asia Pacific VCSEL Market, Revenue and Forecast to 2030 (US$ Million)
- Figure 44. Rest of Asia Pacific: Asia Pacific VCSEL Market, Revenue and Forecast to 2030 (US$ Million)
The Asia Pacific vertical cavity surface emitting laser market is expected to grow from US$ 470.98 million in 2023 to US$ 1,631.20 million by 2030. It is estimated to grow at a CAGR of 19.4% from 2023 to 2030.
Increasing Data Centers Fuel Asia Pacific Vertical Cavity Surface Emitting Laser (VCSEL) Market
The rising use of digitization, the Internet of Things (IoT), AI, and big data generates a huge amount of data that needs to be processed, stored, and analyzed in real time. The adoption of IoT and cloud technologies has increased the number of interconnected devices and systems, resulting in a mounting need for high speed, low latency, and better network connectivity. Thus, the rising data generation led to the increase in the construction of data centers to handle large data volumes. In December 2021, NEXTDC LTD, a data center service provider, opened its first edge data center in Queensland to provide low-latency and data center services across Australia. In October 2022, it also launched a 100,000-square-meter data center in Melbourne with an investment of US$ 1.5 billion. In December 2022, NTT, a technology service company, opened a new hyperscale data center in Navi Mumbai, India, with a capacity of 5,000 racks, supporting 30 MW of IT load. The increasing number of data centers has upsurged the need for high data transmission speed to maintain and manage the data center. The ability of VCSEL to emit light at high speeds makes it one of the ideal options for high-speed data transmission applications. Thus, the rising demand for VCSEL for the optical interconnect infrastructures in the data centers is expected to offer lucrative opportunities for the Asia Pacific VSCEL market in the coming years.
Asia Pacific Vertical Cavity Surface Emitting Laser (VCSEL) Market Overview
Based on country, the Asia Pacific VCSEL market is segmented into Australia, China, India, Japan, South Korea, and the Rest of Asia Pacific. The automotive industry across Asia Pacific has been experiencing significant growth over the years.
According to the International Organization of Motor Vehicle Manufacturers, in 2022, India, China, Indonesia, South Korea, and Thailand witnessed a significant rise in vehicle production. Additionally, regional and global automotive manufacturers are investing in establishing new vehicle production plants across the region. For instance, in March 2022, Triton Electric Vehicle LLC announced the launch of its new production plant in Gujarat, India. In addition, in June 2022, BMW announced the opening of its new electric vehicle production plant in China with an investment of US$ 2.2 billion. Thus, such growing investments in the automotive industry increase the demand for sensing technology for newly built automobiles. In the automotive industry, VSCEL technology in automotives is used for various sensor applications inside and outside the automotive cabin, contributing to the demand for VCSEL in the region.
Asia Pacific Vertical Cavity Surface Emitting Laser (VCSEL) Market Revenue and Forecast to 2030 (US$ Million)
Asia Pacific Vertical Cavity Surface Emitting Laser (VCSEL) Market Segmentation
The Asia Pacific vertical cavity surface emitting laser market is segmented into type, material, data rate, wavelength, application, end-use industry, and country.
Based on type, the Asia Pacific vertical cavity surface emitting laser market is segmented into single mode and multi-mode. The single mode segment held a larger share of the Asia Pacific vertical cavity surface emitting laser market in 2023.
Based on material, the Asia Pacific vertical cavity surface emitting laser market is segmented into Gallium Arsenide (GAAS), Indium Phosphide (INP), others. The Gallium Arsenide (GAAS) segment held the largest share of the Asia Pacific vertical cavity surface emitting laser market in 2023.
Based on data rate, the Asia Pacific vertical cavity surface emitting laser market is segmented into Up to 10 GBPS, 10.1 to 25 GBPS, and Above 25 GBPS. The above 25 GBPS segment held the largest share of the Asia Pacific vertical cavity surface emitting laser market in 2023.
Based on wavelength, the Asia Pacific vertical cavity surface emitting laser market is segmented into Red, Near Infrared (NIR), and Short-Wave Infrared (SWIR). The red segment held the largest share of the Asia Pacific vertical cavity surface emitting laser market in 2023.
Based on application, the Asia Pacific vertical cavity surface emitting laser market is segmented into sensing, data communication, industrial heating & printing, and others. The sensing segment held the largest share of the Asia Pacific vertical cavity surface emitting laser market in 2023.
Based on end-use industry, the Asia Pacific vertical cavity surface emitting laser market is segmented into mobile & consumer, telecom & infrastructure, industrial, defense & aerospace, medical, and automotive & mobility. The mobile & consumer segment held the largest share of the Asia Pacific vertical cavity surface emitting laser market in 2023.
Based on country, the Asia Pacific vertical cavity surface emitting laser market is segmented into China, India, Japan, Australia, South Korea, and the Rest of Asia Pacific. China dominated the share of the Asia Pacific vertical cavity surface emitting laser market in 2023.
ams-OSRAM AG; Broadcom Inc; Coherent Corp; Hamamatsu Photonics KK; IQE Plc; Leonardo SpA; Lumentum Holdings Inc.; TRUMPF SE + Co KG; VERTILAS GmbH; and Vertilite Co Ltd are the leading companies operating in the Asia Pacific vertical cavity surface emitting laser market.
Reasons to Buy:
- Save and reduce time carrying out entry-level research by identifying the growth, size, leading players, and segments in the Asia Pacific vertical cavity surface emitting laser market.
- Highlights key business priorities in order to assist companies to realign their business strategies.
- The key findings and recommendations highlight crucial progressive industry trends in Asia Pacific vertical cavity surface emitting laser market, thereby allowing players across the value chain to develop effective long-term strategies.
- Develop/modify business expansion plans by using substantial growth offering developed and emerging markets.
- Scrutinize in-depth Asia Pacific market trends and outlook coupled with the factors driving the market, as well as those hindering it.
- Enhance the decision-making process by understanding the strategies that underpin security interest with respect to client products, segmentation, pricing and distribution
Table Of Contents
1. Introduction
- 1.1 Study Scope
- 1.2 The Insight Partners Research Report Guidance
- 1.3 Market Segmentation
- 1.3.1 Asia Pacific VCSEL Market - By Type
- 1.3.2 Asia Pacific VCSEL Market - By Material
- 1.3.3 Asia Pacific VCSEL Market - By Data Rate
- 1.3.4 Asia Pacific VCSEL Market - By Wavelength
- 1.3.5 Asia Pacific VCSEL Market - By Application
- 1.3.6 Asia Pacific VCSEL Market - End-use Industry
- 1.3.7 Asia Pacific VCSEL Market- By Country
2. Key Takeaways
3. Research Methodology
- 3.1 Coverage
- 3.2 Secondary Research
- 3.3 Primary Research
4. Asia Pacific VCSEL Market Landscape
- 4.1 Market Overview
- 4.2 Asia Pacific PEST Analysis
- 4.3 Ecosystem Analysis
- 4.4 Expert Opinion
5. Asia Pacific VCSEL Market - Key Market Dynamics
- 5.1 Market Drivers
- 5.1.1 Rising Adoption of VCSEL for 3D Sensing Applications
- 5.1.2 Emerging Telecommunication Industry
- 5.2 Market Restraints
- 5.2.1 Stringent Government Standard on VCSEL Use
- 5.3 Market Opportunities
- 5.3.1 Increasing Data Centers
- 5.4 Future Trends
- 5.4.1 Miniaturization in Electronics
- 5.5 Impact Analysis of Drivers and Restraints
6. VCSEL Market - Asia Pacific Analysis
- 6.1 Asia Pacific VCSEL Market Overview
- 6.2 Asia Pacific VCSEL Market - Revenue and Forecast to 2030 (US$ Million)
7. Asia Pacific VCSEL Market Analysis - By Type
- 7.1 Overview
- 7.2 Asia Pacific VCSEL Market, By Type (2022 and 2030)
- 7.3 Single Mode
- 7.3.1 Overview
- 7.3.2 Single Mode: Asia Pacific VCSEL Market - Revenue, and Forecast to 2030 (US$ Million)
- 7.4 Multi-Mode
- 7.4.1 Overview
- 7.4.2 Multi-Mode: Asia Pacific VCSEL Market - Revenue, and Forecast to 2030 (US$ Million)
8. Asia Pacific VCSEL Market Analysis - By Material
- 8.1 Overview
- 8.2 Asia Pacific VCSEL Market, By End User (2022 and 2030)
- 8.3 Gallium Arsenide (GAAS)
- 8.3.1 Overview
- 8.3.2 Gallium Arsenide (GAAS): Asia Pacific VCSEL Market- Revenue and Forecast to 2030 (US$ Million)
- 8.4 Indium Phosphide (INP)
- 8.4.1 Overview
- 8.4.2 Indium Phosphide (INP): Asia Pacific VCSEL Market- Revenue and Forecast to 2030 (US$ Million)
- 8.5 Others
- 8.5.1 Overview
- 8.5.2 Others: Asia Pacific VCSEL Market- Revenue and Forecast to 2030 (US$ Million)
9. Asia Pacific VCSEL Market Analysis - By Data Rate
- 9.1 Overview
- 9.2 Asia Pacific VCSEL Market, By Data Rate (2022 and 2030)
- 9.3 Up to 10 GBPS
- 9.3.1 Overview
- 9.3.2 Up to 10 GBPS: Asia Pacific VCSEL Market - Revenue, and Forecast to 2030 (US$ Million)
- 9.4.1 to 25 GBPS
- 9.4.1 Overview
- 9.4.2.1 to 25 GBPS: Asia Pacific VCSEL Market - Revenue, and Forecast to 2030 (US$ Million)
- 9.5 Above 25 GBPS
- 9.5.1 Overview
- 9.5.2 Above 25 GBPS: Asia Pacific VCSEL Market - Revenue, and Forecast to 2030 (US$ Million)
10. Asia Pacific VCSEL Market Analysis - By Wavelength
- 10.1 Overview
- 10.2 Asia Pacific VCSEL Market, By Wavelength (2022 and 2030)
- 10.3 Red
- 10.3.1 Overview
- 10.3.2 Red: Asia Pacific VCSEL Market - Revenue, and Forecast to 2030 (US$ Million)
- 10.4 Near Infrared (NIR)
- 10.4.1 Overview
- 10.4.2 Near Infrared (NIR): Asia Pacific VCSEL Market - Revenue, and Forecast to 2030 (US$ Million)
- 10.5 Short Wave Infrared (SWIR)
- 10.5.1 Overview
- 10.5.2 Short Wave Infrared (SWIR): Asia Pacific VCSEL Market - Revenue, and Forecast to 2030 (US$ Million)
11. Asia Pacific VCSEL Market Analysis - By Application
- 11.1 Overview
- 11.2 Asia Pacific VCSEL Market, By Application (2022 and 2030)
- 11.3 Sensing
- 11.3.1 Overview
- 11.3.2 Sensing: Asia Pacific VCSEL Market - Revenue, and Forecast to 2030 (US$ Million)
- 11.4 Data Communication
- 11.4.1 Overview
- 11.4.2 Data Communication: Asia Pacific VCSEL Market - Revenue, and Forecast to 2030 (US$ Million)
- 11.5 Industrial Heating & Printing
- 11.5.1 Overview
- 11.5.2 Industrial Heating & Printing: Asia Pacific VCSEL Market - Revenue, and Forecast to 2030 (US$ Million)
- 11.6 Others
- 11.6.1 Overview
- 11.6.2 Others: Asia Pacific VCSEL Market- Revenue and Forecast to 2030 (US$ Million)
12. Asia Pacific VCSEL Market Analysis - By End-use Industry
- 12.1 Overview
- 12.2 Asia Pacific VCSEL Market, By End-use Industry (2022 and 2030)
- 12.3 Mobile & Consumer
- 12.3.1 Overview
- 12.3.2 Mobile & Consumer: Asia Pacific VCSEL Market - Revenue, and Forecast to 2030 (US$ Million)
- 12.4 Telecom & Infrastructure
- 12.4.1 Overview
- 12.4.2 Telecom & Infrastructure: Asia Pacific VCSEL Market - Revenue, and Forecast to 2030 (US$ Million)
- 12.5 Industrial
- 12.5.1 Overview
- 12.5.2 Industrial: Asia Pacific VCSEL Market - Revenue, and Forecast to 2030 (US$ Million)
- 12.6 Defense & Aerospace
- 12.6.1 Overview
- 12.6.2 Defense & Aerospace: Asia Pacific VCSEL Market- Revenue and Forecast to 2030 (US$ Million)
- 12.7 Medical
- 12.7.1 Overview
- 12.7.2 Medical: Asia Pacific VCSEL Market- Revenue and Forecast to 2030 (US$ Million)
- 12.8 Automotive & Mobility
- 12.8.1 Overview
- 12.8.2 Automotive & Mobility: Asia Pacific VCSEL Market- Revenue and Forecast to 2030 (US$ Million)
13. Asia Pacific VCSEL Market - Country Analysis
- 13.1 Overview
- 13.1.1 Asia Pacific VCSEL Market Breakdown, by Country
- 13.1.1.1 China: Asia Pacific VCSEL Market, Revenue and Forecast to 2030
- 13.1.1.1.1 China: Asia Pacific VCSEL Market Breakdown, By Type
- 13.1.1.1.2 China: Asia Pacific VCSEL Market Breakdown, By Material
- 13.1.1.1.3 China: Asia Pacific VCSEL Market Breakdown, By Data Rate
- 13.1.1.1.4 China: Asia Pacific VCSEL Market Breakdown, By Wavelength
- 13.1.1.1.5 China: Asia Pacific VCSEL Market Breakdown, By Application
- 13.1.1.1.6 China: Asia Pacific VCSEL Market Breakdown, By End-use Industry
- 13.1.1.2 India: Asia Pacific VCSEL Market, Revenue and Forecast to 2030
- 13.1.1.2.1 India: Asia Pacific VCSEL Market Breakdown, By Type
- 13.1.1.2.2 India: Asia Pacific VCSEL Market Breakdown, By Material
- 13.1.1.2.3 India: Asia Pacific VCSEL Market Breakdown, By Data Rate
- 13.1.1.2.4 India: Asia Pacific VCSEL Market Breakdown, By Wavelength
- 13.1.1.2.5 India: Asia Pacific VCSEL Market Breakdown, By Application
- 13.1.1.2.6 India: Asia Pacific VCSEL Market Breakdown, By End-use Industry
- 13.1.1.3 Japan: Asia Pacific VCSEL Market, Revenue and Forecast to 2030
- 13.1.1.3.1 Japan: Asia Pacific VCSEL Market Breakdown, By Type
- 13.1.1.3.2 Japan: Asia Pacific VCSEL Market Breakdown, By Material
- 13.1.1.3.3 Japan: Asia Pacific VCSEL Market Breakdown, By Data Rate
- 13.1.1.3.4 Japan: Asia Pacific VCSEL Market Breakdown, By Wavelength
- 13.1.1.3.5 Japan: Asia Pacific VCSEL Market Breakdown, By Application
- 13.1.1.3.6 Japan: Asia Pacific VCSEL Market Breakdown, By End-use Industry
- 13.1.1.4 Australia: Asia Pacific VCSEL Market, Revenue and Forecast to 2030
- 13.1.1.4.1 Australia: Asia Pacific VCSEL Market Breakdown, By Type
- 13.1.1.4.2 Australia: Asia Pacific VCSEL Market Breakdown, By Material
- 13.1.1.4.3 Australia: Asia Pacific VCSEL Market Breakdown, By Data Rate
- 13.1.1.4.4 Australia: Asia Pacific VCSEL Market Breakdown, By Wavelength
- 13.1.1.4.5 Australia: Asia Pacific VCSEL Market Breakdown, By Application
- 13.1.1.4.6 Australia: Asia Pacific VCSEL Market Breakdown, By End-use Industry
- 13.1.1.5 South Korea: Asia Pacific VCSEL Market, Revenue and Forecast to 2030
- 13.1.1.5.1 South Korea: Asia Pacific VCSEL Market Breakdown, By Type
- 13.1.1.5.2 South Korea: Asia Pacific VCSEL Market Breakdown, By Material
- 13.1.1.5.3 South Korea: Asia Pacific VCSEL Market Breakdown, By Data Rate
- 13.1.1.5.4 South Korea: Asia Pacific VCSEL Market Breakdown, By Wavelength
- 13.1.1.5.5 South Korea: Asia Pacific VCSEL Market Breakdown, By Application
- 13.1.1.5.6 South Korea: Asia Pacific VCSEL Market Breakdown, By End-use Industry
- 13.1.1.6 Rest of Asia Pacific: Asia Pacific VCSEL Market, Revenue and Forecast to 2030
- 13.1.1.6.1 Rest of Asia Pacific: Asia Pacific VCSEL Market Breakdown, By Type
- 13.1.1.6.2 Rest of Asia Pacific: Asia Pacific VCSEL Market Breakdown, By Material
- 13.1.1.6.3 Rest of Asia Pacific: Asia Pacific VCSEL Market Breakdown, By Data Rate
- 13.1.1.6.4 Rest of Asia Pacific: Asia Pacific VCSEL Market Breakdown, By Wavelength
- 13.1.1.6.5 Rest of Asia Pacific: Asia Pacific VCSEL Market Breakdown, By Application
- 13.1.1.6.6 Rest of Asia Pacific: Asia Pacific VCSEL Market Breakdown, By End-use Industry
- 13.1.1.1 China: Asia Pacific VCSEL Market, Revenue and Forecast to 2030
- 13.1.1 Asia Pacific VCSEL Market Breakdown, by Country
14. Industry Landscape
- 14.1 Overview
- 14.2 Market Initiative
- 14.3 Product Development
- 14.4 Mergers & Acquisitions
15. Company Profiles
- 15.1 Lumentum Holdings Inc
- 15.1.1 Key Facts
- 15.1.2 Business Description
- 15.1.3 Products and Services
- 15.1.4 Financial Overview
- 15.1.5 SWOT Analysis
- 15.1.6 Key Developments
- 15.2 Coherent Corp
- 15.2.1 Key Facts
- 15.2.2 Business Description
- 15.2.3 Products and Services
- 15.2.4 Financial Overview
- 15.2.5 SWOT Analysis
- 15.2.6 Key Developments
- 15.3 TRUMPF SE + Co KG
- 15.3.1 Key Facts
- 15.3.2 Business Description
- 15.3.3 Products and Services
- 15.3.4 Financial Overview
- 15.3.5 SWOT Analysis
- 15.3.6 Key Developments
- 15.4 Broadcom Inc
- 15.4.1 Key Facts
- 15.4.1.1 Business Description
- 15.4.1.2 Products and Services
- 15.4.2 Financial Overview
- 15.4.3 SWOT Analysis
- 15.4.4 Key Developments
- 15.4.1 Key Facts
- 15.5 ams-OSRAM AG
- 15.5.1 Key Facts
- 15.5.2 Business Description
- 15.5.3 Products and Services
- 15.5.4 Financial Overview
- 15.5.5 SWOT Analysis
- 15.5.6 Key Developments
- 15.6 Vertilite Co Ltd
- 15.6.1 Key Facts
- 15.6.2 Business Description
- 15.6.3 Products and Services
- 15.6.4 Financial Overview
- 15.6.5 SWOT Analysis
- 15.6.6 Key Developments
- 15.7 Leonardo SpA
- 15.7.1 Key Facts
- 15.7.2 Business Description
- 15.7.3 Products and Services
- 15.7.4 Financial Overview
- 15.7.5 SWOT Analysis
- 15.7.6 Key Developments
- 15.8 IQE Plc
- 15.8.1 Key Facts
- 15.8.2 Business Description
- 15.8.3 Products and Services
- 15.8.4 Financial Overview
- 15.8.5 SWOT Analysis
- 15.8.6 Key Developments
- 15.9 VERTILAS GmbH
- 15.9.1 Key Facts
- 15.9.2 Business Description
- 15.9.3 Products and Services
- 15.9.4 Financial Overview
- 15.9.5 SWOT Analysis
- 15.9.6 Key Developments
- 15.10 Hamamatsu Photonics KK
- 15.10.1 Key Facts
- 15.10.2 Business Description
- 15.10.3 Products and Services
- 15.10.4 Financial Overview
- 15.10.5 SWOT Analysis
- 15.10.6 Key Developments
16. Appendix
- 16.1 About The Insight Partners
- 16.2 Word Index