|
|
市場調査レポート
商品コード
1296752
直接還元鉄(DRI)市場の2030年までの予測- 形態別(塊状、ペレット、細粒)、製造プロセス別(石炭ベース、ガスベース)、用途別(製鉄、建設)の世界分析Direct Reduced Iron (DRI) Market Forecast to 2030 - Global Analysis by Form (Lumps, Pellets, and Fine), Production Process (Coal Based and Gas Based), Application (Steel Making and Construction) |
||||||
|
|
|||||||
|
|||||||


| 直接還元鉄(DRI)市場の2030年までの予測- 形態別(塊状、ペレット、細粒)、製造プロセス別(石炭ベース、ガスベース)、用途別(製鉄、建設)の世界分析 |
|
出版日: 2023年06月15日
発行: The Insight Partners
ページ情報: 英文 192 Pages
納期: 即納可能
|

- 全表示
- 概要
- 図表
- 目次
直接還元鉄(DRI)の市場規模は、2022年の373億6,000万米ドルから2030年には668億米ドルに成長すると予想されており、2023年から2030年までのCAGRは7.6%と推定されています。
炭素排出に関する意識と、持続可能な目標を達成するための一歩先を行く行動は、製造業にとって最大の関心事です。製造業からの炭素排出は、世界中で発生する温室効果ガスに大きく寄与しています。世界鉄鋼協会によると、鉄鋼業は2021年に30億トンのCO2を排出しました。鉄鋼業が排出するCO2だけでも、温室効果ガス全体の7~9%を占めており、気候に大きな影響を与えています。持続可能な未来を実現するため、さまざまな政府機関が二酸化炭素排出量の削減に取り組んでいます。米国政府は、電気自動車、風力タービン、ソーラーパネルに必要な鉄鋼やアルミニウムの低炭素生産を含む、持続可能な製造業を支援するクリーン水素イニシアチブを開始しました。例えば、米国エネルギー省(DOE)は2023年5月、クリーン水素の製造、貯蔵、配備のための重要な技術を推進するため、14州の22プロジェクトに約4,200万米ドルの資金を提供すると発表しました。さらに、カナダ政府は、温室効果ガスの排出を最小限に抑え、2050年までに純ゼロ排出を達成するための排出削減計画を発表しました。欧州クリーン・スチール・パートナーシップは2021年6月に発足し、欧州鉄鋼の競争力と存続可能性を維持しながら、欧州鉄鋼生産からのCO2排出量を80~95%削減する技術が共同で開発されました。こうした政府の取り組みは、鉄鋼業界におけるカーボンフリー製造へのシフトを促進しました。水素ベースの製鉄技術は、従来の高炉ベースの製鉄におけるコークスと化石燃料を置き換えることで、炭素排出を無効化するそのようなプロセスのひとつです。
用途に基づき、直接還元鉄(DRI)市場は製鉄と建設に二分されます。2022年には、製鉄部門がより大きなシェアを占めています。建設は2023年から2030年にかけて最も高いCAGRを記録すると予想されています。DRIは、その豊富な金属量と均一な化学的・物理的特性により、建設やインフラ産業での用途が見いだされています。DRIは鉄筋やインゴットの製造に使用されます。建設業界は、インフラ・プロジェクトにおける環境に優しい材料の使用に関して、大きな変化を遂げてきました。しかし、高排出鉄鋼からゼロエミッションに近い鉄鋼にシフトすることで、業界は持続可能な発展に向けて大きな一歩を踏み出すことができます。DRIから生産される鉄鋼は、二酸化炭素排出量を削減し、持続可能な建設プロセスの要求を満たすための、そのような取り組みのひとつです。
地域別では、直接還元鉄(DRI)市場は北米、欧州、アジア太平洋(APAC)、中東・アフリカ(MEA)、中南米に区分されます。2022年には中東・アフリカが最大シェアを占め、2023年から2030年にかけてはアジア太平洋が最も高いCAGRを記録すると推定されます。この地域の市場成長は主に急速な工業化に起因しています。
Nucor Corp、Cleveland-Cliffs Inc.、Kobe Steel Ltd、Voestalpine AG、Ternium SA、SMS Group GmbH、JSW Steel Ltd、Tenova SpA、Liberty Steel Group Holdings UK Ltd、Bharat Engineering Works Pvt Ltd.は、直接還元鉄(DRI)市場で活動している主要企業のひとつです。これらのプレーヤーは、顧客の需要の高まりに対応し、市場シェアを拡大するために、手頃な価格と革新的な製品の開発に取り組んでいます。
直接還元鉄(DRI)市場全体の規模は、一次情報と二次情報の両方を使用して導き出されています。調査プロセスを開始するにあたり、市場に関する質的・量的情報を入手するため、社内外の情報源を用いて徹底的な二次調査を実施しました。また、データを検証し、このテーマについてより分析的な洞察を得るために、業界関係者に複数の一次インタビューを実施しました。このプロセスの参入企業には、直接還元鉄(DRI)市場を専門とする副社長、事業開発マネージャー、マーケットインテリジェンスマネージャー、国内営業マネージャー、および評価専門家、研究アナリスト、主要オピニオンリーダーなどの外部コンサルタントが含まれます。
目次
第1章 イントロダクション
第2章 主な要点
第3章 調査手法
- 調査範囲
- 調査手法
- データ収集
- 一次インタビュー
- 仮説の策定
- マクロ経済要因分析
- 基礎数値の作成
- データの三角測量
- 国レベルのデータ
第4章 直接還元鉄(DRI)市場情勢
- 市場概要
- ポーターのファイブフォース分析
- 新規参入業者の脅威
- 供給企業の交渉力:新規参入の脅威
- 買い手の交渉力:新規参入の脅威
- 競争企業間の敵対関係
- 代替品の脅威
- エコシステム分析
- 原材料サプライヤー
- メーカー
- ディストリビューター/サプライヤー
- 最終用途産業
- 専門家の見解
第5章 直接還元鉄(DRI)市場:主要市場力学
- 市場促進要因
- 鉄鋼生産量と使用量の増加
- 直接還元鉄プラントの拡大
- 市場抑制要因
- 高品質原料の不足
- 市場機会
- グリーン・スチール生産への嗜好の高まり
- 今後の動向
- 二酸化炭素排出量削減のための様々な政府機関別取り組み
- 影響分析
第6章 直接還元鉄(DRI):世界市場分析
- 直接還元鉄(DRI)市場概要
- 直接還元鉄(DRI)市場-2030年までの数量と予測
- 市場のポジショニング-主要市場プレイヤー
第7章 直接還元鉄(DRI)の世界市場分析:形態別
- 直接還元鉄(DRI)市場:形態別(2022年、2030年)
- 塊状
- ペレット
- 細粒
第8章 直接還元鉄(DRI)の世界市場分析:製造プロセス別
- 直接還元鉄(DRI)市場:製造プロセス別(2022年、2030年)
- 石炭ベース
- ガスベース
第9章 直接還元鉄(DRI)の世界市場分析:用途別
- 直接還元鉄(DRI)市場:用途別(2022年、2030年)
- 製鉄
- 建設
第10章 直接還元鉄の世界市場分析:地域別分析
- 北米
- 米国
- カナダ
- メキシコ
- 欧州
- ドイツ
- フランス
- イタリア
- 英国
- ロシア
- その他欧州
- アジア太平洋
- マレーシア
- 中国
- インド
- 日本
- 韓国
- その他アジア太平洋地域
- 中東・アフリカ
- イラン
- サウジアラビア
- アラブ首長国連邦
- その他中東とアフリカ
- 中南米
- ブラジル
- アルゼンチン
- その他中南米
第11章 直接還元鉄市場へのCOVID-19パンデミックが与える影響
- COVID-19の直接還元鉄市場への影響
- 北米
- 欧州
- アジア太平洋
- 中東・アフリカ
- 中南米
第12章 業界情勢
- 合併と買収
第13章 企業プロファイル
- Nucor Corp
- Cleveland-Cliffs Inc
- Kobe Steel Ltd
- SMS Group GmbH
- Voestalpine AG
- Ternium SA
- JSW Steel Ltd
- Tenova SpA
- Liberty Steel Group Holdings UK Ltd
- Bharat Engineering Works Pvt Ltd
第14章 付録
List Of Tables
- Table 1. Direct Reduced Iron (DRI) Market -Volume and Forecast to 2030 (Kilo Tons)
- Table 2. Direct Reduced Iron (DRI) Market -Revenue and Forecast to 2030 (US$ Million)
- Table 3. Global Direct Reduced Iron Market, by Form - Volume and Forecast to 2028 (Kilo Tons)
- Table 4. Global Direct Reduced Iron (DRI) Market, by Form - Revenue and Forecast to 2030 (US$ Million)
- Table 5. Global Direct Reduced Iron (DRI) Market, by Production Process - Revenue and Forecast to 2030 (US$ Million)
- Table 6. Global Direct Reduced Iron (DRI) Market, by Application - Revenue and Forecast to 2030 (US$ Million)
- Table 7. North America Direct Reduced Iron Market, by Form - Volume and Forecast to 2030 (Kilo Tons)
- Table 8. North America Direct Reduced Iron Market, by Form - Revenue and Forecast to 2030 (US$ Million)
- Table 9. North America Direct Reduced Iron Market, by Production Process - Revenue and Forecast to 2030 (US$ Million)
- Table 10. North America Direct Reduced Iron Market, by Application - Revenue and Forecast to 2030 (US$ Million)
- Table 11. US Direct Reduced Iron Market, by Form - Volume and Forecast to 2030 (Kilo Tons)
- Table 12. US Direct Reduced Iron Market, by Form - Revenue and Forecast to 2030 (US$ Million)
- Table 13. US Direct Reduced Iron Market, by Production Process - Revenue and Forecast to 2030 (US$ Million)
- Table 14. US Direct Reduced Iron Market, by Application - Revenue and Forecast to 2030 (US$ Million)
- Table 15. Canada: Direct Reduced Iron Market, by Form - Volume and Forecast to 2030 (Kilo Tons)
- Table 16. Canada: Direct Reduced Iron Market, by Form - Revenue and Forecast to 2030 (US$ Million)
- Table 17. Canada: Direct Reduced Iron Market, by Production Process - Revenue and Forecast to 2030 (US$ Million)
- Table 18. Canada: Direct Reduced Iron Market, by Application - Revenue and Forecast to 2030 (US$ Million)
- Table 19. Mexico Direct Reduced Iron Market, by Form - Volume and Forecast to 2030 (Kilo Tons)
- Table 20. Mexico Direct Reduced Iron Market, by Form - Revenue and Forecast to 2030 (US$ Million)
- Table 21. Mexico Direct Reduced Iron Market, by Production Process - Revenue and Forecast to 2030 (US$ Million)
- Table 22. Mexico Direct Reduced Iron Market, by Application - Revenue and Forecast to 2030 (US$ Million)
- Table 23. Europe Direct Reduced Iron Market, by Form - Volume and Forecast to 2030 (Kilo Tons)
- Table 24. Europe Direct Reduced Iron Market, by Form - Revenue and Forecast to 2030 (US$ Million)
- Table 25. Europe Direct Reduced Iron Market, by Production Process - Revenue and Forecast to 2030 (US$ Million)
- Table 26. Europe Direct Reduced Iron Market, by Application - Revenue and Forecast to 2030 (US$ Million)
- Table 27. Germany Direct Reduced Iron Market, by Form - Volume and Forecast to 2030 (Kilo Tons)
- Table 28. Germany Direct Reduced Iron Market, by Form - Revenue and Forecast to 2030 (US$ Million)
- Table 29. Germany Direct Reduced Iron Market, by Production Process - Revenue and Forecast to 2030 (US$ Million)
- Table 30. Germany Direct Reduced Iron Market, by Application - Revenue and Forecast to 2030 (US$ Million)
- Table 31. France Direct Reduced Iron Market, by Form - Volume and Forecast to 2030 (Kilo Tons)
- Table 32. France Direct Reduced Iron Market, by Form - Revenue and Forecast to 2030 (US$ Million)
- Table 33. France Direct Reduced Iron Market, by Production Process - Revenue and Forecast to 2030 (US$ Million)
- Table 34. France Direct Reduced Iron Market, by Application - Revenue and Forecast to 2030 (US$ Million)
- Table 35. Italy Direct Reduced Iron Market, by Form - Volume and Forecast to 2030 (Kilo Tons)
- Table 36. Italy Direct Reduced Iron Market, by Form - Revenue and Forecast to 2030 (US$ Million)
- Table 37. Italy Direct Reduced Iron Market, by Production Process - Revenue and Forecast to 2030 (US$ Million)
- Table 38. Italy Direct Reduced Iron Market, by Application - Revenue and Forecast to 2030 (US$ Million)
- Table 39. United Kingdom Direct Reduced Iron Market, by Form - Volume and Forecast to 2030 (Kilo Tons)
- Table 40. United Kingdom Direct Reduced Iron Market, by Form - Revenue and Forecast to 2030 (US$ Million)
- Table 41. United Kingdom Direct Reduced Iron Market, by Production Process - Revenue and Forecast to 2030 (US$ Million)
- Table 42. United Kingdom Direct Reduced Iron Market, by Application - Revenue and Forecast to 2030 (US$ Million)
- Table 43. Russia: Direct Reduced Iron Market, by Form- Volume and Forecast to 2030 (Kilo Tons)
- Table 44. Russia: Direct Reduced Iron Market, by Form- Revenue and Forecast to 2030 (US$ Million)
- Table 45. Russia: Direct Reduced Iron Market, by Production Process - Revenue and Forecast to 2030 (US$ Million)
- Table 46. Russia: Direct Reduced Iron Market, by Application - Revenue and Forecast to 2030 (US$ Million)
- Table 47. Rest of Europe Direct Reduced Iron Market, by Form - Volume and Forecast to 2030 (Kilo Tons)
- Table 48. Rest of Europe Direct Reduced Iron Market, by Form - Revenue and Forecast to 2030 (US$ Million)
- Table 49. Rest of Europe Direct Reduced Iron Market, by Production Process - Revenue and Forecast to 2030 (US$ Million)
- Table 50. Rest of Europe Direct Reduced Iron Market, by Application - Revenue and Forecast to 2030 (US$ Million)
- Table 51. Asia Pacific Direct Reduced Iron Market, by Form - Volume and Forecast to 2030 (Kilo Tons)
- Table 52. Asia Pacific Direct Reduced Iron Market, by Form - Revenue and Forecast to 2030 (US$ Million)
- Table 53. Asia Pacific Direct Reduced Iron Market, by Production Process - Revenue and Forecast to 2030 (US$ Million)
- Table 54. Asia Pacific Direct Reduced Iron Market, by Application - Revenue and Forecast to 2030 (US$ Million)
- Table 55. Malaysia Direct Reduced Iron Market, by Form- Volume and Forecast to 2030 (Kilo Tons)
- Table 56. Malaysia Direct Reduced Iron Market, by Form- Revenue and Forecast to 2030 (US$ Million)
- Table 57. Malaysia Direct Reduced Iron Market, by Production Process - Revenue and Forecast to 2030 (US$ Million)
- Table 58. Malaysia Direct Reduced Iron Market, by Application - Revenue and Forecast to 2030 (US$ Million)
- Table 59. China Direct Reduced Iron Market, by Form - Volume and Forecast to 2030 (Kilo Tons)
- Table 60. China Direct Reduced Iron Market, by Form - Revenue and Forecast to 2030 (US$ Million)
- Table 61. China Direct Reduced Iron Market, by Production Process - Revenue and Forecast to 2030 (US$ Million)
- Table 62. China Direct Reduced Iron Market, by Application - Revenue and Forecast to 2030 (US$ Million)
- Table 63. India Direct Reduced Iron Market, by Form - Volume and Forecast to 2030 (Kilo Tons)
- Table 64. India Direct Reduced Iron Market, by Form - Revenue and Forecast to 2030 (US$ Million)
- Table 65. India Direct Reduced Iron Market, by Production Process - Revenue and Forecast to 2030 (US$ Million)
- Table 66. India Direct Reduced Iron Market, by Application - Revenue and Forecast to 2030 (US$ Million)
- Table 67. Japan Direct Reduced Iron Market, by Form - Volume and Forecast to 2030 (Kilo Tons)
- Table 68. Japan Direct Reduced Iron Market, by Form - Revenue and Forecast to 2030 (US$ Million)
- Table 69. Japan Direct Reduced Iron Market, by Production Process - Revenue and Forecast to 2030 (US$ Million)
- Table 70. Japan Direct Reduced Iron Market, by Application - Revenue and Forecast to 2030 (US$ Million)
- Table 71. South Korea Direct Reduced Iron Market, by Form - Volume and Forecast to 2030 (Kilo Tons)
- Table 72. South Korea Direct Reduced Iron Market, by Form - Revenue and Forecast to 2030 (US$ Million)
- Table 73. South Korea Direct Reduced Iron Market, by Production Process - Revenue and Forecast to 2030 (US$ Million)
- Table 74. South Korea Direct Reduced Iron Market, by Application - Revenue and Forecast to 2030 (US$ Million)
- Table 75. Rest of Asia Pacific Direct Reduced Iron Market, by Form - Volume and Forecast to 2030 (Kilo Tons)
- Table 76. Rest of Asia Pacific Direct Reduced Iron Market, by Form - Revenue and Forecast to 2030 (US$ Million)
- Table 77. Rest of Asia Pacific Direct Reduced Iron Market, by Production Process - Revenue and Forecast to 2030 (US$ Million)
- Table 78. Rest of Asia Pacific Direct Reduced Iron Market, by Application - Revenue and Forecast to 2030 (US$ Million)
- Table 83. Iran Direct Reduced Iron Market, by Form - Volume and Forecast to 2030 (Kilo Tons)
- Table 84. Iran Direct Reduced Iron Market, by Form - Revenue and Forecast to 2030 (US$ Million)
- Table 85. Iran Direct Reduced Iron Market, by Production Process - Revenue and Forecast to 2030 (US$ Million)
- Table 86. Iran Direct Reduced Iron Market, by Application - Revenue and Forecast to 2030 (US$ Million)
- Table 87. Saudi Arabia Direct Reduced Iron Market, by Form - Volume and Forecast to 2030 (Kilo Tons)
- Table 88. Saudi Arabia Direct Reduced Iron Market, by Form - Revenue and Forecast to 2030 (US$ Million)
- Table 89. Saudi Arabia Direct Reduced Iron Market, by Production Process - Revenue and Forecast to 2030 (US$ Million)
- Table 90. Saudi Arabia Direct Reduced Iron Market, by Application - Revenue and Forecast to 2030 (US$ Million)
- Table 91. UAE Direct Reduced Iron Market, by Form - Volume and Forecast to 2030 (Kilo Tons)
- Table 92. UAE Direct Reduced Iron Market, by Form - Revenue and Forecast to 2030 (US$ Million)
- Table 93. UAE Direct Reduced Iron Market, by Production Process - Revenue and Forecast to 2030 (US$ Million)
- Table 94. UAE Direct Reduced Iron Market, by Application - Revenue and Forecast to 2030 (US$ Million)
- Table 95. Rest of Middle East & Africa Direct Reduced Iron Market, by Form - Volume and Forecast to 2030 (Kilo Tons)
- Table 96. Rest of Middle East & Africa Direct Reduced Iron Market, by Form - Revenue and Forecast to 2030 (US$ Million)
- Table 97. Rest of Middle East & Africa Direct Reduced Iron Market, by Production Process - Revenue and Forecast to 2030 (US$ Million)
- Table 98. Rest of Middle East & Africa Direct Reduced Iron Market, by Application - Revenue and Forecast to 2030 (US$ Million)
- Table 99. South & Central America Direct Reduced Iron Market, by Form - Volume and Forecast to 2030 (Kilo Tons)
- Table 100. South & Central America Direct Reduced Iron Market, by Form - Revenue and Forecast to 2030 (US$ Million)
- Table 101. South & Central America Direct Reduced Iron Market, by Production Process - Revenue and Forecast to 2030 (US$ Million)
- Table 102. South & Central America Direct Reduced Iron Market, by Application - Revenue and Forecast to 2030 (US$ Million)
- Table 103. Brazil Direct Reduced Iron Market, by Form - Volume and Forecast to 2030 (Kilo Tons)
- Table 104. Brazil Direct Reduced Iron Market, by Form - Revenue and Forecast to 2030 (US$ Million)
- Table 105. Brazil Direct Reduced Iron Market, by Production Process - Revenue and Forecast to 2030 (US$ Million)
- Table 106. Brazil Direct Reduced Iron Market, by Application - Revenue and Forecast to 2030 (US$ Million)
- Table 107. Argentina Direct Reduced Iron Market, by Form - Volume and Forecast to 2030 (Kilo Tons)
- Table 108. Argentina Direct Reduced Iron Market, by Form - Revenue and Forecast to 2030 (US$ Million)
- Table 109. Argentina Direct Reduced Iron Market, by Production Process - Revenue and Forecast to 2030 (US$ Million)
- Table 110. Argentina Direct Reduced Iron Market, by Application - Revenue and Forecast to 2030 (US$ Million)
- Table 111. Rest of South & Central America Direct Reduced Iron Market, by Form - Volume and Forecast to 2030 (Kilo Tons)
- Table 112. Rest of South & Central America Direct Reduced Iron Market, by Form - Revenue and Forecast to 2030 (US$ Million)
- Table 113. Rest of South & Central America Direct Reduced Iron Market, by Production Process - Revenue and Forecast to 2030 (US$ Million)
- Table 114. Rest of South & Central America Direct Reduced Iron Market, by Application - Revenue and Forecast to 2030 (US$ Million)
- Table 115. Glossary of Terms, Global Direct Reduced Iron (DRI) Market
List Of Figures
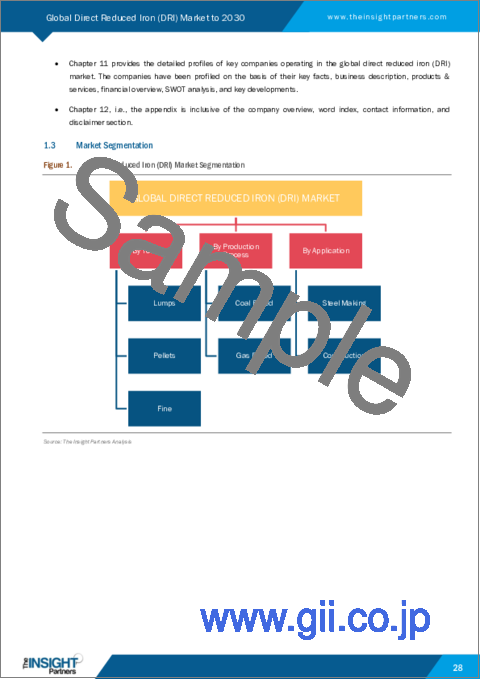
- Figure 1. Direct Reduced Iron (DRI) Market Segmentation
- Figure 2. Direct Reduced Iron (DRI) Market Segmentation - By Geography
- Figure 3. Global Direct Reduced Iron (DRI) Market Overview
- Figure 4. Global Direct Reduced Iron (DRI) Market, By Form
- Figure 5. Global Direct Reduced Iron (DRI) Market, by Geography
- Figure 6. Global Direct Reduced Iron (DRI) Market, Industry Landscape
- Figure 7. Porter's Five Forces Analysis of Direct Reduced Iron (DRI) Market
- Figure 8. Direct Reduced Iron (DRI) Market, Ecosystem
- Figure 9. Expert Opinion
- Figure 10. Global Direct Reduced Iron (DRI) Market Impact Analysis of Drivers and Restraints
- Figure 11. Geographic Overview of Direct Reduced Iron (DRI) Market
- Figure 12. Direct Reduced Iron (DRI) Market - Volume and Forecast to 2030 (Kilo Tons)
- Figure 13. Direct Reduced Iron (DRI) Market - Revenue and Forecast to 2030 (US$ Million)
- Figure 14. Direct Reduced Iron (DRI) Market Revenue Share, By Form (2022 and 2030)
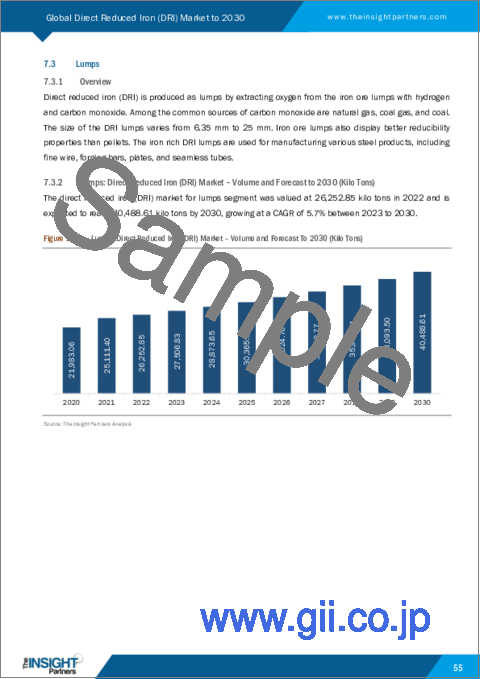
- Figure 15. Lumps: Direct Reduced Iron (DRI) Market - Volume and Forecast To 2030 (Kilo Tons)
- Figure 16. Lumps: Direct Reduced Iron (DRI) Market - Revenue and Forecast To 2030 (US$ Million)
- Figure 17. Pellets: Direct Reduced Iron (DRI) Market - Volume and Forecast To 2030 (Kilo Tons)
- Figure 18. Pellets: Direct Reduced Iron (DRI) Market - Revenue and Forecast To 2030 (US$ Million)
- Figure 19. Fine: Direct Reduced Iron (DRI) Market - Volume and Forecast To 2030 (Kilo Tons)
- Figure 20. Fine: Direct Reduced Iron (DRI) Market - Revenue and Forecast To 2030 (US$ Million)
- Figure 21. Direct Reduced Iron (DRI) Market Revenue Share, By Production Process (2022 and 2030)
- Figure 22. Coal Based: Direct Reduced Iron (DRI) Market - Revenue and Forecast To 2030 (US$ Million)
- Figure 23. Gas Based: Direct Reduced Iron (DRI) Market - Revenue and Forecast To 2030 (US$ Million)
- Figure 24. Direct Reduced Iron (DRI) Market Revenue Share, By Application (2022 and 2030)
- Figure 25. Steel Making: Direct Reduced Iron (DRI) Market - Revenue and Forecast To 2030 (US$ Million)
- Figure 26. Construction: Direct Reduced Iron (DRI) Market - Revenue and Forecast To 2030 (US$ Million)
- Figure 27. Global Direct Reduced Iron Market Revenue Share, by Region (2022 and 2030)
- Figure 28. North America: Direct Reduced Iron Market -Volume and Forecast to 2030 (Kilo Tons)
- Figure 29. North America: Direct Reduced Iron Market - Revenue and Forecast to 2030 (US$ Million)
- Figure 30. North America: Direct Reduced Iron Market Revenue Share, by Form (2022 and 2030)
- Figure 31. North America: Direct Reduced Iron Market Revenue Share, by Production Process (2022 and 2030)
- Figure 32. North America: Direct Reduced Iron Market Revenue Share, by Application (2022 and 2030)
- Figure 33. North America: Direct Reduced Iron Market Revenue Share, by Key Country (2022 and 2030)
- Figure 34. US: Direct Reduced Iron Market -Volume and Forecast to 2030 (Kilo Tons)
- Figure 35. US: Direct Reduced Iron Market -Revenue and Forecast to 2030 (US$ Million)
- Figure 36. Canada: Direct Reduced Iron Market-Volume and Forecast to 2030 (Kilo Tons)
- Figure 37. Canada: Direct Reduced Iron Market-Revenue and Forecast to 2030 (US$ Million)
- Figure 38. Mexico: Direct Reduced Iron Market-Volume and Forecast to 2030 (Kilo Tons)
- Figure 39. Mexico: Direct Reduced Iron Market-Revenue and Forecast to 2030 (US$ Million)
- Figure 40. Europe: Direct Reduced Iron Market-Volume and Forecast to 2030 (Kilo Tons)
- Figure 41. Europe: Direct Reduced Iron Market- Revenue and Forecast to 2030 (US$ Million)
- Figure 42. Europe: Direct Reduced Iron Market Revenue Share, by Form (2022 and 2030)
- Figure 43. Europe: Direct Reduced Iron Market Revenue Share, by Production Process (2022 and 2030)
- Figure 44. Europe: Direct Reduced Iron Market Revenue Share, by Application (2022 and 2030)
- Figure 45. Europe: Direct Reduced Iron Market Revenue Share, by Key Country (2022 and 2030)
- Figure 46. Germany: Direct Reduced Iron Market-Volume and Forecast to 2030 (Kilo Tons)
- Figure 47. Germany: Direct Reduced Iron Market-Revenue and Forecast to 2030 (US$ Million)
- Figure 48. France: Direct Reduced Iron Market-Volume and Forecast to 2030 (Kilo Tons)
- Figure 49. France: Direct Reduced Iron Market-Revenue and Forecast to 2030 (US$ Million)
- Figure 50. Italy: Direct Reduced Iron Market-Volume and Forecast to 2030 (Kilo Tons)
- Figure 51. Italy: Direct Reduced Iron Market-Revenue and Forecast to 2030 (US$ Million)
- Figure 52. United Kingdom: Direct Reduced Iron Market-Volume and Forecast to 2030 (Kilo Tons)
- Figure 53. United Kingdom: Direct Reduced Iron Market-Revenue and Forecast to 2030 (US$ Million)
- Figure 54. Russia: Direct Reduced Iron Market- Volume and Forecast to 2030 (Kilo Tons)
- Figure 55. Russia: Direct Reduced Iron Market-Revenue and Forecast to 2030 (US$ Million)
- Figure 56. Rest of Europe: Direct Reduced Iron Market - Volume and Forecast to 2030 (Kilo Tons)
- Figure 57. Rest of Europe: Direct Reduced Iron Market -Revenue and Forecast to 2030 (US$ Million)
- Figure 58. Asia Pacific: Direct Reduced Iron Market - Volume and Forecast to 2030 (Kilo Tons)
- Figure 59. Asia Pacific: Direct Reduced Iron Market - Revenue and Forecast to 2030 (US$ Million)
- Figure 60. Asia Pacific: Direct Reduced Iron Market Revenue Share, by Form (2022 and 2030)
- Figure 61. Asia Pacific: Direct Reduced Iron Market Revenue Share, by Production Process (2022 and 2030)
- Figure 62. Asia Pacific: Direct Reduced Iron Market Revenue Share, by Application (2022 and 2030)
- Figure 63. Asia Pacific: Direct Reduced Iron Market Revenue Share, by Key Country (2022 and 2030)
- Figure 64. Malaysia: Direct Reduced Iron Market - Volume and Forecast to 2030 (Kilo Tons)
- Figure 65. Malaysia: Direct Reduced Iron Market -Revenue and Forecast to 2030 (US$ Million)
- Figure 66. China: Direct Reduced Iron Market - Volume and Forecast to 2030 (Kilo Tons)
- Figure 67. China: Direct Reduced Iron Market -Revenue and Forecast to 2030 (US$ Million)
- Figure 68. India: Direct Reduced Iron Market - Volume and Forecast to 2030 (Kilo Tons)
- Figure 69. India: Direct Reduced Iron Market -Revenue and Forecast to 2030 (US$ Million)
- Figure 70. Japan: Direct Reduced Iron Market - Volume and Forecast to 2030 (Kilo Tons)
- Figure 71. Japan: Direct Reduced Iron Market -Revenue and Forecast to 2030 (US$ Million)
- Figure 72. South Korea: Direct Reduced Iron Market - Volume and Forecast to 2030 (Kilo Tons)
- Figure 73. South Korea: Direct Reduced Iron Market -Revenue and Forecast to 2030 (US$ Million)
- Figure 74. Rest of Asia Pacific: Direct Reduced Iron Market - Volume and Forecast to 2030 (Kilo Tons)
- Figure 75. Rest of Asia Pacific: Direct Reduced Iron Market -Revenue and Forecast to 2030 (US$ Million)
- Figure 76. Middle East and Africa: Direct Reduced Iron Market -Volume and Forecast to 2030 (Kilo Tons)
- Figure 77. Middle East and Africa: Direct Reduced Iron Market - Revenue and Forecast to 2030 (US$ Million)
- Figure 78. Middle East and Africa: Direct Reduced Iron Market Revenue Share, by Form (2022 and 2030)
- Figure 79. Middle East and Africa: Direct Reduced Iron Market Revenue Share, by Production Process (2022 and 2030)
- Figure 80. Middle East and Africa: Direct Reduced Iron Market Revenue Share, by Application (2022 and 2030)
- Figure 81. Middle East and Africa: Direct Reduced Iron Market Revenue Share, by Key Country (2022 and 2030)
- Figure 82. Iran: Direct Reduced Iron Market -Volume and Forecast to 2030 (Kilo Tons)
- Figure 83. Iran: Direct Reduced Iron Market -Revenue and Forecast to 2030 (US$ Million)
- Figure 84. Saudi Arabia: Direct Reduced Iron Market -Volume and Forecast to 2030 (Kilo Tons)
- Figure 85. Saudi Arabia: Direct Reduced Iron Market -Revenue and Forecast to 2030 (US$ Million)
- Figure 86. UAE: Direct Reduced Iron Market -Volume and Forecast to 2030 (Kilo Tons)
- Figure 87. UAE: Direct Reduced Iron Market -Revenue and Forecast to 2030 (US$ Million)
- Figure 88. Rest of Middle East & Africa: Direct Reduced Iron Market -Volume and Forecast to 2030 (Kilo Tons)
- Figure 89. Rest of Middle East & Africa: Direct Reduced Iron Market -Revenue and Forecast to 2030 (US$ Million)
- Figure 90. South & Central America: Direct Reduced Iron Market -Volume and Forecast to 2030 (Kilo Tons)
- Figure 91. South & Central America: Direct Reduced Iron Market - Revenue and Forecast to 2030 (US$ Million)
- Figure 92. South & Central America: Direct Reduced Iron Market Revenue Share, by Form (2022 and 2030)
- Figure 93. South & Central America: Direct Reduced Iron Market Revenue Share, by Production Process (2022 and 2030)
- Figure 94. South & Central America: Direct Reduced Iron Market Revenue Share, by Application (2022 and 2030)
- Figure 95. South & Central America: Direct Reduced Iron Market Revenue Share, by Key Country (2022 and 2030)
- Figure 96. Brazil: Direct Reduced Iron Market -Volume and Forecast to 2030 (Kilo Tons)
- Figure 97. Brazil: Direct Reduced Iron Market -Revenue and Forecast to 2030 (US$ Million)
- Figure 98. Argentina: Direct Reduced Iron Market -Volume and Forecast to 2030 (Kilo Tons)
- Figure 99. Argentina: Direct Reduced Iron Market -Revenue and Forecast to 2030 (US$ Million)
- Figure 100. Rest of South & Central America: Direct Reduced Iron Market -Volume and Forecast to 2030 (Kilo Tons)
- Figure 101. Rest of South & Central America: Direct Reduced Iron Market -Revenue and Forecast to 2030 (US$ Million)
- Figure 102. Impact of COVID-19 Pandemic on Direct Reduced Iron Market in North America
- Figure 103. Impact of COVID-19 Pandemic on Direct Reduced Iron Market in Europe
- Figure 104. Impact of COVID-19 Pandemic on Direct Reduced Iron Market in Asia Pacific
- Figure 105. Impact of COVID-19 Pandemic on Direct Reduced Iron Market in Middle East & Africa
- Figure 106. Impact of COVID-19 Pandemic on Direct Reduced Iron Market in South & Central America
The direct reduced iron (DRI) market size is expected to grow from US$ 37.36 billion in 2022 to US$ 66.80 billion by 2030; it is estimated to register a CAGR of 7.6% from 2023 to 2030.
Awareness regarding carbon emissions and taking a step ahead in achieving sustainable goals is the primary concern for manufacturing industries. Carbon emissions from manufacturing industries prominently contribute to the greenhouse gas generated throughout the world. According to the World Steel Association, the steel industry generated 3 billion tons of CO2 in 2021. CO2 emissions from the steel industry alone contribute to ~7-9% of overall greenhouse gas emissions, leading to a huge impact on the climate. Various government bodies are taking initiatives to reduce carbon emission levels to achieve a sustainable future. The US administration has launched clean hydrogen initiatives to support sustainable manufacturing, which include low-carbon production of the steel and aluminum needed for electric vehicles, wind turbines, and solar panels. For instance, in May 2023, The U.S. Department of Energy (DOE) announced nearly $42 million in funding for 22 projects in 14 states to advance critical technologies for producing, storing, and deploying clean hydrogen. Further, the Canadian government has introduced Emission Reduction Plan to minimize greenhouse gas emissions and to achieve net zero emissions by 2050. The European Clean Steel Partnership was launched in June 2021, wherein the technology was developed in collaboration to reduce the CO2 emissions from European steel production by 80-95% while maintaining the competitiveness and viability of European steel. Such government initiatives have catalyzed a shift toward carbon-free manufacturing in the steel industry. The hydrogen-based technology for iron-making is one such process for nullifying carbon emissions by replacing coke and fossil fuel in traditional blast furnace-based steelmaking.
Based on application, the direct reduced iron (DRI) market is bifurcated into steel making and construction. The steel making segment held the larger share in 2022. The construction is expected to register the highest CAGR from 2023 to 2030. DRI is distinctive because of its metallic richness and uniform chemical and physical characteristics owing to which it finds applications in the construction and infrastructure industries. DRI is used to produce steel rebars and ingots. The construction industry has undergone massive changes relating to the use of environment-friendly materials in infrastructure projects. However, the industry could take a giant step toward sustainable development by shifting from high-emission steel to near-zero emission steel. Steel produced from DRI is one such initiative to lower the carbon footprint and meet the demands of sustainable construction processes.
In terms of region, the direct reduced iron (DRI) market is segmented into North America, Europe, Asia Pacific (APAC), the Middle East & Africa (MEA), and South & Central America. In 2022, Middle East & Africa held the largest share of the market and is Asia Pacific is estimated to register the highest CAGR from 2023 to 2030. The market growth in this region is mainly attributed to rapid industrialization.
Nucor Corp, Cleveland-Cliffs Inc., Kobe Steel Ltd, Voestalpine AG, Ternium SA, SMS Group GmbH, JSW Steel Ltd, Tenova SpA, Liberty Steel Group Holdings UK Ltd, and Bharat Engineering Works Pvt Ltd. are among the key players operating in the direct reduced iron (DRI) market. These players engage in developing affordable and innovative products to meet the rising customer demands and expand their market share.
The overall direct reduced iron (DRI) market size has been derived using both primary and secondary sources. To begin the research process, exhaustive secondary research has been conducted using internal and external sources to obtain qualitative and quantitative information related to the market. Also, multiple primary interviews have been conducted with industry participants to validate the data and gain more analytical insights into the topic. Participants in this process include VPs, business development managers, market intelligence managers, and national sales managers, along with external consultants such as valuation experts, research analysts, and key opinion leaders, specializing in the direct reduced iron (DRI) market.
Reasons to Buy:
- Save and reduce time carrying out entry-level research by identifying the growth, size, leading players and segments in the global direct reduced iron (DRI) market.
- Highlights key business priorities in order to assist companies to realign their business strategies
- The key findings and recommendations highlight crucial progressive industry trends in the global direct reduced iron (DRI) market, thereby allowing players across the value chain to develop effective long-term strategies
- Develop/modify business expansion plans by using substantial growth offering developed and emerging markets
- Scrutinize in-depth global market trends and outlook coupled with the factors driving the direct reduced iron (DRI) market, as well as those hindering it.
- Enhance the decision-making process by understanding the strategies that underpin commercial interest with respect to client products, segmentation, pricing and distribution
Table Of Contents
1. Introduction
- 1.1 Study Scope
- 1.2 The Insight Partners Research Report Guidance
- 1.3 Market Segmentation
- 1.3.1 Direct Reduced Iron (DRI) Market, by Form
- 1.3.2 Direct Reduced Iron (DRI) Market, by Production Process
- 1.3.3 Direct Reduced Iron (DRI) Market, by Application
- 1.3.4 Direct Reduced Iron (DRI) Market, by Geography
2. Key Takeaways
3. Research Methodology
- 3.1 Scope of the Study
- 3.2 Research Methodology
- 3.2.1 Data Collection:
- 3.2.2 Primary Interviews:
- 3.2.3 Hypothesis formulation:
- 3.2.4 Macro-economic factor analysis:
- 3.2.5 Developing base number:
- 3.2.6 Data Triangulation:
- 3.2.7 Country level data:
4. Direct Reduced Iron (DRI) Market Landscape
- 4.1 Market Overview
- 4.2 Porter's Five Forces Analysis
- 4.2.1 Threat of New Entrants:
- 4.2.2 Bargaining Power of Suppliers:
- 4.2.3 Bargaining Power of Buyers:
- 4.2.4 Competitive Rivalry:
- 4.2.5 Threat of Substitutes:
- 4.3 Ecosystem Analysis
- 4.3.1 Overview:
- 4.3.2 Raw Material Suppliers:
- 4.3.3 Manufacturers
- 4.3.4 Distributors/Suppliers
- 4.3.5 End-Use Industries
- 4.4 Expert Opinion
5. Direct Reduced Iron (DRI) Market - Key Market Dynamics
- 5.1 Market Drivers
- 5.1.1 Rise in Steel Production and Use
- 5.1.2 Expansion of Direct Reduced Iron Plants
- 5.2 Market Restraints
- 5.2.1 Shortage of High-Quality Raw Materials
- 5.3 Market Opportunities
- 5.3.1 Rising Preference for Green Steel Production
- 5.4 Future Trends
- 5.4.1 Initiatives by Various Government Bodies to Lower Carbon Footprint
- 5.5 Impact Analysis
6. Direct Reduced Iron (DRI) - Global Market Analysis
- 6.1 Direct Reduced Iron (DRI) Market Overview
- 6.2 Direct Reduced Iron (DRI) Market -Volume and Forecast to 2030 (Kilo Tons)
- 6.3 Direct Reduced Iron (DRI) Market -Revenue and Forecast to 2030 (US$ Million)
- 6.4 Market Positioning - Key Market Players
7. Global Direct Reduced Iron (DRI) Market Analysis - By Form
- 7.1 Overview
- 7.2 Direct Reduced Iron (DRI) Market, By Form (2022 and 2030)
- 7.3 Lumps
- 7.3.1 Overview
- 7.3.2 Lumps: Direct Reduced Iron (DRI) Market - Volume and Forecast to 2030 (Kilo Tons)
- 7.3.3 Lumps: Direct Reduced Iron (DRI) Market - Revenue and Forecast to 2030 (US$ Million)
- 7.4 Pellets
- 7.4.1 Overview
- 7.4.2 Pellets: Direct Reduced Iron (DRI) Market - Volume and Forecast to 2030 (Kilo Tons)
- 7.4.3 Pellets: Direct Reduced Iron (DRI) Market - Revenue and Forecast to 2030 (US$ Million)
- 7.5 Fine
- 7.5.1 Overview
- 7.5.2 Fine: Direct Reduced Iron (DRI) Market - Volume and Forecast to 2030 (Kilo Tons)
- 7.5.3 Fine: Direct Reduced Iron (DRI) Market - Revenue and Forecast to 2030 (US$ Million)
8. Global Direct Reduced Iron (DRI) Market Analysis - By Production Process
- 8.1 Overview
- 8.2 Direct Reduced Iron (DRI) Market, By Production Process (2022 and 2030)
- 8.3 Coal Based
- 8.3.1 Overview
- 8.3.2 Coal Based: Direct Reduced Iron (DRI) Market - Revenue and Forecast to 2030 (US$ Million)
- 8.4 Gas Based
- 8.4.1 Overview
- 8.4.2 Gas Based: Direct Reduced Iron (DRI) Market - Revenue and Forecast to 2030 (US$ Million)
9. Global Direct Reduced Iron (DRI) Market Analysis - By Application
- 9.1 Overview
- 9.2 Direct Reduced Iron (DRI) Market, By Application (2022 and 2030)
- 9.3 Steel Making
- 9.3.1 Overview
- 9.3.2 Steel Making: Direct Reduced Iron (DRI) Market - Revenue and Forecast to 2030 (US$ Million)
- 9.4 Construction
- 9.4.1 Overview
- 9.4.2 Construction: Direct Reduced Iron (DRI) Market - Revenue and Forecast to 2030 (US$ Million)
10. Global Direct Reduced Iron Market - Geographic Analysis
- 10.1 Overview
- 10.2 North America: Direct Reduced Iron Market
- 10.2.1 North America: Direct Reduced Iron Market -Volume and Forecast to 2030 (Kilo Tons)
- 10.2.2 North America: Direct Reduced Iron Market -Revenue and Forecast to 2030 (US$ Million)
- 10.2.3 North America: Direct Reduced Iron Market, by Form
- 10.2.4 North America: Direct Reduced Iron Market, by Production Process
- 10.2.5 North America: Direct Reduced Iron Market, by Application
- 10.2.6 North America: Direct Reduced Iron Market, by Key Country
- 10.2.6.1 US: Direct Reduced Iron Market -Volume and Forecast to 2030 (Kilo Tons)
- 10.2.6.2 US: Direct Reduced Iron Market -Revenue and Forecast to 2030 (US$ Million)
- 10.2.6.2.1 US: Direct Reduced Iron Market, by Form
- 10.2.6.2.2 US: Direct Reduced Iron Market, by Form
- 10.2.6.2.3 US: Direct Reduced Iron Market, by Production Process
- 10.2.6.2.4 US: Direct Reduced Iron Market, by Application
- 10.2.6.3 Canada: Direct Reduced Iron Market-Volume and Forecast to 2030 (Kilo Tons)
- 10.2.6.4 Canada: Direct Reduced Iron Market-Revenue and Forecast to 2030 (US$ Million)
- 10.2.6.4.1 Canada: Direct Reduced Iron Market, by Form
- 10.2.6.4.2 Canada: Direct Reduced Iron Market, by Form
- 10.2.6.4.3 Canada: Direct Reduced Iron Market, by Production Process
- 10.2.6.4.4 Canada: Direct Reduced Iron Market, by Application
- 10.2.6.5 Mexico: Direct Reduced Iron Market-Volume and Forecast to 2030 (Kilo Tons)
- 10.2.6.6 Mexico: Direct Reduced Iron Market-Revenue and Forecast to 2030 (US$ Million)
- 10.2.6.6.1 Mexico: Direct Reduced Iron Market, by Form
- 10.2.6.6.2 Mexico: Direct Reduced Iron Market, by Form
- 10.2.6.6.3 Mexico: Direct Reduced Iron Market, by Production Process
- 10.2.6.6.4 Mexico: Direct Reduced Iron Market, by Application
- 10.3 Europe: Direct Reduced Iron Market
- 10.3.1 Europe: Direct Reduced Iron Market-Volume and Forecast to 2030 (Kilo Tons)
- 10.3.2 Europe: Direct Reduced Iron Market-Revenue and Forecast to 2030 (US$ Million)
- 10.3.3 Europe: Direct Reduced Iron Market, by Form
- 10.3.4 Europe: Direct Reduced Iron Market, by Production Process
- 10.3.5 Europe: Direct Reduced Iron Market, by Application
- 10.3.6 Europe: Direct Reduced Iron Market, by Key Country
- 10.3.6.1 Germany: Direct Reduced Iron Market-Volume and Forecast to 2030 (Kilo Tons)
- 10.3.6.2 Germany: Direct Reduced Iron Market-Revenue and Forecast to 2030 (US$ Million)
- 10.3.6.2.1 Germany: Direct Reduced Iron Market, by Form
- 10.3.6.2.2 Germany: Direct Reduced Iron Market, by Form
- 10.3.6.2.3 Germany: Direct Reduced Iron Market, by Production Process
- 10.3.6.2.4 Germany: Direct Reduced Iron Market, by Application
- 10.3.6.3 France: Direct Reduced Iron Market-Volume and Forecast to 2030 (Kilo Tons)
- 10.3.6.4 France: Direct Reduced Iron Market-Revenue and Forecast to 2030 (US$ Million)
- 10.3.6.4.1 France: Direct Reduced Iron Market, by Form
- 10.3.6.4.2 France: Direct Reduced Iron Market, by Form
- 10.3.6.4.3 France: Direct Reduced Iron Market, by Production Process
- 10.3.6.4.4 France: Direct Reduced Iron Market, by Application
- 10.3.6.5 Italy: Direct Reduced Iron Market-Volume and Forecast to 2030 (Kilo Tons)
- 10.3.6.6 Italy: Direct Reduced Iron Market-Revenue and Forecast to 2030 (US$ Million)
- 10.3.6.6.1 Italy: Direct Reduced Iron Market, by Form
- 10.3.6.6.2 Italy: Direct Reduced Iron Market, by Form
- 10.3.6.6.3 Italy: Direct Reduced Iron Market, by Production Process
- 10.3.6.6.4 Italy: Direct Reduced Iron Market, by Application
- 10.3.6.7 United Kingdom: Direct Reduced Iron Market-Volume and Forecast to 2030 (Kilo Tons)
- 10.3.6.8 United Kingdom: Direct Reduced Iron Market-Revenue and Forecast to 2030 (US$ Million)
- 10.3.6.8.1 United Kingdom: Direct Reduced Iron Market, by Form
- 10.3.6.8.2 United Kingdom: Direct Reduced Iron Market, by Form
- 10.3.6.8.3 United Kingdom: Direct Reduced Iron Market, by Production Process
- 10.3.6.8.4 United Kingdom: Direct Reduced Iron Market, by Application
- 10.3.6.9 Russia: Direct Reduced Iron Market-Volume and Forecast to 2030 (Kilo Tons)
- 10.3.6.10 Russia: Direct Reduced Iron Market-Revenue and Forecast to 2030 (US$ Million)
- 10.3.6.10.1 Russia: Direct Reduced Iron Market, by Form
- 10.3.6.10.2 Russia: Direct Reduced Iron Market, by Form
- 10.3.6.10.3 Russia: Direct Reduced Iron Market, by Production Process
- 10.3.6.10.4 Russia: Direct Reduced Iron Market, by Application
- 10.3.6.11 Rest of Europe: Direct Reduced Iron Market - Volume and Forecast to 2030 (Kilo Tons)
- 10.3.6.12 Rest of Europe: Direct Reduced Iron Market -Revenue and Forecast to 2030 (US$ Million)
- 10.3.6.12.1 Rest of Europe: Direct Reduced Iron Market, by Form
- 10.3.6.12.2 Rest of Europe: Direct Reduced Iron Market, by Form
- 10.3.6.12.3 Rest of Europe: Direct Reduced Iron Market, by Production Process
- 10.3.6.12.4 Rest of Europe: Direct Reduced Iron Market, by Application
- 10.4 Asia Pacific: Direct Reduced Iron Market
- 10.4.1 Asia Pacific: Direct Reduced Iron Market -Volume and Forecast to 2030 (Kilo Tons)
- 10.4.2 Asia Pacific: Direct Reduced Iron Market -Revenue and Forecast to 2030 (US$ Million)
- 10.4.3 Asia Pacific: Direct Reduced Iron Market, by Form
- 10.4.4 Asia Pacific: Direct Reduced Iron Market, by Production Process
- 10.4.5 Asia Pacific: Direct Reduced Iron Market, by Application
- 10.4.6 Asia Pacific: Direct Reduced Iron Market, by Key Country
- 10.4.6.1 Malaysia: Direct Reduced Iron Market - Volume and Forecast to 2030 (Kilo Tons)
- 10.4.6.2 Malaysia: Direct Reduced Iron Market -Revenue and Forecast to 2030 (US$ Million)
- 10.4.6.2.1 Malaysia: Direct Reduced Iron Market, by Form
- 10.4.6.2.2 Malaysia: Direct Reduced Iron Market, by Form
- 10.4.6.2.3 Malaysia: Direct Reduced Iron Market, by Production Process
- 10.4.6.2.4 Malaysia: Direct Reduced Iron Market, by Application
- 10.4.6.3 China: Direct Reduced Iron Market - Volume and Forecast to 2030 (Kilo Tons)
- 10.4.6.4 China: Direct Reduced Iron Market -Revenue and Forecast to 2030 (US$ Million)
- 10.4.6.4.1 China: Direct Reduced Iron Market, by Form
- 10.4.6.4.2 China: Direct Reduced Iron Market, by Form
- 10.4.6.4.3 China: Direct Reduced Iron Market, by Production Process
- 10.4.6.4.4 China: Direct Reduced Iron Market, by Application
- 10.4.6.5 India: Direct Reduced Iron Market - Volume and Forecast to 2030 (Kilo Tons)
- 10.4.6.6 India: Direct Reduced Iron Market -Revenue and Forecast to 2030 (US$ Million)
- 10.4.6.6.1 India: Direct Reduced Iron Market, by Form
- 10.4.6.6.2 India: Direct Reduced Iron Market, by Form
- 10.4.6.6.3 India: Direct Reduced Iron Market, by Production Process
- 10.4.6.6.4 India: Direct Reduced Iron Market, by Application
- 10.4.6.7 Japan: Direct Reduced Iron Market - Volume and Forecast to 2030 (Kilo Tons)
- 10.4.6.8 Japan: Direct Reduced Iron Market -Revenue and Forecast to 2030 (US$ Million)
- 10.4.6.8.1 Japan: Direct Reduced Iron Market, by Form
- 10.4.6.8.2 Japan: Direct Reduced Iron Market, by Form
- 10.4.6.8.3 Japan: Direct Reduced Iron Market, by Production Process
- 10.4.6.8.4 Japan: Direct Reduced Iron Market, by Application
- 10.4.6.9 South Korea: Direct Reduced Iron Market - Volume and Forecast to 2030 (Kilo Tons)
- 10.4.6.10 South Korea: Direct Reduced Iron Market -Revenue and Forecast to 2030 (US$ Million)
- 10.4.6.10.1 South Korea: Direct Reduced Iron Market, by Form
- 10.4.6.10.2 South Korea: Direct Reduced Iron Market, by Form
- 10.4.6.10.3 South Korea: Direct Reduced Iron Market, by Production Process
- 10.4.6.10.4 South Korea: Direct Reduced Iron Market, by Application
- 10.4.6.11 Rest of Asia Pacific: Direct Reduced Iron Market - Volume and Forecast to 2030 (Kilo Tons)
- 10.4.6.12 Rest of Asia Pacific: Direct Reduced Iron Market -Revenue and Forecast to 2030 (US$ Million)
- 10.4.6.12.1 Rest of Asia Pacific: Direct Reduced Iron Market, by Form
- 10.4.6.12.2 Rest of Asia Pacific: Direct Reduced Iron Market, by Form
- 10.4.6.12.3 Rest of Asia Pacific: Direct Reduced Iron Market, by Production Process
- 10.4.6.12.4 Rest of Asia Pacific: Direct Reduced Iron Market, by Application
- 10.5 Middle East and Africa: Direct Reduced Iron Market
- 10.5.1 Middle East and Africa: Direct Reduced Iron Market -Volume and Forecast to 2030 (Kilo Tons)
- 10.5.2 Middle East and Africa: Direct Reduced Iron Market -Revenue and Forecast to 2030 (US$ Million)
- 10.5.3 Middle East and Africa: Direct Reduced Iron Market, by Form
- 10.5.4 Middle East and Africa: Direct Reduced Iron Market, by Production Process
- 10.5.5 Middle East and Africa: Direct Reduced Iron Market, by Application
- 10.5.6 Middle East and Africa: Direct Reduced Iron Market, by Key Country
- 10.5.6.1 Iran: Direct Reduced Iron Market -Volume and Forecast to 2030 (Kilo Tons)
- 10.5.6.2 Iran: Direct Reduced Iron Market -Revenue and Forecast to 2030 (US$ Million)
- 10.5.6.2.1 Iran: Direct Reduced Iron Market, by Form
- 10.5.6.2.2 Iran: Direct Reduced Iron Market, by Form
- 10.5.6.2.3 Iran: Direct Reduced Iron Market, by Production Process
- 10.5.6.2.4 Iran: Direct Reduced Iron Market, by Application
- 10.5.6.3 Saudi Arabia: Direct Reduced Iron Market -Volume and Forecast to 2030 (Kilo Tons)
- 10.5.6.4 Saudi Arabia: Direct Reduced Iron Market -Revenue and Forecast to 2030 (US$ Million)
- 10.5.6.4.1 Saudi Arabia: Direct Reduced Iron Market, by Form
- 10.5.6.4.2 Saudi Arabia: Direct Reduced Iron Market, by Form
- 10.5.6.4.3 Saudi Arabia: Direct Reduced Iron Market, by Production Process
- 10.5.6.4.4 Saudi Arabia: Direct Reduced Iron Market, by Application
- 10.5.6.5 UAE: Direct Reduced Iron Market -Volume and Forecast to 2030 (Kilo Tons)
- 10.5.6.6 UAE: Direct Reduced Iron Market -Revenue and Forecast to 2030 (US$ Million)
- 10.5.6.6.1 UAE: Direct Reduced Iron Market, by Form
- 10.5.6.6.2 UAE: Direct Reduced Iron Market, by Form
- 10.5.6.6.3 UAE: Direct Reduced Iron Market, by Production Process
- 10.5.6.6.4 UAE: Direct Reduced Iron Market, by Application
- 10.5.6.7 Rest of Middle East & Africa: Direct Reduced Iron Market -Volume and Forecast to 2030 (Kilo Tons)
- 10.5.6.8 Rest of Middle East & Africa: Direct Reduced Iron Market -Revenue and Forecast to 2030 (US$ Million)
- 10.5.6.8.1 Rest of Middle East & Africa: Direct Reduced Iron Market, by Form
- 10.5.6.8.2 Rest of Middle East & Africa: Direct Reduced Iron Market, by Form
- 10.5.6.8.3 Rest of Middle East & Africa: Direct Reduced Iron Market, by Production Process
- 10.5.6.8.4 Rest of Middle East & Africa: Direct Reduced Iron Market, by Application
- 10.6 South & Central America: Direct Reduced Iron Market
- 10.6.1 South & Central America: Direct Reduced Iron Market -Volume and Forecast to 2030 (Kilo Tons)
- 10.6.2 South & Central America: Direct Reduced Iron Market -Revenue and Forecast to 2030 (US$ Million)
- 10.6.3 South & Central America: Direct Reduced Iron Market, by Form
- 10.6.4 South & Central America: Direct Reduced Iron Market, by Production Process
- 10.6.5 South & Central America: Direct Reduced Iron Market, by Application
- 10.6.6 South & Central America: Direct Reduced Iron Market, by Key Country
- 10.6.6.1 Brazil: Direct Reduced Iron Market -Volume and Forecast to 2030 (Kilo Tons)
- 10.6.6.2 Brazil: Direct Reduced Iron Market -Revenue and Forecast to 2030 (US$ Million)
- 10.6.6.2.1 Brazil: Direct Reduced Iron Market, by Form
- 10.6.6.2.2 Brazil: Direct Reduced Iron Market, by Form
- 10.6.6.2.3 Brazil: Direct Reduced Iron Market, by Production Process
- 10.6.6.2.4 Brazil: Direct Reduced Iron Market, by Application
- 10.6.6.3 Argentina: Direct Reduced Iron Market -Volume and Forecast to 2030 (Kilo Tons)
- 10.6.6.4 Argentina: Direct Reduced Iron Market -Revenue and Forecast to 2030 (US$ Million)
- 10.6.6.4.1 Argentina: Direct Reduced Iron Market, by Form
- 10.6.6.4.2 Argentina: Direct Reduced Iron Market, by Form
- 10.6.6.4.3 Argentina: Direct Reduced Iron Market, by Production Process
- 10.6.6.4.4 Argentina: Direct Reduced Iron Market, by Application
- 10.6.6.5 Rest of South & Central America: Direct Reduced Iron Market -Volume and Forecast to 2030 (Kilo Tons)
- 10.6.6.6 Rest of South & Central America: Direct Reduced Iron Market -Revenue and Forecast to 2030 (US$ Million)
- 10.6.6.6.1 Rest of South & Central America: Direct Reduced Iron Market, by Form
- 10.6.6.6.2 Rest of South & Central America: Direct Reduced Iron Market, by Form
- 10.6.6.6.3 Rest of South & Central America: Direct Reduced Iron Market, by Production Process
- 10.6.6.6.4 Rest of South & Central America: Direct Reduced Iron Market, by Application
11. Impact of COVID-19 Pandemic on Direct Reduced Iron Market
- 11.1 Overview
- 11.2 Impact of COVID-19 on Direct Reduced Iron Market
- 11.3 North America: Impact Assessment of COVID-19 Pandemic
- 11.4 Europe: Impact Assessment of COVID-19 Pandemic
- 11.5 Asia Pacific: Impact Assessment of COVID-19 Pandemic
- 11.6 Middle East & Africa: Impact Assessment of COVID-19 Pandemic
- 11.7 South & Central America: Impact Assessment of COVID-19 Pandemic
12. Industry Landscape
- 12.1 Overview
- 12.2 Merger and Acquisition
13. Company Profiles
- 13.1 Nucor Corp
- 13.1.1 Key Facts
- 13.1.2 Business Description
- 13.1.3 Products and Services
- 13.1.4 Financial Overview
- 13.1.5 SWOT Analysis
- 13.1.6 Key Developments
- 13.2 Cleveland-Cliffs Inc
- 13.2.1 Key Facts
- 13.2.2 Business Description
- 13.2.3 Products and Services
- 13.2.4 Financial Overview
- 13.2.5 SWOT Analysis
- 13.2.6 Key Developments
- 13.3 Kobe Steel Ltd
- 13.3.1 Key Facts
- 13.3.2 Business Description
- 13.3.3 Products and Services
- 13.3.4 Financial Overview
- 13.3.5 SWOT Analysis
- 13.3.6 Key Developments
- 13.4 SMS Group GmbH
- 13.4.1 Key Facts
- 13.4.2 Business Description
- 13.4.3 Products and Services
- 13.4.4 Financial Overview
- 13.4.5 SWOT Analysis
- 13.4.6 Key Developments
- 13.5 Voestalpine AG
- 13.5.1 Key Facts
- 13.5.2 Business Description
- 13.5.3 Products and Services
- 13.5.4 Financial Overview
- 13.5.5 SWOT Analysis
- 13.5.6 Key Developments
- 13.6 Ternium SA
- 13.6.1 Key Facts
- 13.6.2 Business Description
- 13.6.3 Products and Services
- 13.6.4 Financial Overview
- 13.6.5 SWOT Analysis
- 13.6.6 Key Developments
- 13.7 JSW Steel Ltd
- 13.7.1 Key Facts
- 13.7.2 Business Description
- 13.7.3 Products and Services
- 13.7.4 Financial Overview
- 13.7.5 SWOT Analysis
- 13.7.6 Key Developments
- 13.8 Tenova SpA
- 13.8.1 Key Facts
- 13.8.2 Business Description
- 13.8.3 Products and Services
- 13.8.4 Financial Overview
- 13.8.5 SWOT Analysis
- 13.8.6 Key Developments
- 13.9 Liberty Steel Group Holdings UK Ltd
- 13.9.1 Key Facts
- 13.9.2 Business Description
- 13.9.3 Products and Services
- 13.9.4 Financial Overview
- 13.9.5 SWOT Analysis
- 13.9.6 Key Developments
- 13.10 Bharat Engineering Works Pvt Ltd
- 13.10.1 Key Facts
- 13.10.2 Business Description
- 13.10.3 Products and Services
- 13.10.4 Financial Overview
- 13.10.5 SWOT Analysis
- 13.10.6 Key Developments
14. Appendix
- 14.1 About The Insight Partners
- 14.2 Glossary of Terms