|
|
市場調査レポート
商品コード
1280770
活性炭の2028年までの市場予測-タイプ別、アプリケーション別の世界分析Activated Carbon Market Forecast to 2028 - Global Analysis by Type and Application |
||||||
|
|
|||||||
|
|||||||


| 活性炭の2028年までの市場予測-タイプ別、アプリケーション別の世界分析 |
|
出版日: 2023年05月09日
発行: The Insight Partners
ページ情報: 英文 243 Pages
納期: 即納可能
|

- 全表示
- 概要
- 図表
- 目次
活性炭の市場規模は、2022年の38億4,546万米ドルから2028年には60億8,105万米ドルに成長すると予想され、2023年から2028年までのCAGRは8.2%を記録すると推定されています。
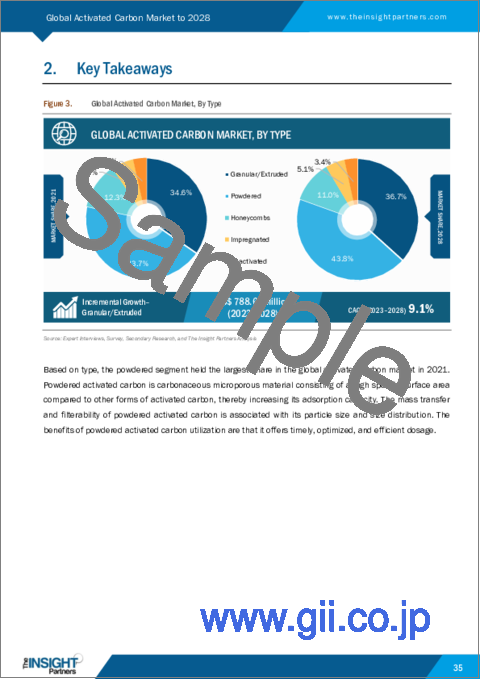
活性炭の世界市場は、タイプ別に、粒状/押出し、粉末、ハニカム、含浸、再活性に分類されます。2022年には、粉末セグメントが最大の市場シェアを占めています。粒状/押出成形セグメントは、予測期間中、世界の活性炭市場で最も高いCAGRを記録すると推定されます。粒状活性炭は、天然有機物、揮発性有機化合物、汚染物質を除去するための脱臭アプリケーションの気相および液相に利用されます。粒状活性炭は、構造強度、再生特性、クリーンな取り扱いなどの特性や、使用済み活性炭の回収が可能であることから、ますます使用されています。ガス・空気分野は、予測期間中、世界の活性炭市場で最も高いCAGRを記録すると予測されています。活性炭は、石油化学工場、埋立地、製造業、化学処理施設において、揮発性有機化合物などの有害汚染物質をろ過するための産業用空気処理に広く使用されています。
活性炭の世界市場は、アプリケーション別に、ガス・空気、自動車、触媒、化学、飲食品、鉱業、医薬品、水処理、その他の活動に分類されます。2022年には、水処理分野が最大の市場シェアを占めています。活性炭は、廃水の三次処理や廃水処理の様々な段階で広く使用されています。廃水は、化学的酸素要求量(COD)、毒素、全有機炭素、生物学的酸素要求量(BOD)、炭化水素、農薬、シアン化物、その他の有害化学物質の存在など、さまざまなパラメータについて検査および処理されます。活性炭は、過去数年間にわたり、サービス水処理、地下水再生、飲料水処理に広く使用されてきました。
2022年の世界の活性炭市場シェアは、アジア太平洋地域が最も大きな部分を占めています。中国とインドがアジア太平洋の活性炭市場の成長に大きく寄与しています。欧州化学工業評議会によると、世界の化学品販売に占める中国のシェアは、2011年に報告された28.3%から、2021年には43.0%に増加しました。様々な化学物質への要求の増加とそれに伴う化学物質の生産量の増加が、化学物質の精製および処理用の活性炭の需要を押し上げると予想されます。さらに、中国では水処理施設や設備の設置が増加しており、同国の活性炭市場を牽引しています。活性炭は、ベンゼン、トルエン、エチルベンゼン、キシレン、有機化合物など、粒子径の小さな化合物を大量に吸着するために使用されています。さらに、インドでは、飲食品、水処理、空気・ガス、化学などの産業が堅調に推移しており、活性炭市場の成長を後押ししています。
大阪ガス株式会社、Haycarb PLC、Kureha Corp、Donau Chemie AG、Activated Carbon Technologies Pty Ltd、Albemarle Corp、CPL Activated Carbons、James Cumming and Sons Pty Ltd、Ingevity Corp、Norit Nederland BVなどは、世界の活性炭市場で活動しているいくつかの企業です。市場関係者は、顧客の需要を満たすために高品質の製品を提供することに重点を置いています。また、研究開発活動への投資、新製品の発売、提携、M&Aなどの戦略も採用しています。
世界の活性炭市場全体の規模は、一次情報と二次情報の両方を使用して導き出されました。調査プロセスを開始するにあたり、市場に関連する質的・量的情報を得るために、社内外の情報源を用いて徹底的な二次調査を実施しました。また、データを検証し、このテーマについてより分析的な洞察を得るために、業界関係者に複数の一次インタビューを実施しました。このプロセスの参入企業には、副社長、市場開拓マネージャー、マーケットインテリジェンスマネージャー、国内営業マネージャーなどの業界専門家と、活性炭市場を専門とする評価専門家、研究アナリスト、キーオピニオンリーダーなどの外部コンサルタントを含みます。
目次
第1章 イントロダクション
第2章 重要なポイント
第3章 調査手法
- 調査対象範囲
- 調査手法
- データ収集
- 一次インタビュー
- 仮説の策定
- マクロ経済的要因分析
- ベースナンバーの作成
- データの三角測量
- 国レベルのデータ
第4章 エグゼクティブサマリー
- エグゼクティブサマリー
第5章 活性炭市場に影響を与える要因
- 世界の廃水処理の展望
- 技術動向
- 規制
- サステナビリティへの取り組み
第6章 活性炭の世界市場分析
- 活性炭の世界市場-2028年までの数量と予測(キロトン)
- 価格動向分析、タイプ別、2022年
- 活性炭のメーカー一覧
- 市場の位置づけ-活性炭の市場参入企業
第7章 活性炭の世界市場分析- タイプ別
- 活性炭の世界市場、タイプ別(2021年、2028年)
- 粒状/押出し
- 粉体
- ハニカム
- 含浸
- 再活性化
第8章 活性炭の世界市場分析-アプリケーション別
- 活性炭の世界市場:アプリケーション別(2021年、2028年)
- ガス・空気
- 自動車用
- 触媒
- 化学品
- 飲食品
- 鉱業
- 医薬
- 水処理
- その他
第9章 活性炭の世界市場-地域分析
- 北米
- 過去の動向
- 米国
- カナダ
- メキシコ
- 西欧
- ドイツ
- フランス
- イタリア
- 英国
- スペイン
- ベルギー
- オランダ
- その他欧州
- 東欧
- ロシア
- ポーランド
- その他東欧諸国
- アジア太平洋地域
- オーストラリア
- 中国
- インド
- 日本
- 韓国
- ベトナム
- パキスタン
- インドネシア
- 台湾
- その他アジア太平洋地域
- 中東・アフリカ地域
- トルコ
- サウジアラビア
- その他中東とアフリカ
- 中南米地域
- ブラジル
- その他中南米地域
第10章 COVID-19パンデミックが活性炭の世界市場に与える影響
- 概要-COVID-19パンデミック別影響
- COVID-19の活性炭市場への影響
- 北米
- 欧州
- アジア太平洋
- 中東・アフリカ地域
- 南米
第11章 業界情勢
第12章 企業プロファイル
- Osaka Gas Chemical Co. Ltd
- KURARAY CO., LTD.
- HAYCARB(PVT)LTD.
- KUREHA CORPORATION
- CABOT CORPORATION
第13章 付録
List Of Tables
- Table 1. Global Activated Carbon Market -Volume and Forecast to 2028 (Kilo Tons)
- Table 2. Global Activated Carbon Market -Revenue and Forecast to 2028 (US$ Million)
- Table 3. Global Activated Carbon Market, by Type - Volume and Forecast to 2028 (Kilo Tons)
- Table 4. Global Activated Carbon Market, by Type - Revenue and Forecast to 2028 (US$ Million)
- Table 5. Global Activated Carbon Market, by Application - Volume and Forecast to 2028 (Kilo Tons)
- Table 6. Global Activated Carbon Market, by Application - Revenue and Forecast to 2028 (US$ Million)
- Table 7. North America Activated Carbon Market, by Type - Volume and Forecast to 2028 (Kilo Tons)
- Table 8. North America Activated Carbon Market, by Type - Revenue and Forecast to 2028 (US$ Million)
- Table 9. North America Activated Carbon Market, by Application- Volume and Forecast to 2028 (Kilo Tons)
- Table 10. North America Activated Carbon Market, by Application- Revenue and Forecast to 2028 (US$ Million)
- Table 11. North America Activated Carbon Market, by Country - Volume (Kilo Tons)
- Table 12. North America Activated Carbon Market, by Country - Revenue (US$ Million)
- Table 13. US Activated Carbon Market, by Type - Volume and Forecast to 2028 (Kilo Tons)
- Table 14. US Activated Carbon Market, by Type - Revenue and Forecast to 2028 (US$ Million)
- Table 15. US Activated Carbon Market, by Application - Volume and Forecast to 2028 (Kilo Tons)
- Table 16. US Activated Carbon Market, by Application - Revenue and Forecast to 2028 (US$ Million)
- Table 17. Canada: Activated Carbon Market, by Type - Volume and Forecast to 2028 (Kilo Tons)
- Table 18. Canada: Activated Carbon Market, by Type - Revenue and Forecast to 2028 (US$ Million)
- Table 19. Canada Activated Carbon Market, by Application - Volume and Forecast to 2028 (Kilo Tons)
- Table 20. Canada Activated Carbon Market, by Application - Revenue and Forecast to 2028 (US$ Million)
- Table 21. Mexico Activated Carbon Market, by Type - Volume and Forecast to 2028 (Kilo Tons)
- Table 22. Mexico Activated Carbon Market, by Type - Revenue and Forecast to 2028 (US$ Million)
- Table 23. Mexico Activated Carbon Market, by Application - Volume and Forecast to 2028 (Kilo Tons)
- Table 24. Mexico Activated Carbon Market, by Application - Revenue and Forecast to 2028 (US$ Million)
- Table 25. Western Europe Activated Carbon Market, by Type - Volume and Forecast to 2028 (Kilo Tons)
- Table 26. Western Europe Activated Carbon Market, by Type - Revenue and Forecast to 2028 (US$ Million)
- Table 27. Western Europe Activated Carbon Market, by Application - Volume and Forecast to 2028 (Kilo Tons)
- Table 28. Western Europe Activated Carbon Market, by Application - Revenue and Forecast to 2028 (US$ Million)
- Table 29. Western Europe Activated Carbon Market, by Country - Volume (Kilo Tons)
- Table 30. Western Europe Activated Carbon Market, by Country - Revenue (USD Million)
- Table 31. Germany Activated Carbon Market, by Type - Volume and Forecast to 2028 (Kilo Tons)
- Table 32. Germany Activated Carbon Market, by Type - Revenue and Forecast to 2028 (US$ Million)
- Table 33. Germany Activated Carbon Market, by Application - Volume and Forecast to 2028 (Kilo Tons)
- Table 34. Germany Activated Carbon Market, by Application - Revenue and Forecast to 2028 (US$ Million)
- Table 35. France Activated Carbon Market, by Type - Volume and Forecast to 2028 (Kilo Tons)
- Table 36. France Activated Carbon Market, by Type - Revenue and Forecast to 2028 (US$ Million)
- Table 37. France Activated Carbon Market, by Application - Volume and Forecast to 2028 (Kilo Tons)
- Table 38. France Activated Carbon Market, by Application - Revenue and Forecast to 2028 (US$ Million)
- Table 39. Italy Activated Carbon Market, by Type - Volume and Forecast to 2028 (Kilo Tons)
- Table 40. Italy Activated Carbon Market, by Type - Revenue and Forecast to 2028 (US$ Million)
- Table 41. Italy Activated Carbon Market, by Application - Volume and Forecast to 2028 (Kilo Tons)
- Table 42. Italy Activated Carbon Market, by Application - Revenue and Forecast to 2028 (US$ Million)
- Table 43. United Kingdom Activated Carbon Market, by Type - Volume and Forecast to 2028 (Kilo Tons)
- Table 44. United Kingdom Activated Carbon Market, by Type - Revenue and Forecast to 2028 (US$ Million)
- Table 45. United Kingdom Activated Carbon Market, by Application - Volume and Forecast to 2028 (Kilo Tons)
- Table 46. United Kingdom Activated Carbon Market, by Application - Revenue and Forecast to 2028 (US$ Million)
- Table 47. Spain: Activated Carbon Market, by Type- Volume and Forecast to 2028 (Kilo Tons)
- Table 48. Spain: Activated Carbon Market, by Type- Revenue and Forecast to 2028 (US$ Million)
- Table 49. Spain : Activated Carbon Market, by Application - Volume and Forecast to 2028 (Kilo Tons)
- Table 50. Spain: Activated Carbon Market, by Application - Revenue and Forecast to 2028 (US$ Million)
- Table 51. Belgium Activated Carbon Market, by Type - Volume and Forecast to 2028 (Kilo Tons)
- Table 52. Belgium Activated Carbon Market, by Type - Revenue and Forecast to 2028 (US$ Million)
- Table 53. Belgium Activated Carbon Market, by Application - Volume and Forecast to 2028 (Kilo Tons)
- Table 54. Belgium Activated Carbon Market, by Application - Revenue and Forecast to 2028 (US$ Million)
- Table 55. Netherlands Activated Carbon Market, by Type - Volume and Forecast to 2028 (Kilo Tons)
- Table 56. Netherlands Activated Carbon Market, by Type - Revenue and Forecast to 2028 (US$ Million)
- Table 57. Netherlands Activated Carbon Market, by Application - Volume and Forecast to 2028 (Kilo Tons)
- Table 58. Netherlands Activated Carbon Market, by Application - Revenue and Forecast to 2028 (US$ Million)
- Table 59. Rest of Western Europe Activated Carbon Market, by Type - Volume and Forecast to 2028 (Kilo Tons)
- Table 60. Rest of Western Europe Activated Carbon Market, by Type - Revenue and Forecast to 2028 (US$ Million)
- Table 61. Rest of Western Europe: Activated Carbon Market, by Application - Volume and Forecast to 2028 (Kilo Tons)
- Table 62. Rest of Western Europe: Activated Carbon Market, by Application - Revenue and Forecast to 2028 (US$ Million)
- Table 63. Eastern Europe: Activated Carbon Market, by Type- Volume and Forecast to 2028 (Kilo Tons)
- Table 64. Eastern Europe: Activated Carbon Market, by Type- Revenue and Forecast to 2028 (US$ Million)
- Table 65. Eastern Europe: Activated Carbon Market, by Application - Volume and Forecast to 2028 (Kilo Tons)
- Table 66. Eastern Europe: Activated Carbon Market, by Application - Revenue and Forecast to 2028 (US$ Million)
- Table 67. Eastern Europe Activated Carbon Market, by Country - Volume (Kilo Tons)
- Table 68. Eastern Europe Activated Carbon Market, by Country - Revenue (US$ Million)
- Table 69. Russia: Activated Carbon Market, by Type - Volume and Forecast to 2028 (Kilo Tons)
- Table 70. Russia: Activated Carbon Market, by Type - Revenue and Forecast to 2028 (US$ Million)
- Table 71. Russia: Activated Carbon Market, by Application - Volume and Forecast to 2028 (Kilo Tons)
- Table 72. Russia: Activated Carbon Market, by Application - Revenue and Forecast to 2028 (US$ Million)
- Table 73. Poland: Activated Carbon Market, by Type - Volume and Forecast to 2028 (Kilo Tons)
- Table 74. Poland: Activated Carbon Market, by Type - Revenue and Forecast to 2028 (US$ Million)
- Table 75. Poland: Activated Carbon Market, by Application - Volume and Forecast to 2028 (Kilo Tons)
- Table 76. Poland: Activated Carbon Market, by Application - Revenue and Forecast to 2028 (US$ Million)
- Table 77. Rest of Eastern Europe: Activated Carbon Market, by Type - Volume and Forecast to 2028 (Kilo Tons)
- Table 78. Rest of Eastern Europe: Activated Carbon Market, by Type - Revenue and Forecast to 2028 (US$ Million)
- Table 79. Rest of Eastern Europe: Activated Carbon Market, by Application - Volume and Forecast to 2028 (Kilo Tons)
- Table 80. Rest of Eastern Europe: Activated Carbon Market, by Application - Revenue and Forecast to 2028 (US$ Million)
- Table 81. Asia Pacific Activated Carbon Market, by Type - Volume and Forecast to 2028 (Kilo Tons)
- Table 82. Asia Pacific Activated Carbon Market, by Type - Revenue and Forecast to 2028 (US$ Million)
- Table 83. Asia Pacific Activated Carbon Market, by Application - Volume and Forecast to 2028 (Kilo Tons)
- Table 84. Asia Pacific Activated Carbon Market, by Application - Revenue and Forecast to 2028 (US$ Million)
- Table 85. Asia Pacific Activated Carbon Market, by Country - Volume (Kilo Tons)
- Table 86. Asia Pacific Activated Carbon Market, by Country - Revenue (US$ Million)
- Table 87. Australia Activated Carbon Market, by Type- Volume and Forecast to 2028 (Kilo Tons)
- Table 88. Australia Activated Carbon Market, by Type- Revenue and Forecast to 2028 (US$ Million)
- Table 89. Australia Activated Carbon Market, by Application - Volume and Forecast to 2028 (Kilo Tons)
- Table 90. Australia Activated Carbon Market, by Application - Revenue and Forecast to 2028 (US$ Million)
- Table 91. China Activated Carbon Market, by Type - Volume and Forecast to 2028 (Kilo Tons)
- Table 92. China Activated Carbon Market, by Type - Revenue and Forecast to 2028 (US$ Million)
- Table 93. China Activated Carbon Market, by Application - Volume and Forecast to 2028 (Kilo Tons)
- Table 94. China Activated Carbon Market, by Application - Revenue and Forecast to 2028 (US$ Million)
- Table 95. India Activated Carbon Market, by Type - Volume and Forecast to 2028 (Kilo Tons)
- Table 96. India Activated Carbon Market, by Type - Revenue and Forecast to 2028 (US$ Million)
- Table 97. India Activated Carbon Market, by Application - Volume and Forecast to 2028 (Kilo Tons)
- Table 98. India Activated Carbon Market, by Application - Revenue and Forecast to 2028 (US$ Million)
- Table 99. Japan Activated Carbon Market, by Type - Volume and Forecast to 2028 (Kilo Tons)
- Table 100. Japan Activated Carbon Market, by Type - Revenue and Forecast to 2028 (US$ Million)
- Table 101. Japan Activated Carbon Market, by Application - Volume and Forecast to 2028 (Kilo Tons)
- Table 102. Japan Activated Carbon Market, by Application - Revenue and Forecast to 2028 (US$ Million)
- Table 103. South Korea Activated Carbon Market, by Type - Volume and Forecast to 2028 (Kilo Tons)
- Table 104. South Korea Activated Carbon Market, by Type - Revenue and Forecast to 2028 (US$ Million)
- Table 105. South Korea Activated Carbon Market, by Application - Volume and Forecast to 2028 (Kilo Tons)
- Table 106. South Korea Activated Carbon Market, by Application - Revenue and Forecast to 2028 (US$ Million)
- Table 107. Vietnam: Activated Carbon Market, by Type - Volume and Forecast to 2028 (Kilo Tons)
- Table 108. Vietnam: Activated Carbon Market, by Type - Revenue and Forecast to 2028 (US$ Million)
- Table 109. Vietnam: Activated Carbon Market, by Application - Volume and Forecast to 2028 (Kilo Tons)
- Table 110. Vietnam: Activated Carbon Market, by Application - Revenue and Forecast to 2028 (US$ Million)
- Table 111. Pakistan: Activated Carbon Market, by Type - Volume and Forecast to 2028 (Kilo Tons)
- Table 112. Pakistan: Activated Carbon Market, by Type - Revenue and Forecast to 2028 (US$ Million)
- Table 113. Pakistan: Activated Carbon Market, by Application - Volume and Forecast to 2028 (Kilo Tons)
- Table 114. Pakistan: Activated Carbon Market, by Application - Revenue and Forecast to 2028 (US$ Million)
- Table 115. Indonesia: Activated Carbon Market, by Type - Volume and Forecast to 2028 (Kilo Tons)
- Table 116. Indonesia: Activated Carbon Market, by Type - Revenue and Forecast to 2028 (US$ Million)
- Table 117. Indonesia: Activated Carbon Market, by Application - Volume and Forecast to 2028 (Kilo Tons)
- Table 118. Indonesia: Activated Carbon Market, by Application - Revenue and Forecast to 2028 (US$ Million)
- Table 119. Taiwan: Activated Carbon Market, by Type - Volume and Forecast to 2028 (Kilo Tons)
- Table 120. Taiwan: Activated Carbon Market, by Type - Revenue and Forecast to 2028 (US$ Million)
- Table 121. Taiwan: Activated Carbon Market, by Application - Volume and Forecast to 2028 (Kilo Tons)
- Table 122. Taiwan: Activated Carbon Market, by Application - Revenue and Forecast to 2028 (US$ Million)
- Table 123. Rest of Asia Pacific Activated Carbon Market, by Type - Volume and Forecast to 2028 (Kilo Tons)
- Table 124. Rest of Asia Pacific Activated Carbon Market, by Type - Revenue and Forecast to 2028 (US$ Million)
- Table 125. Rest of Asia Pacific Activated Carbon Market, by Application - Volume and Forecast to 2028 (Kilo Tons)
- Table 126. Rest of Asia Pacific Activated Carbon Market, by Application - Revenue and Forecast to 2028 (US$ Million)
- Table 127. Middle East & Africa Activated Carbon Market, by Type- Volume and Forecast to 2028 (Kilo Tons)
- Table 128. Middle East & Africa Activated Carbon Market, by Type- Revenue and Forecast to 2028 (US$ Million)
- Table 129. Middle East & Africa Activated Carbon Market, by Application - Volume and Forecast to 2028 (Kilo Tons)
- Table 130. Middle East & Africa Activated Carbon Market, by Application - Revenue and Forecast to 2028 (US$ Million)
- Table 131. Middle East and Africa Activated Carbon Market, by Country - Volume (Kilo Tons)
- Table 132. Middle East and Africa Activated Carbon Market, by Country - Revenue (US$ Million)
- Table 133. Turkey: Activated Carbon Market, by Type - Volume and Forecast to 2028 (Kilo Tons)
- Table 134. Turkey: Activated Carbon Market, by Type - Revenue and Forecast to 2028 (US$ Million)
- Table 135. Turkey: Activated Carbon Market, by Application - Volume and Forecast to 2028 (Kilo Tons)
- Table 136. Turkey: Activated Carbon Market, by Application - Revenue and Forecast to 2028 (US$ Million)
- Table 137. Saudi Arabia Activated Carbon Market, by Type - Volume and Forecast to 2028 (Kilo Tons)
- Table 138. Saudi Arabia Activated Carbon Market, by Type - Revenue and Forecast to 2028 (US$ Million)
- Table 139. Saudi Arabia Activated Carbon Market, by Application - Volume and Forecast to 2028 (Kilo Tons)
- Table 140. Saudi Arabia Activated Carbon Market, by Application - Revenue and Forecast to 2028 (US$ Million)
- Table 141. Rest of Middle East & Africa Activated Carbon Market, by Type - Volume and Forecast to 2028 (Kilo Tons)
- Table 142. Rest of Middle East & Africa Activated Carbon Market, by Type - Revenue and Forecast to 2028 (US$ Million)
- Table 143. Rest of Middle East & Africa Activated Carbon Market, by Application - Volume and Forecast to 2028 (Kilo Tons)
- Table 144. Rest of Middle East & Africa Activated Carbon Market, by Application - Revenue and Forecast to 2028 (US$ Million)
- Table 145. South & Central America Activated Carbon Market, by Type - Volume and Forecast to 2028 (Kilo Tons)
- Table 146. South & Central America Activated Carbon Market, by Type - Revenue and Forecast to 2028 (US$ Million)
- Table 147. South & Central America Activated Carbon Market, by Application - Volume and Forecast to 2028 (Kilo Tons)
- Table 148. South & Central America Activated Carbon Market, by Application - Revenue and Forecast to 2028 (US$ Million)
- Table 149. South and Central America Activated Carbon Market, by Country - Volume (Kilo Tons)
- Table 150. South and Central America Activated Carbon Market, by Country - Revenue (US$ Million)
- Table 151. Brazil Activated Carbon Market, by Type - Volume and Forecast to 2028 (Kilo Tons)
- Table 152. Brazil Activated Carbon Market, by Type - Revenue and Forecast to 2028 (US$ Million)
- Table 153. Brazil Activated Carbon Market, by Application - Volume and Forecast to 2028 (Kilo Tons)
- Table 154. Brazil Activated Carbon Market, by Application - Revenue and Forecast to 2028 (US$ Million)
- Table 155. Rest of South & Central America Activated Carbon Market, by Type - Volume and Forecast to 2028 (Kilo Tons)
- Table 156. Rest of South & Central America Activated Carbon Market, by Type - Revenue and Forecast to 2028 (US$ Million)
- Table 157. Rest of South & Central America Activated Carbon Market, by Application - Volume and Forecast to 2028 (Kilo Tons)
- Table 158. Rest of South & Central America Activated Carbon Market, by Application - Revenue and Forecast to 2028 (US$ Million)
- Table 159. Glossary of Terms, Global Activated Carbon Market
List Of Figures
- Figure 1. Global Activated Carbon Market Segmentation
- Figure 2. Global Activated Carbon Market Segmentation - By Geography
- Figure 3. Global Activated Carbon Market, By Type
- Figure 4. Global Activated Carbon Market, by Geography
- Figure 5. Global Activated Carbon Market, Industry Landscape
- Figure 6. Global Activated Carbon Market - Volume and Forecast to 2028 (Kilo Tons)
- Figure 7. Global Activated Carbon Market - Revenue and Forecast to 2028 (US$ Million)
- Figure 8. Price Trend Analysis, by Type, 2022 (US$/ Ton)
- Figure 9. Global Activated Carbon Market Revenue Share, By Type (2021 and 2028)
- Figure 10. Granular/Extruded: Activated Carbon Market - Volume and Forecast To 2028 (Kilo Tons)
- Figure 11. Granular/Extruded: Activated Carbon Market - Revenue and Forecast To 2028 (US$ Million)
- Figure 12. Powdered : Activated Carbon Market - Volume and Forecast To 2028 (Kilo Tons)
- Figure 13. Powdered : Activated Carbon Market - Revenue and Forecast To 2028 (US$ Million)
- Figure 14. Honeycombs: Activated Carbon Market - Volume and Forecast To 2028 (Kilo Tons)
- Figure 15. Honeycombs: Activated Carbon Market - Revenue and Forecast To 2028 (US$ Million)
- Figure 16. Impregnated: Activated Carbon Market - Volume and Forecast To 2028 (Kilo Tons)
- Figure 17. Impregnated: Activated Carbon Market - Revenue and Forecast To 2028 (US$ Million)
- Figure 18. Reactivated: Activated Carbon Market - Volume and Forecast To 2028 (Kilo Tons)
- Figure 19. Reactivated: Activated Carbon Market - Revenue and Forecast To 2028 (US$ Million)
- Figure 20. Global Activated Carbon Market Revenue Share, By Application (2021 and 2028)
- Figure 21. Gas and Air: Activated Carbon Market - Volume and Forecast To 2028 (Kilo Tons)
- Figure 22. Gas and Air: Activated Carbon Market - Revenue and Forecast To 2028 (US$ Million)
- Figure 23. Automotive: Activated Carbon Market - Volume and Forecast To 2028 (Kilo Tons)
- Figure 24. Automotive: Activated Carbon Market - Revenue and Forecast To 2028 (US$ Million)
- Figure 25. Catalyst: Activated Carbon Market - Volume and Forecast To 2028 (Kilo Tons)
- Figure 26. Catalyst: Activated Carbon Market - Revenue and Forecast To 2028 (US$ Million)
- Figure 27. Chemicals: Activated Carbon Market - Volume and Forecast To 2028 (Kilo Tons)
- Figure 28. Chemicals: Activated Carbon Market - Revenue and Forecast To 2028 (US$ Million)
- Figure 29. Food and Beverage: Activated Carbon Market - Volume and Forecast To 2028 (Kilo Tons)
- Figure 30. Food and Beverage: Activated Carbon Market - Revenue and Forecast To 2028 (US$ Million)
- Figure 31. Mining; Activated Carbon Market - Volume and Forecast To 2028 (Kilo Tons)
- Figure 32. Mining: Activated Carbon Market - Revenue and Forecast To 2028 (US$ Million)
- Figure 33. Pharmaceuticals: Activated Carbon Market - Volume and Forecast To 2028 (Kilo Tons)
- Figure 34. Pharmaceuticals: Activated Carbon Market - Revenue and Forecast To 2028 (US$ Million)
- Figure 35. Water Treatment: Activated Carbon Market - Volume and Forecast To 2028 (Kilo Tons)
- Figure 36. Water Treatment: Activated Carbon Market - Revenue and Forecast To 2028 (US$ Million)
- Figure 37. Others: Activated Carbon Market - Volume and Forecast To 2028 (Kilo Tons)
- Figure 38. Others: Activated Carbon Market - Revenue and Forecast To 2028 (US$ Million)
- Figure 39. Global Activated Carbon Market Revenue Share, by Region (2021 and 2028)
- Figure 40. North America: Activated Carbon Market -Volume and Forecast to 2028 (Kilo Tons)
- Figure 41. North America: Activated Carbon Market - Revenue and Forecast to 2028 (US$ Million)
- Figure 42. North America: Activated Carbon Market Revenue Share, by Type (2021 and 2028)
- Figure 43. North America: Activated Carbon Market Revenue Share, by Application (2021 and 2028)
- Figure 44. North America: Activated Carbon Market Revenue Share, by Key Country (2021 and 2028)
- Figure 45. US: Activated Carbon Market -Volume and Forecast to 2028 (Kilo Tons)
- Figure 46. US: Activated Carbon Market -Revenue and Forecast to 2028 (US$ Million)
- Figure 47. Canada: Activated Carbon Market-Volume and Forecast to 2028 (Kilo Tons)
- Figure 48. Canada: Activated Carbon Market-Revenue and Forecast to 2028 (US$ Million)
- Figure 49. Mexico: Activated Carbon Market-Volume and Forecast to 2028 (Kilo Tons)
- Figure 50. Mexico: Activated Carbon Market-Revenue and Forecast to 2028 (US$ Million)
- Figure 51. Western Europe: Activated Carbon Market-Volume and Forecast to 2028 (Kilo Tons)
- Figure 52. Western Europe: Activated Carbon Market- Revenue and Forecast to 2028 (US$ Million)
- Figure 53. Western Europe: Activated Carbon Market Revenue Share, by Type (2021 and 2028)
- Figure 54. Western Europe: Activated Carbon Market Revenue Share, by Application (2021 and 2028)
- Figure 55. Western Europe: Activated Carbon Market Revenue Share, by Key Country (2021 and 2028)
- Figure 56. Germany: Activated Carbon Market-Volume and Forecast to 2028 (Kilo Tons)
- Figure 57. Germany: Activated Carbon Market-Revenue and Forecast to 2028 (US$ Million)
- Figure 58. France: Activated Carbon Market-Volume and Forecast to 2028 (Kilo Tons)
- Figure 59. France: Activated Carbon Market-Revenue and Forecast to 2028 (US$ Million)
- Figure 60. Italy: Activated Carbon Market-Volume and Forecast to 2028 (Kilo Tons)
- Figure 61. Italy: Activated Carbon Market-Revenue and Forecast to 2028 (US$ Million)
- Figure 62. United Kingdom: Activated Carbon Market-Volume and Forecast to 2028 (Kilo Tons)
- Figure 63. United Kingdom: Activated Carbon Market-Revenue and Forecast to 2028 (US$ Million)
- Figure 64. Spain: Activated Carbon Market- Volume and Forecast to 2028 (Kilo Tons)
- Figure 65. Spain: Activated Carbon Market-Revenue and Forecast to 2028 (US$ Million)
- Figure 66. Belgium: Activated Carbon Market - Volume and Forecast to 2028 (Kilo Tons)
- Figure 67. Belgium: Activated Carbon Market -Revenue and Forecast to 2028 (US$ Million)
- Figure 68. Netherlands: Activated Carbon Market - Volume and Forecast to 2028 (Kilo Tons)
- Figure 69. Netherlands: Activated Carbon Market -Revenue and Forecast to 2028 (US$ Million)
- Figure 70. Rest of Western Europe: Activated Carbon Market - Volume and Forecast to 2028 (Kilo Tons)
- Figure 71. Rest of Western Europe: Activated Carbon Market -Revenue and Forecast to 2028 (US$ Million)
- Figure 72. Eastern Europe: Activated Carbon Market -Volume and Forecast to 2028 (Kilo Tons)
- Figure 73. Eastern Europe: Activated Carbon Market - Revenue and Forecast to 2028 (US$ Million)
- Figure 74. Eastern Europe: Activated Carbon Market Revenue Share, by Type (2021 and 2028)
- Figure 75. Eastern Europe: Activated Carbon Market Revenue Share, by Application (2021 and 2028)
- Figure 76. Eastern Europe: Activated Carbon Market Revenue Share, by Key Country (2021 and 2028)
- Figure 77. Russia: Activated Carbon Market -Volume and Forecast to 2028 (Kilo Tons)
- Figure 78. Russia: Activated Carbon Market -Revenue and Forecast to 2028 (US$ Million)
- Figure 79. Poland: Activated Carbon Market -Volume and Forecast to 2028 (Kilo Tons)
- Figure 80. Poland: Activated Carbon Market -Revenue and Forecast to 2028 (US$ Million)
- Figure 81. Rest of Eastern Europe: Activated Carbon Market -Volume and Forecast to 2028 (Kilo Tons)
- Figure 82. Rest of Eastern Europe: Activated Carbon Market -Revenue and Forecast to 2028 (US$ Million)
- Figure 83. Asia Pacific: Activated Carbon Market - Volume and Forecast to 2028 (Kilo Tons)
- Figure 84. Asia Pacific: Activated Carbon Market - Revenue and Forecast to 2028 (US$ Million)
- Figure 85. Asia Pacific: Activated Carbon Market Revenue Share, by Type (2021 and 2028)
- Figure 86. Asia Pacific: Activated Carbon Market Revenue Share, by Application (2021 and 2028)
- Figure 87. Asia Pacific: Activated Carbon Market Revenue Share, by Key Country (2021 and 2028)
- Figure 88. Australia: Activated Carbon Market - Volume and Forecast to 2028 (Kilo Tons)
- Figure 89. Australia: Activated Carbon Market -Revenue and Forecast to 2028 (US$ Million)
- Figure 90. China: Activated Carbon Market - Volume and Forecast to 2028 (Kilo Tons)
- Figure 91. China: Activated Carbon Market -Revenue and Forecast to 2028 (US$ Million)
- Figure 92. India: Activated Carbon Market - Volume and Forecast to 2028 (Kilo Tons)
- Figure 93. India: Activated Carbon Market -Revenue and Forecast to 2028 (US$ Million)
- Figure 94. Japan: Activated Carbon Market - Volume and Forecast to 2028 (Kilo Tons)
- Figure 95. Japan: Activated Carbon Market -Revenue and Forecast to 2028 (US$ Million)
- Figure 96. South Korea: Activated Carbon Market - Volume and Forecast to 2028 (Kilo Tons)
- Figure 97. South Korea: Activated Carbon Market -Revenue and Forecast to 2028 (US$ Million)
- Figure 98. Vietnam: Activated Carbon Market - Volume and Forecast to 2028 (Kilo Tons)
- Figure 99. Vietnam: Activated Carbon Market -Revenue and Forecast to 2028 (US$ Million)
- Figure 100. Pakistan: Activated Carbon Market - Volume and Forecast to 2028 (Kilo Tons)
- Figure 101. Pakistan: Activated Carbon Market -Revenue and Forecast to 2028 (US$ Million)
- Figure 102. Indonesia: Activated Carbon Market - Volume and Forecast to 2028 (Kilo Tons)
- Figure 103. Indonesia: Activated Carbon Market -Revenue and Forecast to 2028 (US$ Million)
- Figure 104. Taiwan: Activated Carbon Market - Volume and Forecast to 2028 (Kilo Tons)
- Figure 105. Taiwan: Activated Carbon Market -Revenue and Forecast to 2028 (US$ Million)
- Figure 106. Rest of Asia Pacific: Activated Carbon Market - Volume and Forecast to 2028 (Kilo Tons)
- Figure 107. Rest of Asia Pacific: Activated Carbon Market -Revenue and Forecast to 2028 (US$ Million)
- Figure 108. Middle East & Africa: Activated Carbon Market -Volume and Forecast to 2028 (Kilo Tons)
- Figure 109. Middle East & Africa: Activated Carbon Market - Revenue and Forecast to 2028 (US$ Million)
- Figure 110. Middle East & Africa: Activated Carbon Market Revenue Share, by Type (2021 and 2028)
- Figure 111. Middle East & Africa: Activated Carbon Market Revenue Share, by Application (2021 and 2028)
- Figure 112. Middle East & Africa: Activated Carbon Market Revenue Share, by Key Country (2021 and 2028)
- Figure 113. Turkey: Activated Carbon Market -Volume and Forecast to 2028 (Kilo Tons)
- Figure 114. Turkey: Activated Carbon Market -Revenue and Forecast to 2028 (US$ Million)
- Figure 115. Saudi Arabia: Activated Carbon Market -Volume and Forecast to 2028 (Kilo Tons)
- Figure 116. Saudi Arabia: Activated Carbon Market -Revenue and Forecast to 2028 (US$ Million)
- Figure 117. Rest of Middle East & Africa: Activated Carbon Market -Volume and Forecast to 2028 (Kilo Tons)
- Figure 118. Rest of Middle East & Africa: Activated Carbon Market -Revenue and Forecast to 2028 (US$ Million)
- Figure 119. South & Central America: Activated Carbon Market -Volume and Forecast to 2028 (Kilo Tons)
- Figure 120. South & Central America: Activated Carbon Market - Revenue and Forecast to 2028 (US$ Million)
- Figure 121. South & Central America: Activated Carbon Market Revenue Share, by Type (2021 and 2028)
- Figure 122. South & Central America: Activated Carbon Market Revenue Share, by Application (2021 and 2028)
- Figure 123. South & Central America: Activated Carbon Market Revenue Share, by Key Country (2021 and 2028)
- Figure 124. Brazil: Activated Carbon Market -Volume and Forecast to 2028 (Kilo Tons)
- Figure 125. Brazil: Activated Carbon Market -Revenue and Forecast to 2028 (US$ Million)
- Figure 126. Rest of South & Central America: Activated Carbon Market -Volume and Forecast to 2028 (Kilo Tons)
- Figure 127. Rest of South & Central America: Activated Carbon Market -Revenue and Forecast to 2028 (US$ Million)
The activated carbon market size is expected to grow from US$ 3,845.46 million in 2022 to US$ 6,081.05 million by 2028; it is estimated to record a CAGR of 8.2% from 2023 to 2028.
Based on type, the global activated carbon market is segmented into granular/extruded, powdered, honeycombs, impregnated, and reactivated. The powdered segment held the largest market share in 2022. The granular/extruded segment is estimated to register the highest CAGR in the global activated carbon market during the forecast period. Granular activated carbon is utilized in gas and liquid phases for deodorization applications to eliminate natural organic matter, volatile organic compounds, and contaminants. Granular activated carbon is increasingly used owing to its properties such as structural strength, regeneration characteristics, and clean handling, as well as the feasible recovery of spent activated carbon. The gas & air segment is estimated to register the highest CAGR in the global activated carbon market during the forecast period. Activated carbon is highly used for industrial air treatment in petrochemical plants, landfill sites, manufacturing operations, and chemical processing facilities to filter hazardous pollutants such as volatile organic compounds.
Based on application, the global activated carbon market is segmented into gas & air, automotive, catalyst, chemicals, food & beverage, mining, pharmaceuticals, water treatment, and others. The water treatment segment held the largest market share in 2022. Activated carbon is extensively used in the tertiary treatment of wastewater and various stages of wastewater treatment. Wastewater is tested and treated for various parameters such as chemical oxygen demand (COD), toxins, total organic carbon, biological oxygen demand (BOD), hydrocarbons, pesticides, cyanides, and the presence of other harmful chemicals. Over the previous years, activated carbon has been widely used in service water treatment, groundwater rehabilitation, and drinking water treatment.
Asia Pacific accounted for the largest portion of the global activated carbon market share in 2022. China and India are major contributors to the growth of the activated carbon market in Asia Pacific. According to the European Chemical Industry Council, China's share of global chemicals sales increased to 43.0% in 2021, up from 28.3% reported in 2011. An increase in the requirement for various chemicals and a subsequent rise in chemical production are expected to boost the demand for activated carbon for chemical purification and processing. Moreover, the increasing establishment of water treatment facilities and equipment in China drives the activated carbon market in the country. It is used to adsorb a large amount of small particle-sized compounds such as benzene, toluene, ethyl-benzene, xylene, and organic compounds. Further, in India, the strong growth of the food & beverages, water treatment, air & gas, chemicals, etc. industries is bolstering the activated carbon market growth.
Osaka Gas Co Ltd, Haycarb PLC, Kureha Corp, Donau Chemie AG, Activated Carbon Technologies Pty Ltd, Albemarle Corp, CPL Activated Carbons, James Cumming and Sons Pty Ltd, Ingevity Corp, and Norit Nederland BV are a few players operating in the global activated carbon market. Market players are focusing on providing high-quality products to fulfill customer demand. They are also adopting strategies such as investments in research and development activities, new product launches, collaborations, and mergers & acquisitions.
The overall global activated carbon market size has been derived using both primary and secondary sources. To begin the research process, exhaustive secondary research has been conducted using internal and external sources to obtain qualitative and quantitative information related to the market. Also, multiple primary interviews have been conducted with industry participants to validate the data and gain more analytical insights into the topic. The participants of this process include industry experts such as VPs, business development managers, market intelligence managers, and national sales managers, along with external consultants such as valuation experts, research analysts, and key opinion leaders, specializing in the activated carbon market.
Reasons to Buy:
- Save and reduce time carrying out entry-level research by identifying the growth, size, leading players and segments in the global activated carbon market.
- Highlights key business priorities in order to assist companies to realign their business strategies
- The key findings and recommendations highlight crucial progressive industry trends in the global activated carbon market, thereby allowing players across the value chain to develop effective long-term strategies
- Develop/modify business expansion plans by using substantial growth offering developed and emerging markets
- Scrutinize in-depth global market trends and outlook coupled with the factors driving the activated carbon market, as well as those hindering it.
- Enhance the decision-making process by understanding the strategies that underpin commercial interest with respect to client products, segmentation, pricing and distribution
Table Of Contents
1. Introduction
- 1.1 Study Scope
- 1.2 The Insight Partners Research Report Guidance
- 1.3 Market Segmentation
- 1.3.1 Global Activated Carbon Market, by Type
- 1.3.2 Global Activated Carbon Market, by Application
- 1.3.3 Global Activated Carbon Market, by Geography
2. Key Takeaways
3. Research Methodology
- 3.1 Scope of the Study
- 3.2 Research Methodology
- 3.2.1 Data Collection:
- 3.2.2 Primary Interviews:
- 3.2.3 Hypothesis formulation:
- 3.2.4 Macro-economic factor analysis:
- 3.2.5 Developing base number:
- 3.2.6 Data Triangulation:
- 3.2.7 Country level data:
4. Executive Summary
- 4.1 Executive Summary
5. Factors Impacting Activated Carbon Market
- 5.1 Global Wastewater Treatment Outlook
- 5.2 Technology Trends
- 5.3 Regulations
- 5.4 Sustainability Initiatives
6. Activated Carbon - Global Market Analysis
- 6.1 Global Activated Carbon Market -Volume and Forecast to 2028 (Kilo Tons)
- 6.2 Global Activated Carbon Market -Revenue and Forecast to 2028 (US$ Million)
- 6.3 Price Trend Analysis, by Type, 2022 (US$/ Ton)
- 6.4 List of Activated Carbon Manufacturers
- 6.5 Market Positioning - Activated Carbon Market Players
7. Global Activated Carbon Market Analysis - By Type
- 7.1 Overview
- 7.2 Global Activated Carbon Market, By Type (2021 and 2028)
- 7.3 Granular/Extruded
- 7.3.1 Overview
- 7.3.2 Granular/Extruded: Activated Carbon Market - Volume and Forecast to 2028 (Kilo Tons)
- 7.3.3 Granular/Extruded: Activated Carbon Market - Revenue and Forecast to 2028 (US$ Million)
- 7.4 Powdered
- 7.4.1 Overview
- 7.4.2 Powdered: Activated Carbon Market - Volume and Forecast to 2028 (Kilo Tons)
- 7.4.3 Powdered: Activated Carbon Market - Revenue and Forecast to 2028 (US$ Million)
- 7.5 Honeycombs
- 7.5.1 Overview
- 7.5.2 Honeycombs: Activated Carbon Market - Volume and Forecast to 2028 (Kilo Tons)
- 7.5.3 Honeycombs: Activated Carbon Market - Revenue and Forecast to 2028 (US$ Million)
- 7.6 Impregnated
- 7.6.1 Overview
- 7.6.2 Impregnated: Activated Carbon Market - Volume and Forecast to 2028 (Kilo Tons)
- 7.6.3 Impregnated: Activated Carbon Market - Revenue and Forecast to 2028 (US$ Million)
- 7.7 Reactivated
- 7.7.1 Overview
- 7.7.2 Reactivated: Activated Carbon Market - Volume and Forecast to 2028 (Kilo Tons)
- 7.7.3 Reactivated: Activated Carbon Market - Revenue and Forecast to 2028 (US$ Million)
8. Global Activated Carbon Market Analysis - By Application
- 8.1 Overview
- 8.2 Global Activated Carbon Market, By Application (2021 and 2028)
- 8.3 Gas and Air
- 8.3.1 Overview
- 8.3.2 Gas and Air: Activated Carbon Market - Volume and Forecast to 2028 (Kilo Tons)
- 8.3.3 Gas and Air: Activated Carbon Market - Revenue and Forecast to 2028 (US$ Million)
- 8.4 Automotive
- 8.4.1 Overview
- 8.4.2 Automotive: Activated Carbon Market - Volume and Forecast to 2028 (Kilo Tons)
- 8.4.3 Automotive: Activated Carbon Market - Revenue and Forecast to 2028 (US$ Million)
- 8.5 Catalyst
- 8.5.1 Overview
- 8.5.2 Catalyst: Activated Carbon Market - Volume and Forecast to 2028 (Kilo Tons)
- 8.5.3 Catalyst: Activated Carbon Market - Revenue and Forecast to 2028 (US$ Million)
- 8.6 Chemicals
- 8.6.1 Overview
- 8.6.2 Chemicals: Activated Carbon Market - Volume and Forecast to 2028 (Kilo Tons)
- 8.6.3 Chemicals: Activated Carbon Market - Revenue and Forecast to 2028 (US$ Million)
- 8.7 Food and Beverage
- 8.7.1 Overview
- 8.7.2 Food and Beverage: Activated Carbon Market - Volume and Forecast to 2028 (Kilo Tons)
- 8.7.3 Food and Beverage: Activated Carbon Market - Revenue and Forecast to 2028 (US$ Million)
- 8.8 Mining
- 8.8.1 Overview
- 8.8.2 Mining: Activated Carbon Market - Volume and Forecast to 2028 (Kilo Tons)
- 8.8.3 Mining: Activated Carbon Market - Revenue and Forecast to 2028 (US$ Million)
- 8.9 Pharmaceuticals
- 8.9.1 Overview
- 8.9.2 Pharmaceuticals: Activated Carbon Market - Volume and Forecast to 2028 (Kilo Tons)
- 8.9.3 Pharmaceuticals: Activated Carbon Market - Revenue and Forecast to 2028 (US$ Million)
- 8.10 Water Treatment
- 8.10.1 Overview
- 8.10.2 Water Treatment: Activated Carbon Market - Volume and Forecast to 2028 (Kilo Tons)
- 8.10.3 Water Treatment: Activated Carbon Market - Revenue and Forecast to 2028 (US$ Million)
- 8.11 Others
- 8.11.1 Overview
- 8.11.2 Others: Activated Carbon Market - Volume and Forecast to 2028 (Kilo Tons)
- 8.11.3 Others: Activated Carbon Market - Revenue and Forecast to 2028 (US$ Million)
9. Global Activated Carbon Market - Geographic Analysis
- 9.1 Overview
- 9.2 North America: Activated Carbon Market
- 9.2.1 North America: Activated Carbon Market -Volume and Forecast to 2028 (Kilo Tons)
- 9.2.2 North America: Activated Carbon Market -Revenue and Forecast to 2028 (US$ Million)
- 9.2.3 North America: Activated Carbon Market, by Type
- 9.2.4 North America: Activated Carbon Market, by Application
- 9.2.5 North America: Activated Carbon Market, by Key Country
- 9.2.5.1 Historical Trends
- 9.2.5.2 US: Activated Carbon Market -Volume and Forecast to 2028 (Kilo Tons)
- 9.2.5.3 US: Activated Carbon Market -Revenue and Forecast to 2028 (US$ Million)
- 9.2.5.3.1 US: Activated Carbon Market, by Type
- 9.2.5.3.2 US: Activated Carbon Market, by Type
- 9.2.5.3.3 US: Activated Carbon Market, by Application
- 9.2.5.3.4 US: Activated Carbon Market, by Application
- 9.2.5.4 Canada: Activated Carbon Market-Volume and Forecast to 2028 (Kilo Tons)
- 9.2.5.5 Canada: Activated Carbon Market-Revenue and Forecast to 2028 (US$ Million)
- 9.2.5.5.1 Canada: Activated Carbon Market, by Type
- 9.2.5.5.2 Canada: Activated Carbon Market, by Type
- 9.2.5.5.3 Canada: Activated Carbon Market, by Application
- 9.2.5.5.4 Canada: Activated Carbon Market, by Application
- 9.2.5.6 Mexico: Activated Carbon Market-Volume and Forecast to 2028 (Kilo Tons)
- 9.2.5.7 Mexico: Activated Carbon Market-Revenue and Forecast to 2028 (US$ Million)
- 9.2.5.7.1 Mexico: Activated Carbon Market, by Type
- 9.2.5.7.2 Mexico: Activated Carbon Market, by Type
- 9.2.5.7.3 Mexico: Activated Carbon Market, by Application
- 9.2.5.7.4 Mexico: Activated Carbon Market, by Application
- 9.3 Western Europe: Activated Carbon Market
- 9.3.1 Western Europe: Activated Carbon Market-Volume and Forecast to 2028 (Kilo Tons)
- 9.3.2 Western Europe: Activated Carbon Market-Revenue and Forecast to 2028 (US$ Million)
- 9.3.3 Western Europe: Activated Carbon Market, by Type
- 9.3.4 Western Europe: Activated Carbon Market, by Application
- 9.3.5 Western Europe: Activated Carbon Market, by Key Country
- 9.3.5.1 Historical Trends
- 9.3.5.2 Germany: Activated Carbon Market-Volume and Forecast to 2028 (Kilo Tons)
- 9.3.5.3 Germany: Activated Carbon Market-Revenue and Forecast to 2028 (US$ Million)
- 9.3.5.3.1 Germany: Activated Carbon Market, by Type
- 9.3.5.3.2 Germany: Activated Carbon Market, by Type
- 9.3.5.3.3 Germany: Activated Carbon Market, by Application
- 9.3.5.3.4 Germany: Activated Carbon Market, by Application
- 9.3.5.4 France: Activated Carbon Market-Volume and Forecast to 2028 (Kilo Tons)
- 9.3.5.5 France: Activated Carbon Market-Revenue and Forecast to 2028 (US$ Million)
- 9.3.5.5.1 France: Activated Carbon Market, by Type
- 9.3.5.5.2 France: Activated Carbon Market, by Type
- 9.3.5.5.3 France: Activated Carbon Market, by Application
- 9.3.5.5.4 France: Activated Carbon Market, by Application
- 9.3.5.6 Italy: Activated Carbon Market-Volume and Forecast to 2028 (Kilo Tons)
- 9.3.5.7 Italy: Activated Carbon Market-Revenue and Forecast to 2028 (US$ Million)
- 9.3.5.7.1 Italy: Activated Carbon Market, by Type
- 9.3.5.7.2 Italy: Activated Carbon Market, by Type
- 9.3.5.7.3 Italy: Activated Carbon Market, by Application
- 9.3.5.7.4 Italy: Activated Carbon Market, by Application
- 9.3.5.8 United Kingdom: Activated Carbon Market-Volume and Forecast to 2028 (Kilo Tons)
- 9.3.5.9 United Kingdom: Activated Carbon Market-Revenue and Forecast to 2028 (US$ Million)
- 9.3.5.9.1 United Kingdom: Activated Carbon Market, by Type
- 9.3.5.9.2 United Kingdom: Activated Carbon Market, by Type
- 9.3.5.9.3 United Kingdom: Activated Carbon Market, by Application
- 9.3.5.9.4 United Kingdom: Activated Carbon Market, by Application
- 9.3.5.10 Spain: Activated Carbon Market-Volume and Forecast to 2028 (Kilo Tons)
- 9.3.5.11 Spain: Activated Carbon Market-Revenue and Forecast to 2028 (US$ Million)
- 9.3.5.11.1 Spain: : Activated Carbon Market, by Type
- 9.3.5.11.2 Spain: Activated Carbon Market, by Type
- 9.3.5.11.3 Spain: Activated Carbon Market, by Application
- 9.3.5.11.4 Spain: Activated Carbon Market, by Application
- 9.3.5.12 Belgium: Activated Carbon Market - Volume and Forecast to 2028 (Kilo Tons)
- 9.3.5.13 Belgium: Activated Carbon Market -Revenue and Forecast to 2028 (US$ Million)
- 9.3.5.13.1 Belgium: Activated Carbon Market, by Type
- 9.3.5.13.2 Belgium: Activated Carbon Market, by Type
- 9.3.5.13.3 Belgium: Activated Carbon Market, by Application
- 9.3.5.13.4 Belgium: Activated Carbon Market, by Application
- 9.3.5.14 Netherlands: Activated Carbon Market - Volume and Forecast to 2028 (Kilo Tons)
- 9.3.5.15 Netherlands: Activated Carbon Market -Revenue and Forecast to 2028 (US$ Million)
- 9.3.5.15.1 Netherlands: Activated Carbon Market, by Type
- 9.3.5.15.2 Netherlands: Activated Carbon Market, by Type
- 9.3.5.15.3 Netherlands: Activated Carbon Market, by Application
- 9.3.5.15.4 Netherlands: Activated Carbon Market, by Application
- 9.3.5.16 Rest of Western Europe: Activated Carbon Market - Volume and Forecast to 2028 (Kilo Tons)
- 9.3.5.17 Rest of Western Europe: Activated Carbon Market -Revenue and Forecast to 2028 (US$ Million)
- 9.3.5.17.1 Rest of Western Europe: Activated Carbon Market, by Type
- 9.3.5.17.2 Rest of Western Europe: Activated Carbon Market, by Type
- 9.3.5.17.3 Rest of Western Europe: Activated Carbon Market, by Application
- 9.3.5.17.4 Rest of Western Europe: Activated Carbon Market, by Application
- 9.4 Eastern Europe: Activated Carbon Market
- 9.4.1 Eastern Europe: Activated Carbon Market -Volume and Forecast to 2028 (Kilo Tons)
- 9.4.2 Eastern Europe: Activated Carbon Market -Revenue and Forecast to 2028 (US$ Million)
- 9.4.3 Eastern Europe: Activated Carbon Market, by Type
- 9.4.4 Eastern Europe: Activated Carbon Market, by Application
- 9.4.5 Eastern Europe: Activated Carbon Market, by Key Country
- 9.4.5.1 Historical Trends
- 9.4.5.2 Russia: Activated Carbon Market -Volume and Forecast to 2028 (Kilo Tons)
- 9.4.5.3 Russia: Activated Carbon Market -Revenue and Forecast to 2028 (US$ Million)
- 9.4.5.3.1 Russia: Activated Carbon Market, by Type
- 9.4.5.3.2 Russia: Activated Carbon Market, by Type
- 9.4.5.3.3 Russia: Activated Carbon Market, by Application
- 9.4.5.3.4 Russia: Activated Carbon Market, by Application
- 9.4.5.4 Poland: Activated Carbon Market -Volume and Forecast to 2028 (Kilo Tons)
- 9.4.5.5 Poland: Activated Carbon Market -Revenue and Forecast to 2028 (US$ Million)
- 9.4.5.5.1 Poland: Activated Carbon Market, by Type
- 9.4.5.5.2 Poland: Activated Carbon Market, by Type
- 9.4.5.5.3 Poland: Activated Carbon Market, by Application
- 9.4.5.5.4 Poland: Activated Carbon Market, by Application
- 9.4.5.6 Rest of Eastern Europe: Activated Carbon Market -Volume and Forecast to 2028 (Kilo Tons)
- 9.4.5.7 Rest of Eastern Europe: Activated Carbon Market -Revenue and Forecast to 2028 (US$ Million)
- 9.4.5.7.1 Rest of Eastern Europe: Activated Carbon Market, by Type
- 9.4.5.7.2 Rest of Eastern Europe: Activated Carbon Market, by Type
- 9.4.5.7.3 Rest of Eastern Europe: Activated Carbon Market, by Application
- 9.4.5.7.4 Rest of Eastern Europe: Activated Carbon Market, by Application
- 9.5 Asia Pacific: Activated Carbon Market
- 9.5.1 Asia Pacific: Activated Carbon Market -Volume and Forecast to 2028 (Kilo Tons)
- 9.5.2 Asia Pacific: Activated Carbon Market -Revenue and Forecast to 2028 (US$ Million)
- 9.5.3 Asia Pacific: Activated Carbon Market, by Type
- 9.5.4 Asia Pacific: Activated Carbon Market, by Application
- 9.5.5 Asia Pacific: Activated Carbon Market, by Key Country
- 9.5.5.1 Historical Trends
- 9.5.5.2 Australia: Activated Carbon Market - Volume and Forecast to 2028 (Kilo Tons)
- 9.5.5.3 Australia: Activated Carbon Market -Revenue and Forecast to 2028 (US$ Million)
- 9.5.5.3.1 Australia: Activated Carbon Market, by Type
- 9.5.5.3.2 Australia: Activated Carbon Market, by Type
- 9.5.5.3.3 Australia: Activated Carbon Market, by Application
- 9.5.5.3.4 Australia: Activated Carbon Market, by Application
- 9.5.5.4 China: Activated Carbon Market - Volume and Forecast to 2028 (Kilo Tons)
- 9.5.5.5 China: Activated Carbon Market -Revenue and Forecast to 2028 (US$ Million)
- 9.5.5.5.1 China: Activated Carbon Market, by Type
- 9.5.5.5.2 China: Activated Carbon Market, by Type
- 9.5.5.5.3 China: Activated Carbon Market, by Application
- 9.5.5.5.4 China: Activated Carbon Market, by Application
- 9.5.5.6 India: Activated Carbon Market - Volume and Forecast to 2028 (Kilo Tons)
- 9.5.5.7 India: Activated Carbon Market -Revenue and Forecast to 2028 (US$ Million)
- 9.5.5.7.1 India: Activated Carbon Market, by Type
- 9.5.5.7.2 India: Activated Carbon Market, by Type
- 9.5.5.7.3 India: Activated Carbon Market, by Application
- 9.5.5.7.4 India: Activated Carbon Market, by Application
- 9.5.5.8 Japan: Activated Carbon Market - Volume and Forecast to 2028 (Kilo Tons)
- 9.5.5.9 Japan: Activated Carbon Market -Revenue and Forecast to 2028 (US$ Million)
- 9.5.5.9.1 Japan: Activated Carbon Market, by Type
- 9.5.5.9.2 Japan: Activated Carbon Market, by Type
- 9.5.5.9.3 Japan: Activated Carbon Market, by Application
- 9.5.5.9.4 Japan: Activated Carbon Market, by Application
- 9.5.5.10 South Korea: Activated Carbon Market - Volume and Forecast to 2028 (Kilo Tons)
- 9.5.5.11 South Korea: Activated Carbon Market -Revenue and Forecast to 2028 (US$ Million)
- 9.5.5.11.1 South Korea: Activated Carbon Market, by Type
- 9.5.5.11.2 South Korea: Activated Carbon Market, by Type
- 9.5.5.11.3 South Korea: Activated Carbon Market, by Application
- 9.5.5.11.4 South Korea: Activated Carbon Market, by Application
- 9.5.5.12 Vietnam: Activated Carbon Market - Volume and Forecast to 2028 (Kilo Tons)
- 9.5.5.13 Vietnam: Activated Carbon Market -Revenue and Forecast to 2028 (US$ Million)
- 9.5.5.13.1 Vietnam: Activated Carbon Market, by Type
- 9.5.5.13.2 Vietnam: Activated Carbon Market, by Type
- 9.5.5.13.3 Vietnam: Activated Carbon Market, by Application
- 9.5.5.13.4 Vietnam: Activated Carbon Market, by Application
- 9.5.5.14 Pakistan: Activated Carbon Market - Volume and Forecast to 2028 (Kilo Tons)
- 9.5.5.15 Pakistan: Activated Carbon Market -Revenue and Forecast to 2028 (US$ Million)
- 9.5.5.15.1 Pakistan: Activated Carbon Market, by Type
- 9.5.5.15.2 Pakistan: Activated Carbon Market, by Type
- 9.5.5.15.3 Pakistan: Activated Carbon Market, by Application
- 9.5.5.15.4 Pakistan: Activated Carbon Market, by Application
- 9.5.5.16 Indonesia: Activated Carbon Market - Volume and Forecast to 2028 (Kilo Tons)
- 9.5.5.17 Indonesia: Activated Carbon Market -Revenue and Forecast to 2028 (US$ Million)
- 9.5.5.17.1 Indonesia: Activated Carbon Market, by Type
- 9.5.5.17.2 Indonesia: Activated Carbon Market, by Type
- 9.5.5.17.3 Indonesia: Activated Carbon Market, by Application
- 9.5.5.17.4 Indonesia: Activated Carbon Market, by Application
- 9.5.5.18 Taiwan: Activated Carbon Market - Volume and Forecast to 2028 (Kilo Tons)
- 9.5.5.19 Taiwan: Activated Carbon Market -Revenue and Forecast to 2028 (US$ Million)
- 9.5.5.19.1 Taiwan: Activated Carbon Market, by Type
- 9.5.5.19.2 Taiwan: Activated Carbon Market, by Type
- 9.5.5.19.3 Taiwan: Activated Carbon Market, by Application
- 9.5.5.19.4 Taiwan: Activated Carbon Market, by Application
- 9.5.5.20 Rest of Asia Pacific: Activated Carbon Market - Volume and Forecast to 2028 (Kilo Tons)
- 9.5.5.21 Rest of Asia Pacific: Activated Carbon Market -Revenue and Forecast to 2028 (US$ Million)
- 9.5.5.21.1 Rest of Asia Pacific: Activated Carbon Market, by Type
- 9.5.5.21.2 Rest of Asia Pacific: Activated Carbon Market, by Type
- 9.5.5.21.3 Rest of Asia Pacific: Activated Carbon Market, by Application
- 9.5.5.21.4 Rest of Asia Pacific: Activated Carbon Market, by Application
- 9.6 Middle East & Africa: Activated Carbon Market
- 9.6.1 Middle East & Africa: Activated Carbon Market -Volume and Forecast to 2028 (Kilo Tons)
- 9.6.2 Middle East & Africa: Activated Carbon Market -Revenue and Forecast to 2028 (US$ Million)
- 9.6.3 Middle East & Africa: Activated Carbon Market, by Type
- 9.6.4 Middle East & Africa: Activated Carbon Market, by Application
- 9.6.5 Middle East & Africa: Activated Carbon Market, by Key Country
- 9.6.5.1 Historical Trends
- 9.6.5.2 Turkey: Activated Carbon Market -Volume and Forecast to 2028 (Kilo Tons)
- 9.6.5.3 Turkey: Activated Carbon Market -Revenue and Forecast to 2028 (US$ Million)
- 9.6.5.3.1 Turkey: Activated Carbon Market, by Type
- 9.6.5.3.2 Turkey: Activated Carbon Market, by Type
- 9.6.5.3.3 Turkey: Activated Carbon Market, by Application
- 9.6.5.3.4 Turkey: Activated Carbon Market, by Application
- 9.6.5.4 Saudi Arabia: Activated Carbon Market -Volume and Forecast to 2028 (Kilo Tons)
- 9.6.5.5 Saudi Arabia: Activated Carbon Market -Revenue and Forecast to 2028 (US$ Million)
- 9.6.5.5.1 Saudi Arabia: Activated Carbon Market, by Type
- 9.6.5.5.2 Saudi Arabia: Activated Carbon Market, by Type
- 9.6.5.5.3 Saudi Arabia: Activated Carbon Market, by Application
- 9.6.5.5.4 Saudi Arabia: Activated Carbon Market, by Application
- 9.6.5.6 Rest of Middle East & Africa: Activated Carbon Market -Volume and Forecast to 2028 (Kilo Tons)
- 9.6.5.7 Rest of Middle East & Africa: Activated Carbon Market -Revenue and Forecast to 2028 (US$ Million)
- 9.6.5.7.1 Rest of Middle East & Africa: Activated Carbon Market, by Type
- 9.6.5.7.2 Rest of Middle East & Africa: Activated Carbon Market, by Type
- 9.6.5.7.3 Rest of Middle East & Africa: Activated Carbon Market, by Application
- 9.6.5.7.4 Rest of Middle East & Africa: Activated Carbon Market, by Application
- 9.7 South & Central America: Activated Carbon Market
- 9.7.1 South & Central America: Activated Carbon Market -Volume and Forecast to 2028 (Kilo Tons)
- 9.7.2 South & Central America: Activated Carbon Market -Revenue and Forecast to 2028 (US$ Million)
- 9.7.3 South & Central America: Activated Carbon Market, by Type
- 9.7.4 South & Central America: Activated Carbon Market, by Application
- 9.7.5 South & Central America: Activated Carbon Market, by Key Country
- 9.7.5.1 Historical Trends
- 9.7.5.2 Brazil: Activated Carbon Market -Volume and Forecast to 2028 (Kilo Tons)
- 9.7.5.3 Brazil: Activated Carbon Market -Revenue and Forecast to 2028 (US$ Million)
- 9.7.5.3.1 Brazil: Activated Carbon Market, by Type
- 9.7.5.3.2 Brazil: Activated Carbon Market, by Type
- 9.7.5.3.3 Brazil: Activated Carbon Market, by Application
- 9.7.5.3.4 Brazil: Activated Carbon Market, by Application
- 9.7.5.4 Rest of South & Central America: Activated Carbon Market -Volume and Forecast to 2028 (Kilo Tons)
- 9.7.5.5 Rest of South & Central America: Activated Carbon Market -Revenue and Forecast to 2028 (US$ Million)
- 9.7.5.5.1 Rest of South & Central America: Activated Carbon Market, by Type
- 9.7.5.5.2 Rest of South & Central America: Activated Carbon Market, by Type
- 9.7.5.5.3 Rest of South & Central America: Activated Carbon Market, by Application
- 9.7.5.5.4 Rest of South & Central America: Activated Carbon Market, by Application
10. Impact of COVID-19 Pandemic on Global Activated Carbon Market
- 10.1 Overview - Impact of COVID-19 Pandemic
- 10.2 Impact of COVID-19 on Activated Carbon Market
- 10.3 North America: Impact Assessment of COVID-19 Pandemic
- 10.4 Europe: Impact Assessment of COVID-19 Pandemic
- 10.5 Asia Pacific: Impact Assessment of COVID-19 Pandemic
- 10.6 Middle East and Africa: Impact Assessment of COVID-19 Pandemic
- 10.7 South America: Impact Assessment of COVID-19 Pandemic
11. Industry Landscape
12. Company Profiles
- 12.1 Osaka Gas Chemical Co. Ltd
- 12.1.1 Key Facts
- 12.1.2 Business Description
- 12.1.3 Products and Services
- 12.1.4 Financial Overview
- 12.1.5 Key Developments
- 12.2 KURARAY CO., LTD.
- 12.2.1 Key Facts
- 12.2.2 Business Description
- 12.2.3 Products and Services
- 12.2.4 Financial Overview
- 12.2.5 Key Developments
- 12.3 HAYCARB (PVT) LTD.
- 12.3.1 Key Facts
- 12.3.2 Business Description
- 12.3.3 Products and Services
- 12.3.4 Financial Overview
- 12.3.5 Key Developments
- 12.4 KUREHA CORPORATION
- 12.4.1 Key Facts
- 12.4.2 Business Description
- 12.4.3 Products and Services
- 12.4.4 Financial Overview
- 12.4.5 Key Developments
- 12.5 CABOT CORPORATION
- 12.5.1 Key Facts
- 12.5.2 Business Description
- 12.5.3 Products and Services
- 12.5.4 Financial Overview
- 12.5.5 Key Developments
13. Appendix
- 13.1 About The Insight Partners
- 13.2 Glossary of Terms