|
|
市場調査レポート
商品コード
1263747
プレイアウトソリューションの2028年までの市場予測-コンポーネント(ハードウェア、ソフトウェア、サービス)、アプリケーション(スポーツ、ニュース、エンターテインメント、ライフスタイル、ファッション、その他)別の世界分析Playout Solutions Market Forecast to 2028 - Global Analysis By Component (Hardware, Software, and Services) and Application (Sports, News, Entertainment, Lifestyle and Fashion, and Others) |
||||||
|
|
|||||||


| プレイアウトソリューションの2028年までの市場予測-コンポーネント(ハードウェア、ソフトウェア、サービス)、アプリケーション(スポーツ、ニュース、エンターテインメント、ライフスタイル、ファッション、その他)別の世界分析 |
|
出版日: 2023年04月06日
発行: The Insight Partners
ページ情報: 英文 151 Pages
納期: 即納可能
|
- 全表示
- 概要
- 図表
- 目次
プレイアウトソリューション市場は、2022年の11億6,902万米ドルから2028年には18億9,226万米ドルに成長すると予測されており、2023年から2028年までのCAGRは8.7%を記録すると推定されています。
メディア・放送業界におけるいくつかの構造的な変化は、顧客の関心の高まりと技術的な進歩につながります。テレビ業界の進化の一環として、放送局は商機に迅速に対応するために革新的な技術を選ぶようになっています。より高品質な表示とメタデータに基づく柔軟なコンテンツ管理を提供する革新的な技術への需要が、さまざまな業界で高まっています。プレイアウト・ソリューションは、TVチャンネルやラジオ・コンテンツの高度な伝送のために放送局で導入されています。プレイアウト・ソリューション市場は、世界中でパーソナライズされた放送サービスへの需要が高まっていることから、大きな成長を遂げています。また、クラウドベースのプレイアウトソリューションの需要が高まっていることも、市場を牽引しています。しかし、その統合の複雑さとプライバシーに関する懸念が、プレイアウト・ソリューション市場の成長を妨げています。さらに、5G技術の導入は、プレイアウト・ソリューション市場の成長に有利な機会を提供すると考えられます。また、地上波テレビの需要は、予測期間中、プレイアウト・ソリューション市場の重要な動向として浮上すると予想されます。
エンターテインメント業界向けには、EncompassなどのメーカーがSCTEメッセージでリニアチャンネルを自動生成し、番組セクションや広告の開始と終了をマークし、高品質のメタデータを含めます。これにより、AVOD、SVOD、Live-to-VOD、デジタル広告挿入など、正しいソースファイルの出力をフレーミングできます。動的なプロセスとワークフローの自動化により、ユーザーはコンテンツをより効率的に監視し、全体的なコストを削減しながらより多くの顧客にリーチすることができます。Muvi Playoutは、Muviの新しいアプリで、使いやすいスケジューラを使って、OTT TVチャンネルでのライブスケジュールを構築することができます。このアプリは、すべてのオンデマンドコンテンツのシンプルなスケジュールを構築するのに役立ち、OTTプラットフォームをリニアTVネットワークのように運用することができます。Muvi Playoutでは、異なるタイムゾーンを検出し、さまざまなタイムゾーンに対応した個別のチャンネルを作成することもできます。この機能により、番組を制作する際に、複数の地域のさまざまな視聴者が最も視聴しているコンテンツに関連する情報を簡単に収集することができます。Amazon Web Services、Netflix、Amazon Primeビデオソリューションなどの企業は、プロバイダーがコンテンツに集中することを可能にし、それによって放送プレイアウト、OTTなどで消費者に優れたユーザー体験を提供することができます。
プレイアウト・ソリューションの開発者が開発したスポーツ・チャンネル・アプリケーション(アプリ)は、スポーツ・チャンネルの管理に役立ち、プレイアウト・ソフトウェアは、ゲームのスコアボードなどのアプリケーションのケータリングに役立ちます。柔軟なプレイアウト・ソリューションは、1つまたは2つの試合を同時に放送し、グラフィカルな詳細や広告、マルチソース・インポート・データとともに、チャンネルの完全自動化を提供します。例えば、Avecoが提供するプレイアウト・ソリューションは、スポンサーのグラフィック、非同期広告、コンテンツを削除せずに広告スペースを拡大するための番組のタイムスクイズ、スポンサーのアンカーセンテンスの管理などを制御します。Avecoisは、世界で最も複雑で大規模なスポーツネットワークの自動化を手がける大手企業の一つであり、小規模なスポーツネットワークをコスト効率よく管理するためのスケールダウン運用を支援することができます。また、スポーツ向けプレイアウト・ソリューション・ソフトウェアは、すぐに使えるテンプレートを提供し、ゲームのスコアボードなどを管理します。
プレイアウト・ソリューション市場は、コンポーネント、アプリケーション、地域によって区分されます。コンポーネントに基づいて、プレイアウトソリューション市場は、ハードウェア、ソフトウェア、サービスに分類されます。アプリケーション別に見ると、プレイアウトソリューション市場は、スポーツ、ニュース、エンターテインメント、ライフスタイル・ファッション、その他に分類されます。地域別では、プレイアウトソリューション市場は、北米、欧州、アジア太平洋、中東・アフリカ、南米に分類されます。
Amagi、Evertz、BroadStream Solutions、Harmonic Inc、Belden Incorporated(Grass Valley)、Imagine Communications、Pebble Beach Systems、Pixel Power、Playbox Technology、Florical Systemsなどは、この市場調査で紹介されているプレイアウトソリューション市場で活動している主要市場プレイヤーの一人です。
プレイアウトソリューションの市場規模は、一次情報および二次情報の両方を用いて算出されています。徹底的な二次調査は、プレイアウトソリューション市場に関連する質的・量的情報を得るために、社内外の情報源を用いて実施されました。また、このプロセスは、すべての市場セグメントに関する市場の概要と予測を得るのに役立ちます。また、データの検証や分析的な洞察を得るために、業界関係者に複数の一次インタビューを実施しました。このプロセスには、副社長、市場開拓マネージャー、マーケットインテリジェンスマネージャー、国内セールスマネージャーなどの業界専門家と、プレイアウトソリューション市場を専門とする評価専門家、研究アナリスト、キーオピニオンリーダーなどの外部コンサルタントが参加しています。
目次
第1章 イントロダクション
- 研究対象範囲
- 洞察パートナーズ調査報告書ガイダンス
- 市場セグメンテーション
- プレイアウトソリューション市場- コンポーネント別
- プレイアウトソリューション市場- アプリケーション別
- プレイアウト・ソリューション市場-地域別
第2章 キーテイクアウェイ
第3章 調査手法
- カバレッジ
- 2次調査について
- 1次調査について
第4章 プレイアウトソリューションの市場情勢
- 市場概要
- PEST分析
- 北米
- 欧州
- APAC
- MEA
- サム
- エコシステム分析
- エキスパート・オピニオン
第5章 プレイアウト・ソリューション市場- 主要な市場力学
- 市場促進要因
- パーソナライズド放送サービスの需要拡大
- クラウドベースのプレイアウトソリューションが増加
- 抑制要因
- 統合の複雑さとプライバシーへの懸念
- 機会
- 5G技術のイントロダクション
- 今後の動向について
- 地上波テレビの需要
- 促進要因と抑制要因のインパクト分析
第6章 プレイアウト・ソリューション市場-世界分析
- プレイアウトソリューションの世界市場概要
- 市場の位置づけ-主要5社
第7章 プレイアウトソリューションの市場分析- コンポーネント別
- プレイアウトソリューション市場:コンポーネント別(2022年、2028年)
- ソフトウェア
- ハードウェア
- サービス内容
第8章 プレイアウトソリューションの市場分析-アプリケーション別
- プレイアウトソリューション市場:用途別(2022年、2028年)
- エンターテイメント
- ニュース
- スポーツ
- ファッション・ライフスタイル
- その他
第9章 プレイアウトソリューション市場- 地域分析
- 北米
- 米国
- カナダ
- メキシコ
- 欧州
- ドイツ
- 英国
- フランス
- イタリア
- ロシア
- その他欧州
- アジア太平洋地域
- 中国
- 日本
- 韓国
- インド
- オーストラリア
- その他アジア太平洋地域
- 中東・アフリカ地域
- サウジアラビア
- UAE
- 南アフリカ
- その他中東とアフリカ
- 南米
- ブラジル
- アルゼンチン
- その他南米地域
第10章 COVID-19パンデミックが世界のプレイアウト・ソリューション市場に与える影響
第11章 業界の情勢
- マーケット・イニシアティブ
- 新商品開発
- 合併・買収
第12章 企業プロファイル
- Amagi
- Evertz
- BroadStream Solutions
- Harmonic Inc
- Belden Incorporated(Grass Valley)
- Imagine Communications
- Pebble Beach Systems
- Pixel Power
- Playbox Technology
- Florical Systems
第13章 付録
- 洞察パートナーズについて
- 単語インデックス
List Of Tables
- Table 1. Playout Solutions Market - Revenue and Forecast to 2028 (US$ Million)
- Table 2. North America Playout Solutions Market, Revenue and Forecast To 2028 - By Component (US$ Million)
- Table 3. North America Playout Solutions Market, Revenue and Forecast To 2028 - By Application (US$ Million)
- Table 4. North America Playout Solutions Market, Revenue and Forecast To 2028 - By Country (US$ Million)
- Table 5. US Playout Solutions Market, Revenue and Forecast to 2028 - By Component (US$ Million)
- Table 6. US Playout Solutions Market, Revenue and Forecast to 2028 - By Application (US$ Million)
- Table 7. Canada Playout Solutions Market, Revenue and Forecast to 2028 - By Component (US$ Million)
- Table 8. Canada Playout Solutions Market, Revenue and Forecast to 2028 - By Application (US$ Million)
- Table 9. Mexico Playout Solutions Market, Revenue and Forecast to 2028 - By Component (US$ Million)
- Table 10. Mexico Playout Solutions Market, Revenue and Forecast to 2028 - By Application (US$ Million)
- Table 11. Europe Playout Solutions Market, Revenue and Forecast To 2028 - By Component (US$ Million)
- Table 12. Europe Playout Solutions Market, Revenue and Forecast To 2028 - By Application (US$ Million)
- Table 13. Europe Playout Solutions Market, Revenue and Forecast To 2028 - By Country (US$ Million)
- Table 14. Germany Playout Solutions Market, Revenue and Forecast to 2028 - By Component (US$ Million)
- Table 15. Germany Playout Solutions Market, Revenue and Forecast to 2028 - By Application (US$ Million)
- Table 16. UK Playout Solutions Market, Revenue and Forecast to 2028 - By Component (US$ Million)
- Table 17. UK Playout Solutions Market, Revenue and Forecast to 2028 - By Application (US$ Million)
- Table 18. France Playout Solutions Market, Revenue and Forecast to 2028 - By Component (US$ Million)
- Table 19. France Playout Solutions Market, Revenue and Forecast to 2028 - By Application (US$ Million)
- Table 20. Italy Playout Solutions Market, Revenue and Forecast to 2028 - By Component (US$ Million)
- Table 21. Italy Playout Solutions Market, Revenue and Forecast to 2028 - By Application (US$ Million)
- Table 22. Russia Playout Solutions Market, Revenue and Forecast to 2028 - By Component (US$ Million)
- Table 23. Russia Playout Solutions Market, Revenue and Forecast to 2028 - By Application (US$ Million)
- Table 24. Rest of Europe Playout Solutions Market, Revenue and Forecast to 2028 - By Component (US$ Million)
- Table 25. Rest of Europe Playout Solutions Market, Revenue and Forecast to 2028 - By Application (US$ Million)
- Table 26. Asia Pacific Playout Solutions Market, Revenue and Forecast To 2028 - By Component (US$ Million)
- Table 27. Asia Pacific Playout Solutions Market, Revenue and Forecast To 2028 - By Application (US$ Million)
- Table 28. Asia Pacific Playout Solutions Market, Revenue and Forecast To 2028 - By Country (US$ Million)
- Table 29. China Playout Solutions Market, Revenue and Forecast to 2028 - By Component (US$ Million)
- Table 30. China Playout Solutions Market, Revenue and Forecast to 2028 - By Application (US$ Million)
- Table 31. Japan Playout Solutions Market, Revenue and Forecast to 2028 - By Component (US$ Million)
- Table 32. Japan Playout Solutions Market, Revenue and Forecast to 2028 - By Application (US$ Million)
- Table 33. South Korea Playout Solutions Market, Revenue and Forecast to 2028 - By Component (US$ Million)
- Table 34. South Korea Playout Solutions Market, Revenue and Forecast to 2028 - By Application (US$ Million)
- Table 35. India Playout Solutions Market, Revenue and Forecast to 2028 - By Component (US$ Million)
- Table 36. India Playout Solutions Market, Revenue and Forecast to 2028 - By Application (US$ Million)
- Table 37. Australia Playout Solutions Market, Revenue and Forecast to 2028 - By Component (US$ Million)
- Table 38. Australia Playout Solutions Market, Revenue and Forecast to 2028 - By Application (US$ Million)
- Table 39. Rest of Asia Pacific Playout Solutions Market, Revenue and Forecast to 2028 - By Component (US$ Million)
- Table 40. Rest of Asia Pacific Playout Solutions Market, Revenue and Forecast to 2028 - By Application (US$ Million)
- Table 41. Middle East & Africa Playout Solutions Market, Revenue and Forecast To 2028 - By Component (US$ Million)
- Table 42. Middle East & Africa Playout Solutions Market, Revenue and Forecast To 2028 - By Application (US$ Million)
- Table 43. Middle East & Africa Playout Solutions Market, Revenue and Forecast To 2028 - By Country (US$ Million)
- Table 44. Saudi Arabia Playout Solutions Market, Revenue and Forecast to 2028 - By Component (US$ Million)
- Table 45. Saudi Arabia Playout Solutions Market, Revenue and Forecast to 2028 - By Application (US$ Million)
- Table 46. UAE Playout Solutions Market, Revenue and Forecast to 2028 - By Component (US$ Million)
- Table 47. UAE Playout Solutions Market, Revenue and Forecast to 2028 - By Application (US$ Million)
- Table 48. South Africa Playout Solutions Market, Revenue and Forecast to 2028 - By Component (US$ Million)
- Table 49. South Africa Playout Solutions Market, Revenue and Forecast to 2028 - By Application (US$ Million)
- Table 50. Rest of Middle East & Africa Playout Solutions Market, Revenue and Forecast to 2028 - By Component (US$ Million)
- Table 51. Rest of Middle East & Africa Playout Solutions Market, Revenue and Forecast to 2028 - By Application (US$ Million)
- Table 52. South America Playout Solutions Market, Revenue and Forecast To 2028 - By Component (US$ Million)
- Table 53. South America Playout Solutions Market, Revenue and Forecast To 2028 - By Application (US$ Million)
- Table 54. South America Playout Solutions Market, Revenue and Forecast To 2028 - By Country (US$ Million)
- Table 55. Brazil Playout Solutions Market, Revenue and Forecast to 2028 - By Component (US$ Million)
- Table 56. Brazil Playout Solutions Market, Revenue and Forecast to 2028 - By Application (US$ Million)
- Table 57. Argentina Playout Solutions Market, Revenue and Forecast to 2028 - By Component (US$ Million)
- Table 58. Argentina Playout Solutions Market, Revenue and Forecast to 2028 - By Application (US$ Million)
- Table 59. Rest of SAM Playout Solutions Market, Revenue and Forecast to 2028 - By Component (US$ Million)
- Table 60. Rest of SAM Playout Solutions Market, Revenue and Forecast to 2028 - By Application (US$ Million)
- Table 61. List of Abbreviation
List Of Figures
- Figure 1. Playout Solutions Market Segmentation
- Figure 2. Playout Solutions Market Segmentation - By Geography
- Figure 3. Global Playout Solutions Market Overview
- Figure 4. Software Segment held the Largest Share of Playout Solutions Market
- Figure 5. Entertainment Segment held the Largest Share of Playout Solutions Market
- Figure 6. North America to Show Great Traction During Forecast Period
- Figure 7. North America: PEST Analysis
- Figure 8. Europe: PEST Analysis
- Figure 9. APAC: PEST Analysis
- Figure 10. Middle East & Africa: PEST Analysis
- Figure 11. SAM: PEST Analysis
- Figure 12. Expert Opinion
- Figure 13. Playout Solutions Market Impact Analysis of Drivers and Restraints
- Figure 14. Geographic Overview of Playout Solutions Market
- Figure 15. Playout Solutions Market - Revenue and Forecast to 2028 (US$ Million)
- Figure 16. Playout Solutions Market Revenue Share, By Component (2022 and 2028)
- Figure 17. Software: Playout Solutions Market - Revenue, and Forecast to 2028 (US$ Million)
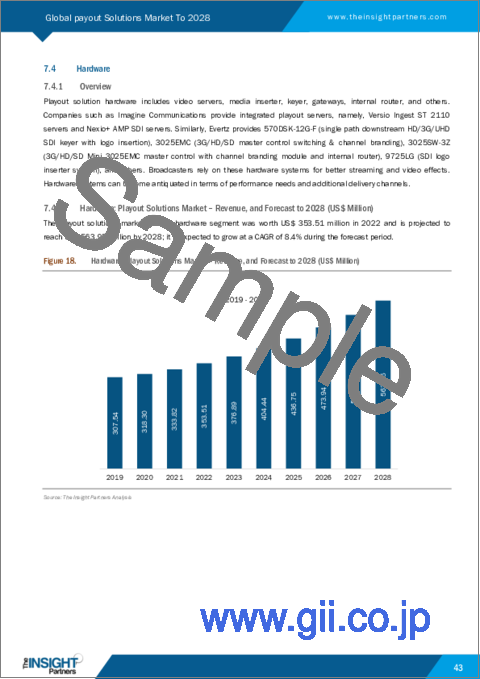
- Figure 18. Hardware: Playout Solutions Market - Revenue, and Forecast to 2028 (US$ Million)
- Figure 19. Services: Playout Solutions Market - Revenue, and Forecast to 2028 (US$ Million)
- Figure 20. Playout Solutions Market Revenue Share, By Application (2022 and 2028)
- Figure 21. Entertainment: Playout Solutions Market- Revenue and Forecast to 2028 (US$ Million)
- Figure 22. News: Playout Solutions Market- Revenue and Forecast to 2028 (US$ Million)
- Figure 23. Sports: Playout Solutions Market- Revenue and Forecast to 2028 (US$ Million)
- Figure 24. Fashion & Lifestyle: Playout Solutions Market- Revenue and Forecast to 2028 (US$ Million)
- Figure 25. Others: Playout Solutions Market- Revenue and Forecast to 2028 (US$ Million)
- Figure 26. Global Playout Solutions Market Breakdown, by Region, 2022 & 2028 (%)
- Figure 27. North America Playout Solutions Market, Revenue and Forecast to 2028 (US$ Million)
- Figure 28. North America Playout Solutions Market Breakdown, By Component, 2022 & 2028 (%)
- Figure 29. North America Playout Solutions Market Breakdown, By Application, 2022 & 2028 (%)
- Figure 30. North America Playout Solutions Market Breakdown, by Country, 2022 & 2028 (%)
- Figure 31. US Playout Solutions Market, Revenue and Forecast to 2028 (US$ Million)
- Figure 32. Canada Playout Solutions Market, Revenue and Forecast to 2028 (US$ Million)
- Figure 33. Mexico Playout Solutions Market, Revenue and Forecast to 2028 (US$ Million)
- Figure 34. Europe Playout Solutions Market, Revenue and Forecast to 2028 (US$ Million)
- Figure 35. Europe Playout Solutions Market Breakdown, By Component, 2022 & 2028 (%)
- Figure 36. Europe Playout Solutions Market Breakdown, By Application, 2022 & 2028 (%)
- Figure 37. Europe Playout Solutions Market Breakdown, by Country, 2022 & 2028 (%)
- Figure 38. Germany Playout Solutions Market, Revenue and Forecast to 2028 (US$ Million)
- Figure 39. UK Playout Solutions Market, Revenue and Forecast to 2028 (US$ Million)
- Figure 40. France Playout Solutions Market, Revenue and Forecast to 2028 (US$ Million)
- Figure 41. Italy Playout Solutions Market, Revenue and Forecast to 2028 (US$ Million)
- Figure 42. Russia Playout Solutions Market, Revenue and Forecast to 2028 (US$ Million)
- Figure 43. Rest of Europe Playout Solutions Market, Revenue and Forecast to 2028 (US$ Million)
- Figure 44. Asia Pacific Playout Solutions Market, Revenue and Forecast to 2028 (US$ Million)
- Figure 45. Asia Pacific Playout Solutions Market Breakdown, By Component, 2022 & 2028 (%)
- Figure 46. Asia Pacific Playout Solutions Market Breakdown, By Application, 2022 & 2028 (%)
- Figure 47. Asia Pacific Playout Solutions Market Breakdown, by Country, 2022 & 2028 (%)
- Figure 48. China Playout Solutions Market, Revenue and Forecast to 2028 (US$ Million)
- Figure 49. Japan Playout Solutions Market, Revenue and Forecast to 2028 (US$ Million)
- Figure 50. South Korea Playout Solutions Market, Revenue and Forecast to 2028 (US$ Million)
- Figure 51. India Playout Solutions Market, Revenue and Forecast to 2028 (US$ Million)
- Figure 52. Australia Playout Solutions Market, Revenue and Forecast to 2028 (US$ Million)
- Figure 53. Rest of Asia Pacific Playout Solutions Market, Revenue and Forecast to 2028 (US$ Million)
- Figure 54. Middle East & Africa Playout Solutions Market, Revenue and Forecast to 2028 (US$ Million)
- Figure 55. Middle East & Africa Playout Solutions Market Breakdown, By Component, 2022 & 2028 (%)
- Figure 56. Middle East & Africa Playout Solutions Market Breakdown, By Application, 2022 & 2028 (%)
- Figure 57. Middle East & Africa Playout Solutions Market Breakdown, by Country, 2022 & 2028 (%)
- Figure 58. Saudi Arabia Playout Solutions Market, Revenue and Forecast to 2028 (US$ Million)
- Figure 59. UAE Playout Solutions Market, Revenue and Forecast to 2028 (US$ Million)
- Figure 60. South Africa Playout Solutions Market, Revenue and Forecast to 2028 (US$ Million)
- Figure 61. Rest of Middle East & Africa Playout Solutions Market, Revenue and Forecast to 2028 (US$ Million)
- Figure 62. South America Playout Solutions Market, Revenue and Forecast to 2028 (US$ Million)
- Figure 63. South America Playout Solutions Market Breakdown, By Component, 2022 & 2028 (%)
- Figure 64. South America Playout Solutions Market Breakdown, By Application, 2022 & 2028 (%)
- Figure 65. South America Playout Solutions Market Breakdown, by Country, 2022 & 2028 (%)
- Figure 66. Brazil Playout Solutions Market, Revenue and Forecast to 2028 (US$ Million)
- Figure 67. Argentina Playout Solutions Market, Revenue and Forecast to 2028 (US$ Million)
- Figure 68. Rest of SAM Playout Solutions Market, Revenue and Forecast to 2028 (US$ Million)
- Figure 69. Impact of COVID-19 Pandemic in Regional Markets
The playout solutions market is projected to grow from US$ 1,169.02 million in 2022 to US$ 1,892.26 million by 2028; it is estimated to record a CAGR of 8.7% from 2023 to 2028.
A few structural changes in the media & broadcast industry leads to increasing customer interest and technical advances. As a part of the television industry's evolution, broadcasters are opting for innovative technologies to respond rapidly to commercial opportunities. The demand for innovative technologies to provide higher quality display and flexible content management based on metadata has increased among various industries. Playout solutions are implemented in broadcasting for the advanced transmission of TV channels or radio content. The playout solutions market is witnessing significant growth owing to the increasing demand for personalized broadcast services across the globe. Additionally, rising demand for cloud-based playout solutions is driving the market. However, the complexity of its integration and privacy concerns are hampering the playout solutions market growth. Further, the introduction of 5G technology is likely to provide lucrative opportunities for the playout solutions market growth. Also, the demand for terrestrial television is expected to emerge as a significant trend in the playout solutions market over the forecast period.
For the entertainment industry, manufacturers such as Encompass produce a linear channel automatically with SCTE messages, marking the beginning and end of the program section and advertising and including high-quality metadata. This allows framing correct source files output such as AVOD, SVOD, Live-to-VOD, and digital ad insertion. Dynamic process and workflow automation allow users to monitor content more efficiently and reach more customers with reduced overall costs. Muvi Playout is a new app from Muvi that allows consumers to build their scheduled live on an OTT TV channel using an easy-to-use scheduler; it opens another source of interaction for the audience. The app helps to build a simple schedule for all the on-demand content and makes the OTT platform run like a linear TV network. Muvi Playout also allows the detection of different time zones as well as creation of separate channels for various time zones. Thus, this feature makes it easy to collect information associated with the most-watched content by different audiences across multiple geographies while producing shows. Companies such as Amazon Web Services, Netflix, and Amazon Prime video solutions allow providers to focus on content, thereby offering consumers a great user experience for broadcast playout, OTT, etc.
The sports channel applications (apps) developed by the playout solution developers help in managing sports channels-the playout software help in catering applications such as game scoreboard. Flexible playout solutions provide complete channel automation to broadcast one or two matches simultaneously, along with graphical details, advertisements, and multisource import data. For instance, the playout solution provided by Aveco controls sponsored graphics, asynchronous ads, time squeeze of programs to expand ad space without removing content, and management of sponsored anchor sentences. Avecois is one of the leading players engaged in automating some of the most complex and largest sports networks in the world, and it can assist in scale-down operations to manage small sports networks cost-effectively. The playout solution software for sports also provides templates that are ready to use and manages the game scoreboard and others.
The playout solutions market is segmented based on component, application, and geography. Based on component, the playout solutions market is categorized into hardware, software, and services. Based on application, the playout solutions market is segmented into sports, news, entertainment, lifestyle and fashion, and others. By geography, the playout solutions market is segmented into North America, Europe, Asia Pacific, the Middle East & Africa, and South America.
Amagi, Evertz, BroadStream Solutions, Harmonic Inc, Belden Incorporated (Grass Valley), Imagine Communications, Pebble Beach Systems, Pixel Power, Playbox Technology, and Florical Systems are among the key market players operating in the playout solutions market that are profiled in this market study.
The overall playout solutions market size has been derived using both primary and secondary sources. Exhaustive secondary research has been conducted using internal and external sources to obtain qualitative and quantitative information related to the playout solutions market. The process also helps obtain an overview and forecast of the market with respect to all the market segments. Also, multiple primary interviews have been conducted with industry participants to validate the data and gain analytical insights. This process includes industry experts such as VPs, business development managers, market intelligence managers, and national sales managers, along with external consultants such as valuation experts, research analysts, and key opinion leaders, specializing in the playout solutions market.
Reasons to Buy:
- Save and reduce time carrying out entry-level research by identifying the growth, size, leading players and segments in the global playout solutions market
- Highlights key business priorities in order to assist companies to realign their business strategies
- The key findings and recommendations highlight crucial progressive industry trends in the global playout solutions market, thereby allowing players across the value chain to develop effective long-term strategies
- Develop/modify business expansion plans by using substantial growth offering developed and emerging markets
- Scrutinize in-depth global market trends and outlook coupled with the factors driving the market, as well as those hindering it
- Enhance the decision-making process by understanding the strategies that underpin commercial interest with respect to client products, segmentation, pricing and distribution
Table Of Contents
1. Introduction
- 1.1 Study Scope
- 1.2 The Insight Partners Research Report Guidance
- 1.3 Market Segmentation
- 1.3.1 Playout Solutions Market - By Component
- 1.3.2 Playout Solutions Market - By Application
- 1.3.3 Playout Solutions Market- By Region
2. Key Takeaways
3. Research Methodology
- 3.1 Coverage
- 3.2 Secondary Research
- 3.3 Primary Research
4. Playout Solutions Market Landscape
- 4.1 Market Overview
- 4.2 PEST Analysis
- 4.2.1 North America
- 4.2.2 Europe
- 4.2.3 APAC
- 4.2.4 MEA
- 4.2.5 SAM
- 4.3 Ecosystem Analysis
- 4.4 Expert Opinion
5. Playout Solutions Market - Key Market Dynamics
- 5.1 Market Drivers
- 5.1.1 Increase in Demand for Personalized Broadcasting Services
- 5.1.2 Rise in Cloud-Based Playout Solutions
- 5.2 Restraint
- 5.2.1 Complexity in Integration and Privacy Concerns
- 5.3 Opportunity
- 5.3.1 Introduction of 5G Technology
- 5.4 Future Trend
- 5.4.1 Demand for Terrestrial Television
- 5.5 Impact Analysis of Drivers and Restraints
6. Playout Solutions Market - Global Analysis
- 6.1 Global Playout Solutions Market Overview
- 6.2 Playout Solutions Market - Revenue and Forecast to 2028 (US$ Million)
- 6.3 Market Positioning - Five Key Players
7. Playout Solutions Market Analysis - By Component
- 7.1 Overview
- 7.2 Playout Solutions Market, By Component (2022 and 2028)
- 7.3 Software
- 7.3.1 Overview
- 7.3.2 Software: Playout Solutions Market - Revenue, and Forecast to 2028 (US$ Million)
- 7.4 Hardware
- 7.4.1 Overview
- 7.4.2 Hardware: Playout Solutions Market - Revenue, and Forecast to 2028 (US$ Million)
- 7.5 Services
- 7.5.1 Overview
- 7.5.2 Services: Playout Solutions Market - Revenue, and Forecast to 2028 (US$ Million)
8. Playout Solutions Market Analysis - By Application
- 8.1 Overview
- 8.2 Playout Solutions Market, By Application (2022 and 2028)
- 8.3 Entertainment
- 8.3.1 Overview
- 8.3.2 Entertainment: Playout Solutions Market- Revenue and Forecast to 2028 (US$ Million)
- 8.4 News
- 8.4.1 Overview
- 8.4.2 News: Playout Solutions Market- Revenue and Forecast to 2028 (US$ Million)
- 8.5 Sports
- 8.5.1 Overview
- 8.5.2 Sports: Playout Solutions Market- Revenue and Forecast to 2028 (US$ Million)
- 8.6 Fashion & Lifestyle
- 8.6.1 Overview
- 8.6.2 Fashion & Lifestyle: Playout Solutions Market- Revenue and Forecast to 2028 (US$ Million)
- 8.7 Others
- 8.7.1 Overview
- 8.7.2 Others: Playout Solutions Market- Revenue and Forecast to 2028 (US$ Million)
9. Playout Solutions Market - Geographic Analysis
- 9.1 Overview
- 9.2 North America: Playout Solutions Market
- 9.2.1 Overview
- 9.2.2 North America Playout Solutions Market, Revenue and Forecast to 2028 (US$ Million)
- 9.2.3 North America Playout Solutions Market Breakdown, By Component
- 9.2.4 North America Playout Solutions Market Breakdown, By Application
- 9.2.5 North America Playout Solutions Market Breakdown, by Country
- 9.2.5.1 US Playout Solutions Market, Revenue and Forecast to 2028
- 9.2.5.1.1 US Playout Solutions Market Breakdown, By Component
- 9.2.5.1.2 US Playout Solutions Market Breakdown, By Application
- 9.2.5.2 Canada Playout Solutions Market, Revenue and Forecast to 2028
- 9.2.5.2.1 Canada Playout Solutions Market Breakdown, By Component
- 9.2.5.2.2 Canada Playout Solutions Market Breakdown, By Application
- 9.2.5.3 Mexico Playout Solutions Market, Revenue and Forecast to 2028
- 9.2.5.3.1 Mexico Playout Solutions Market Breakdown, By Component
- 9.2.5.3.2 Mexico Playout Solutions Market Breakdown, By Application
- 9.2.5.1 US Playout Solutions Market, Revenue and Forecast to 2028
- 9.3 Europe: Playout Solutions Market
- 9.3.1 Overview
- 9.3.2 Europe Playout Solutions Market, Revenue and Forecast to 2028 (US$ Million)
- 9.3.3 Europe Playout Solutions Market Breakdown, By Component
- 9.3.4 Europe Playout Solutions Market Breakdown, By Application
- 9.3.5 Europe Playout Solutions Market Breakdown, by Country
- 9.3.5.1 Germany Playout Solutions Market, Revenue and Forecast to 2028
- 9.3.5.1.1 Germany Playout Solutions Market Breakdown, By Component
- 9.3.5.1.2 Germany Playout Solutions Market Breakdown, By Application
- 9.3.5.2 UK Playout Solutions Market, Revenue and Forecast to 2028
- 9.3.5.2.1 UK Playout Solutions Market Breakdown, By Component
- 9.3.5.2.2 UK Playout Solutions Market Breakdown, By Application
- 9.3.5.3 France Playout Solutions Market, Revenue and Forecast to 2028
- 9.3.5.3.1 France Playout Solutions Market Breakdown, By Component
- 9.3.5.3.2 France Playout Solutions Market Breakdown, By Application
- 9.3.5.4 Italy Playout Solutions Market, Revenue and Forecast to 2028
- 9.3.5.4.1 Italy Playout Solutions Market Breakdown, By Component
- 9.3.5.4.2 Italy Playout Solutions Market Breakdown, By Application
- 9.3.5.5 Russia Playout Solutions Market, Revenue and Forecast to 2028
- 9.3.5.5.1 Russia Playout Solutions Market Breakdown, By Component
- 9.3.5.5.2 Russia Playout Solutions Market Breakdown, By Application
- 9.3.5.6 Rest of Europe Playout Solutions Market, Revenue and Forecast to 2028
- 9.3.5.6.1 Rest of Europe Playout Solutions Market Breakdown, By Component
- 9.3.5.6.2 Rest of Europe Playout Solutions Market Breakdown, By Application
- 9.3.5.1 Germany Playout Solutions Market, Revenue and Forecast to 2028
- 9.4 Asia Pacific: Playout Solutions Market
- 9.4.1 Overview
- 9.4.2 Asia Pacific Playout Solutions Market, Revenue and Forecast to 2028 (US$ Million)
- 9.4.3 Asia Pacific Playout Solutions Market Breakdown, By Component
- 9.4.4 Asia Pacific Playout Solutions Market Breakdown, By Application
- 9.4.5 Asia Pacific Playout Solutions Market Breakdown, by Country
- 9.4.5.1 China Playout Solutions Market, Revenue and Forecast to 2028
- 9.4.5.1.1 China Playout Solutions Market Breakdown, By Component
- 9.4.5.1.2 China Playout Solutions Market Breakdown, By Application
- 9.4.5.2 Japan Playout Solutions Market, Revenue and Forecast to 2028
- 9.4.5.2.1 Japan Playout Solutions Market Breakdown, By Component
- 9.4.5.2.2 Japan Playout Solutions Market Breakdown, By Application
- 9.4.5.3 South Korea Playout Solutions Market, Revenue and Forecast to 2028
- 9.4.5.3.1 South Korea Playout Solutions Market Breakdown, By Component
- 9.4.5.3.2 South Korea Playout Solutions Market Breakdown, By Application
- 9.4.5.4 India Playout Solutions Market, Revenue and Forecast to 2028
- 9.4.5.4.1 India Playout Solutions Market Breakdown, By Component
- 9.4.5.4.2 India Playout Solutions Market Breakdown, By Application
- 9.4.5.5 Australia Playout Solutions Market, Revenue and Forecast to 2028
- 9.4.5.5.1 Australia Playout Solutions Market Breakdown, By Component
- 9.4.5.5.2 Australia Playout Solutions Market Breakdown, By Application
- 9.4.5.6 Rest of Asia Pacific Playout Solutions Market, Revenue and Forecast to 2028
- 9.4.5.6.1 Rest of Asia Pacific Playout Solutions Market Breakdown, By Component
- 9.4.5.6.2 Rest of Asia Pacific Playout Solutions Market Breakdown, By Application
- 9.4.5.1 China Playout Solutions Market, Revenue and Forecast to 2028
- 9.5 Middle East & Africa: Playout Solutions Market
- 9.5.1 Overview
- 9.5.2 Middle East & Africa Playout Solutions Market, Revenue and Forecast to 2028 (US$ Million)
- 9.5.3 Middle East & Africa Playout Solutions Market Breakdown, By Component
- 9.5.4 Middle East & Africa Playout Solutions Market Breakdown, By Application
- 9.5.5 Middle East & Africa Playout Solutions Market Breakdown, by Country
- 9.5.5.1 Saudi Arabia Playout Solutions Market, Revenue and Forecast to 2028
- 9.5.5.1.1 Saudi Arabia Playout Solutions Market Breakdown, By Component
- 9.5.5.1.2 Saudi Arabia Playout Solutions Market Breakdown, By Application
- 9.5.5.2 UAE Playout Solutions Market, Revenue and Forecast to 2028
- 9.5.5.2.1 UAE Playout Solutions Market Breakdown, By Component
- 9.5.5.2.2 UAE Playout Solutions Market Breakdown, By Application
- 9.5.5.3 South Africa Playout Solutions Market, Revenue and Forecast to 2028
- 9.5.5.3.1 South Africa Playout Solutions Market Breakdown, By Component
- 9.5.5.3.2 South Africa Playout Solutions Market Breakdown, By Application
- 9.5.5.4 Rest of Middle East & Africa Playout Solutions Market, Revenue and Forecast to 2028
- 9.5.5.4.1 Rest of Middle East & Africa Playout Solutions Market Breakdown, By Component
- 9.5.5.4.2 Rest of Middle East & Africa Playout Solutions Market Breakdown, By Application
- 9.5.5.1 Saudi Arabia Playout Solutions Market, Revenue and Forecast to 2028
- 9.6 South America: Playout Solutions Market
- 9.6.1 Overview
- 9.6.2 South America Playout Solutions Market, Revenue and Forecast to 2028 (US$ Million)
- 9.6.3 South America Playout Solutions Market Breakdown, By Component
- 9.6.4 South America Playout Solutions Market Breakdown, By Application
- 9.6.5 South America Playout Solutions Market Breakdown, by Country
- 9.6.5.1 Brazil Playout Solutions Market, Revenue and Forecast to 2028
- 9.6.5.1.1 Brazil Playout Solutions Market Breakdown, By Component
- 9.6.5.1.2 Brazil Playout Solutions Market Breakdown, By Application
- 9.6.5.2 Argentina Playout Solutions Market, Revenue and Forecast to 2028
- 9.6.5.2.1 Argentina Playout Solutions Market Breakdown, By Component
- 9.6.5.2.2 Argentina Playout Solutions Market Breakdown, By Application
- 9.6.5.3 Rest of SAM Playout Solutions Market, Revenue and Forecast to 2028
- 9.6.5.3.1 Rest of SAM Playout Solutions Market Breakdown, By Component
- 9.6.5.3.2 Rest of SAM Playout Solutions Market Breakdown, By Application
- 9.6.5.1 Brazil Playout Solutions Market, Revenue and Forecast to 2028
10. Impact of COVID-19 Pandemic on Global Playout Solutions Market
- 10.1 Overview
11. Industry Landscape
- 11.1 Overview
- 11.2 Market Initiative
- 11.3 New Product Development
- 11.4 Merger and Acquisition
12. Company Profiles
- 12.1 Amagi
- 12.1.1 Key Facts
- 12.1.2 Business Description
- 12.1.3 Products and Services
- 12.1.4 Financial Overview
- 12.1.5 SWOT Analysis
- 12.1.6 Key Developments
- 12.2 Evertz
- 12.2.1 Key Facts
- 12.2.2 Business Description
- 12.2.3 Products and Services
- 12.2.4 Financial Overview
- 12.2.5 SWOT Analysis
- 12.2.6 Key Developments
- 12.3 BroadStream Solutions
- 12.3.1 Key Facts
- 12.3.2 Business Description
- 12.3.3 Products and Services
- 12.3.4 Financial Overview
- 12.3.5 SWOT Analysis
- 12.3.6 Key Developments
- 12.4 Harmonic Inc
- 12.4.1 Key Facts
- 12.4.2 Business Description
- 12.4.3 Products and Services
- 12.4.4 Financial Overview
- 12.4.5 SWOT Analysis
- 12.4.6 Key Developments
- 12.5 Belden Incorporated (Grass Valley)
- 12.5.1 Key Facts
- 12.5.2 Business Description
- 12.5.3 Products and Services
- 12.5.4 Financial Overview
- 12.5.5 SWOT Analysis
- 12.5.6 Key Developments
- 12.6 Imagine Communications
- 12.6.1 Key Facts
- 12.6.2 Business Description
- 12.6.3 Products and Services
- 12.6.4 Financial Overview
- 12.6.5 SWOT Analysis
- 12.6.6 Key Developments
- 12.7 Pebble Beach Systems
- 12.7.1 Key Facts
- 12.7.2 Business Description
- 12.7.3 Products and Services
- 12.7.4 Financial Overview
- 12.7.5 SWOT Analysis
- 12.7.6 Key Developments
- 12.8 Pixel Power
- 12.8.1 Key Facts
- 12.8.2 Business Description
- 12.8.3 Products and Services
- 12.8.4 Financial Overview
- 12.8.5 SWOT Analysis
- 12.8.6 Key Developments
- 12.9 Playbox Technology
- 12.9.1 Key Facts
- 12.9.2 Business Description
- 12.9.3 Products and Services
- 12.9.4 Financial Overview
- 12.9.5 SWOT Analysis
- 12.9.6 Key Developments
- 12.10 Florical Systems
- 12.10.1 Key Facts
- 12.10.2 Business Description
- 12.10.3 Products and Services
- 12.10.4 Financial Overview
- 12.10.5 SWOT Analysis
- 12.10.6 Key Developments
13. Appendix
- 13.1 About The Insight Partners
- 13.2 Word Index