|
|
市場調査レポート
商品コード
1240653
コーンビームCT市場の2028年までの予測-タイプ、用途、エンドユーザー別の世界分析Cone Beam Computed Tomography Market Forecast to 2028 - COVID-19 Impact and Global Analysis By Type, Application, and End User |
||||||
|
|
|||||||


| コーンビームCT市場の2028年までの予測-タイプ、用途、エンドユーザー別の世界分析 |
|
出版日: 2023年02月21日
発行: The Insight Partners
ページ情報: 英文 199 Pages
納期: 即納可能
|
- 全表示
- 概要
- 図表
- 目次
コーンビームCT市場は、2022年の12億1,451万米ドルから2028年には22億7,841万米ドルに達すると予測され、2022年から2028年にかけて11.1%のCAGRで成長すると予測されています。
歯科疾患の症例の増加や、コーンビームCT装置へのソフトウェアツールの統合が、市場を強化する主な要因の1つです。しかし、初期費用やメンテナンス費用が高いことが、コーンビームCT市場の成長を妨げています。
コーンビームCTは、従来のコンピュータ断層撮影装置(CT)を改良したものです。歯科医師が使用するコーンビームCTシステムは、患者の周りを回転し、円錐形のX線ビームを使用してデータを取得します。これらのデータは、歯科(歯)、口腔・顎顔面領域(口、顎、首)、耳、鼻、喉の3次元画像を再構築するために使用されます。
歯科疾患は、最も一般的な非伝染性疾患(NCDs)であり、生涯を通じて人々に影響を与えます。世界保健機関(WHO)による「Global Oral Health Status Report 2022」では、口腔疾患は世界で~35億人に影響を与え、4人に3人が中所得国に住んでいると推定しています。最も重要な口腔疾患の有病率は、世界中のライフスタイルの変化とともに増加し続けています。米国疾病管理予防センター(CDC)によると、子供の85%以上、成人(65歳以上を含む)の65%以上が様々な歯科疾患を持っています。また、歯の損傷、口腔内や歯並びの乱れなどの要因による外傷も多く見られます。WHOによると、~20%の人が、人生のある時点で、このような口腔領域の外傷を経験しています。2021年7月に発表された研究報告でNguyen Van Chuyenらが述べているように、う蝕は世界の健康問題です。さらに、2021年10月にDentistry Journalに掲載されたレポートによると、不正咬合は、歯周炎や虫歯と並んで、最も重要な歯の健康問題のひとつと考えられています。WHOは、不正咬合の有病率は非常に変動が大きいと考えており、小児と青年ではそれぞれ39%、93%と推定されています。不正咬合の有病率は今後数年で上昇すると予測されており、それによって見えない矯正歯科の需要が高まり、それがコーンビームCT市場を押し上げることになります。歯科治療は、デジタル画像処理技術の助けを借りて行われます。CBCTは、解剖学的な特徴付けを行い、画像を通して歯科インプラントの特定の異常を発見するのに役立ちます。さらに、歯科医師にとって、よりインタラクティブで簡単な処置を行うのに役立ちます。したがって、歯科疾患の有病率の増加は、コーンビームCT市場の成長を後押しします。
コーンビームCTは、歯科、顎顔面外科、耳鼻咽喉科、リウマチ科、外傷科などで広く採用されています。コーンビームCTは、矯正歯科や歯周病科で有用な3D画像を生成するため、従来のX線撮影に比べて文句なしの優位性を持っています。さらに、装置の品質は、耳鼻咽喉科や再建頭頸部外科におけるコーンビームCTの有用性に影響を与える重要な側面の1つです。さらに、紹介者数や撮影を依頼される解剖学的領域の種類も増加しています。コーンビームCTは、コーンビームX線とフラットパネル検出器をベースにした新しい乳房専用CTイメージング技術で、乳房イメージングに新しい章を開きました。この革新的なモダリティは、乳房の高密度組織や重なり合う構造の検査に用いられる現在の画像技術の限界を克服するのに役立ちます。このような利点は、乳がんによる罹患率や死亡率の減少につながる可能性があります。また、機能的な画像診断のための造影剤の投与が容易になります。
コーンビームCTは、従来のCTに比べて放射線量が少なく、費用も安いため、慢性副鼻腔炎の診断に使用されています。コーンビームCTでは、空気、膜、骨の密度が明確に区別されるため、解剖学的構造とその空気圧を可視化することができます。また、単純な粘膜の肥厚、嚢胞、ポリープ、体液の貯留を区別することができず、炎症の可視化にも役立ちます。CBCTは、耳小骨を中心とした中耳病変の調査にも使用されています。耳鼻咽喉科では、残存聴力の維持に極めて重要な蝸牛の詳細寸法や内耳の人工内耳電極の位置の評価にコーンビームCTが使用されています。
整形外科では、コーンビームCTスキャナーを使用することで、より高度な患者さんのポジショニングが可能になります。コーンビームCTスキャナーは、放射線量の数分の一で、より速く、より正確な3次元イメージングを可能にします。この新しいスキャナーは、撮影装置の小型化により、CT撮影を放射線科から臨床室、救急室、地域施設、手術室へと広げることができます。また、患者さんが立っている状態で撮影するため、縦に並べることが可能です。体重をかけた状態で撮影することで、一部の病態をより鮮明に映し出すことができます。したがって、ヘルスケアのさまざまな分野におけるコーンビームCTの応用範囲の拡大は、将来的に世界のコーンビームCT市場関係者に成長機会をもたらすと予想されます。
患者ポジショニングの洞察
患者の体位に基づき、コーンビームCT市場は立位、座位、仰臥位で区分されます。2021年には立位が最大の市場シェアを占めたが、予測期間(2022-2028年)には座位が11.2%の最高CAGRを記録すると予測されます。CBCTスキャンは、さまざまな姿勢の患者に対して取得することができます。立位での画像取得を可能にするCBCTハードウェアは、スペースが少なくて済むため、特に歯科、歯列矯正、顎顔面ユニットにおいて魅力的です。しかし、立位では不随意運動が発生するため、画像にアーチファクトが発生します。歯科・顎顔面科の医師は、これらの装置の最適なスペース要件のため、患者が立位で画像取得を行うことを好むことが多いです。
用途の洞察
用途については、コーンビームCT市場は歯科、耳鼻咽喉科、乳がん、頭蓋底、整形外科の各用途に分けられます。2021年の市場では、歯科セグメントが最大のシェアを占めています。ENTセグメントのコーンビームコンピュータトモグラフィー市場は、予測期間中に11.9%という最高のCAGRで成長すると予想されます。高品質のコーンビームCTスキャンは、術後、中耳、内耳の人工内耳の可視化と評価、(内耳の)合流管の可視化、術中の側頭骨手術のガイダンスに役立つ。優れた画質、有効性、再現性、少ない放射線被曝は、コーンビームCT画像の特徴であり、耳鼻咽喉科における従来の画像診断法に代わる魅力的な手法となっています。この技術は、耳鼻咽喉科における本来のX線法に徐々に取って代わろうとしている、としています。コーンビームCTは、副鼻腔病理、顎顔面および鼻の外傷評価、人工内耳の可視化、中・内耳奇形および耳小骨鎖奇形診断、閉塞性睡眠時無呼吸検査などのENT用途で使用することができます。
目次
第1章 イントロダクション
- 調査対象範囲
- 洞察パートナーズ調査報告書ガイダンス
- 市場セグメンテーション
- コーンビームCTの世界市場- 患者の位置決め別
- コーンビームCTの世界市場-用途別
- コーンビームCTの世界市場-エンドユーザー別
- コーンビームCTの世界市場-地域別
第2章 コーンビームCT市場-重要ポイント
第3章 調査手法
- カバレッジ
- 2次調査について
- 1次調査について
第4章 コーンビームCT市場- 市場情勢
- PEST分析
- 北米PEST分析
- 欧州PEST分析
- アジア太平洋PEST分析
- 中南米PEST分析
- 中東・アフリカPEST分析
- 専門家の見解
第5章 コーンビームCT市場-主要な市場力学
- 市場促進要因
- 歯科疾患患者の増加
- CBCT装置へのソフトウェアツールの組み込み
- 市場抑制要因
- 高い初期コストとメンテナンスコスト
- 市場機会
- 広がるCBCTデバイスの応用領域
- 今後の動向について
- 技術の進歩・研究開発
- 影響度分析
第6章 コーンビームCT市場-世界分析
- コーンビームCTの世界市場収益と予測・分析
- コーンビームCTの世界市場、地域別- 予測と分析
- 主要プレイヤーのマーケットポジショニング
第7章 コーンビームCTの世界市場分析と2028年までの予測-患者体位別
- コーンビームCT市場の収益シェア:患者ポジショニング別、2021年・2028年(%)
- 立位
- 座位
- 仰臥位
第8章 コーンビームCTの世界市場分析と2028年までの予測-用途別
- コーンビームCTの世界市場:用途別2021年・2028年(%)
- デンタル
- 耳鼻咽喉科
- 乳がん
- 整形外科
- 頭蓋底
- その他
第9章 コーンビームCTの世界市場の分析と2028年までの予測-エンドユーザー別
- コーンビームCTの世界市場:エンドユーザー別、2021年・2028年(%)
- 病院・診療所
- 診断センター
- その他
第10章 コーンビームCT市場-2028年までの収益と予測-地域分析
- 北米
- 米国
- カナダ
- メキシコ
- 欧州
- 英国
- ドイツ
- フランス
- イタリア
- スペイン
- その他欧州
- アジア太平洋地域
- 概要1
- 中国
- 日本
- インド
- 韓国
- オーストラリア
- その他アジア太平洋地域
- 概要1
- 中東・アフリカ地域
- 概要3
- UAE
- サウジアラビア
- 南アフリカ
- その他中東・アフリカ地域
- 概要3
- 中南米
- 概要9
- ブラジル
- アルゼンチン
- その他南米・中米
- 概要9
第11章 COVID-19パンデミックのコーンビームCT市場に対する影響2
- 北アメリカ2
- 欧州4
- アジア太平洋地域6
- 中東・アフリカ8
- 南米・中米0
第12章 コーンビームCT市場- 産業の展望2
- 概要2
- コーンビームCT市場の成長戦略2
- インオーガニックな成長戦略3
- 概要3
- オーガニックグロース戦略3
- 概要3
第13章 企業プロファイル
- Dentsply Sirona Inc4
- Newtom8
- Carestream Dental LLC.0
- Fussen Group2
- PreXion4
- Brainlab AG6
- IDETEC MEDICAL IMAGING8
- Vatech Co., Ltd.0
- Planmeca Oy2
- Canon Medical Systems4
List Of Tables
- Table 1. North America Cone Beam Computed Tomography Market, by Patient Positioning - Revenue and Forecast to 2028 (US$ Million)
- Table 2. North America Cone Beam Computed Tomography Market, by Application - Revenue and Forecast to 2028 (US$ Million)
- Table 3. North America: Cone Beam Computed Tomography Market, by Dental - Revenue and Forecast to 2028 (US$ Million)
- Table 4. North America Cone Beam Computed Tomography Market, by End User - Revenue and Forecast to 2028 (US$ Million)
- Table 5. US Cone Beam Computed Tomography Market, by Patient Positioning - Revenue and Forecast to 2028 (US$ Million)
- Table 6. US Cone Beam Computed Tomography Market, by Application - Revenue and Forecast to 2028 (US$ Million)
- Table 7. US: Cone Beam Computed Tomography Market, by Dental - Revenue and Forecast to 2028 (US$ Million)
- Table 8. US Cone Beam Computed Tomography Market, by End User - Revenue and Forecast to 2028 (US$ Million)
- Table 9. Canada Cone Beam Computed Tomography Market, by Patient Positioning - Revenue and Forecast to 2028 (US$ Million)
- Table 10. Canada Cone Beam Computed Tomography Market, by Application - Revenue and Forecast to 2028 (US$ Million)
- Table 11. Canada: Cone Beam Computed Tomography Market, by Dental - Revenue and Forecast to 2028 (US$ Million)
- Table 12. Canada Cone Beam Computed Tomography Market, by End User - Revenue and Forecast to 2028 (US$ Million)
- Table 13. Mexico Cone Beam Computed Tomography Market, by Patient Positioning - Revenue and Forecast to 2028 (US$ Million)
- Table 14. Mexico Cone Beam Computed Tomography Market, by Application - Revenue and Forecast to 2028 (US$ Million)
- Table 15. Mexico: Cone Beam Computed Tomography Market, by Dental - Revenue and Forecast to 2028 (US$ Million)
- Table 16. Mexico Cone Beam Computed Tomography Market, by End User - Revenue and Forecast to 2028 (US$ Million)
- Table 17. Europe Cone Beam Computed Tomography Market, by Patient Positioning - Revenue and Forecast to 2028 (US$ Million)
- Table 18. Europe Cone Beam Computed Tomography Market, by Application - Revenue and Forecast to 2028 (US$ Million)
- Table 19. Europe Cone Beam Computed Tomography Market, by Dental Application - Revenue and Forecast to 2028 (US$ Million)
- Table 20. Europe Cone Beam Computed Tomography Market, by End User - Revenue and Forecast to 2028 (US$ Million)
- Table 21. UK Cone Beam Computed Tomography Market, by Patient Positioning - Revenue and Forecast to 2028 (US$ Million)
- Table 22. UK Cone Beam Computed Tomography Market, by Application - Revenue and Forecast to 2028 (US$ Million)
- Table 23. UK Cone Beam Computed Tomography Market, by Dental Application- Revenue and Forecast to 2028 (US$ Million)
- Table 24. UK Cone Beam Computed Tomography Market, by End User - Revenue and Forecast to 2028 (US$ Million)
- Table 25. Germany Cone Beam Computed Tomography Market, by Patient Positioning - Revenue and Forecast to 2028 (US$ Million)
- Table 26. Germany Cone Beam Computed Tomography Market, by Application - Revenue and Forecast to 2028 (US$ Million)
- Table 27. Germany Cone Beam Computed Tomography Market, by Dental Application- Revenue and Forecast to 2028 (US$ Million)
- Table 28. Germany Cone Beam Computed Tomography Market, by End User - Revenue and Forecast to 2028 (US$ Million)
- Table 29. France Cone Beam Computed Tomography Market, by Patient Positioning - Revenue and Forecast to 2028 (US$ Million)0
- Table 30. France Cone Beam Computed Tomography Market, by Application - Revenue and Forecast to 2028 (US$ Million)0
- Table 31. France Cone Beam Computed Tomography Market, by Dental Application - Revenue and Forecast to 2028 (US$ Million)1
- Table 32. France Cone Beam Computed Tomography Market, by End User - Revenue and Forecast to 2028 (US$ Million)1
- Table 33. Italy Cone Beam Computed Tomography Market, by Patient Positioning - Revenue and Forecast to 2028 (US$ Million)3
- Table 34. Italy Cone Beam Computed Tomography Market, by Application - Revenue and Forecast to 2028 (US$ Million)3
- Table 35. Italy Cone Beam Computed Tomography Market, by Dental Application- Revenue and Forecast to 2028 (US$ Million)4
- Table 36. Italy Cone Beam Computed Tomography Market, by End User - Revenue and Forecast to 2028 (US$ Million)4
- Table 37. Spain Cone Beam Computed Tomography Market, by Patient Positioning - Revenue and Forecast to 2028 (US$ Million)6
- Table 38. Spain Cone Beam Computed Tomography Market, by Application - Revenue and Forecast to 2028 (US$ Million)6
- Table 39. Spain Cone Beam Computed Tomography Market, by Dental Application - Revenue and Forecast to 2028 (US$ Million)7
- Table 40. Spain Cone Beam Computed Tomography Market, by End User - Revenue and Forecast to 2028 (US$ Million)7
- Table 41. Rest of Europe Cone Beam Computed Tomography Market, by Patient Positioning - Revenue and Forecast to 2028 (US$ Million)9
- Table 42. Rest of Europe Cone Beam Computed Tomography Market, by Application - Revenue and Forecast to 2028 (US$ Million)9
- Table 43. Rest of Europe Cone Beam Computed Tomography Market, by Dental Application - Revenue and Forecast to 2028 (US$ Million)0
- Table 44. Rest of Europe Cone Beam Computed Tomography Market, by End User - Revenue and Forecast to 2028 (US$ Million)0
- Table 45. Asia Pacific Cone Beam Computed Tomography Market, by Patient Positioning - Revenue and Forecast to 2028 (US$ Million)2
- Table 46. Asia Pacific Cone Beam Computed Tomography Market, by Application - Revenue and Forecast to 2028 (US$ Million)3
- Table 47. Asia Pacific Cone Beam Computed Tomography Market, by Dental Application - Revenue and Forecast to 2028 (US$ Million)3
- Table 48. Asia Pacific Cone Beam Computed Tomography Market, by End User - Revenue and Forecast to 2028 (US$ Million)4
- Table 49. China Cone Beam Computed Tomography Market, by Patient Positioning - Revenue and Forecast to 2028 (US$ Million)6
- Table 50. China Cone Beam Computed Tomography Market, by Application - Revenue and Forecast to 2028 (US$ Million)6
- Table 51. China Cone Beam Computed Tomography Market, by Dental Application - Revenue and Forecast to 2028 (US$ Million)7
- Table 52. China Cone Beam Computed Tomography Market, by End User - Revenue and Forecast to 2028 (US$ Million)7
- Table 53. Japan Cone Beam Computed Tomography Market, by Patient Positioning - Revenue and Forecast to 2028 (US$ Million)9
- Table 54. Japan Cone Beam Computed Tomography Market, by Application - Revenue and Forecast to 2028 (US$ Million)9
- Table 55. Japan Cone Beam Computed Tomography Market, by Dental Application - Revenue and Forecast to 2028 (US$ Million)0
- Table 56. Japan Cone Beam Computed Tomography Market, by End User - Revenue and Forecast to 2028 (US$ Million)0
- Table 57. India Cone Beam Computed Tomography Market, by Patient Positioning - Revenue and Forecast to 2028 (US$ Million)2
- Table 58. India Cone Beam Computed Tomography Market, by Application - Revenue and Forecast to 2028 (US$ Million)2
- Table 59. India Cone Beam Computed Tomography Market, by Dental Application - Revenue and Forecast to 2028 (US$ Million)3
- Table 60. India Cone Beam Computed Tomography Market, by End User - Revenue and Forecast to 2028 (US$ Million)3
- Table 61. South Korea Cone Beam Computed Tomography Market, by Patient Positioning - Revenue and Forecast to 2028 (US$ Million)5
- Table 62. South Korea Cone Beam Computed Tomography Market, by Application - Revenue and Forecast to 2028 (US$ Million)5
- Table 63. South Korea Cone Beam Computed Tomography Market, by Dental Application - Revenue and Forecast to 2028 (US$ Million)6
- Table 64. South Korea Cone Beam Computed Tomography Market, by End User - Revenue and Forecast to 2028 (US$ Million)6
- Table 65. Australia Cone Beam Computed Tomography Market, by Patient Positioning - Revenue and Forecast to 2028 (US$ Million)8
- Table 66. Australia Cone Beam Computed Tomography Market, by Application - Revenue and Forecast to 2028 (US$ Million)8
- Table 67. Australia Cone Beam Computed Tomography Market, by Dental Application - Revenue and Forecast to 2028 (US$ Million)9
- Table 68. Australia Cone Beam Computed Tomography Market, by End User - Revenue and Forecast to 2028 (US$ Million)9
- Table 69. Rest of Asia Pacific Cone Beam Computed Tomography Market, by Patient Positioning - Revenue and Forecast to 2028 (US$ Million)1
- Table 70. Rest of Asia Pacific Cone Beam Computed Tomography Market, by Application - Revenue and Forecast to 2028 (US$ Million)1
- Table 71. Rest of Asia Pacific Cone Beam Computed Tomography Market, by Dental Application - Revenue and Forecast to 2028 (US$ Million)2
- Table 72. Rest of Asia Pacific Cone Beam Computed Tomography Market, by End User - Revenue and Forecast to 2028 (US$ Million)2
- Table 73. Middle East & Africa Cone Beam Computed Tomography Market, by Patient Positioning - Revenue and Forecast to 2028 (US$ Million)4
- Table 74. Middle East & Africa Cone Beam Computed Tomography Market, by Application - Revenue and Forecast to 2028 (US$ Million)5
- Table 75. Middle East & Africa Cone Beam Computed Tomography Market, by Dental Application - Revenue and Forecast to 2028 (US$ Million)5
- Table 76. Middle East & Africa Cone Beam Computed Tomography Market, by End User - Revenue and Forecast to 2028 (US$ Million)6
- Table 77. UAE Cone Beam Computed Tomography Market, by Patient Positioning - Revenue and Forecast to 2028 (US$ Million)8
- Table 78. UAE Cone Beam Computed Tomography Market, by Application - Revenue and Forecast to 2028 (US$ Million)8
- Table 79. UAE Cone Beam Computed Tomography Market, by Dental Application - Revenue and Forecast to 2028 (US$ Million)9
- Table 80. UAE Cone Beam Computed Tomography Market, by End User - Revenue and Forecast to 2028 (US$ Million)9
- Table 81. Saudi Arabia Cone Beam Computed Tomography Market, by Patient Positioning - Revenue and Forecast to 2028 (US$ Million)1
- Table 82. Saudi Arabia Cone Beam Computed Tomography Market, by Application - Revenue and Forecast to 2028 (US$ Million)1
- Table 83. Saudi Arabia Cone Beam Computed Tomography Market, by Dental Application - Revenue and Forecast to 2028 (US$ Million)2
- Table 84. Saudi Arabia Cone Beam Computed Tomography Market, by End User - Revenue and Forecast to 2028 (US$ Million)2
- Table 85. South Africa Cone Beam Computed Tomography Market, by Patient Positioning - Revenue and Forecast to 2028 (US$ Million)4
- Table 86. South Africa Cone Beam Computed Tomography Market, by Application - Revenue and Forecast to 2028 (US$ Million)4
- Table 87. South Africa Cone Beam Computed Tomography Market, by Dental Application - Revenue and Forecast to 2028 (US$ Million)5
- Table 88. South Africa Cone Beam Computed Tomography Market, by End User - Revenue and Forecast to 2028 (US$ Million)5
- Table 89. Rest of Middle East & Africa Cone Beam Computed Tomography Market, by Patient Positioning - Revenue and Forecast to 2028 (US$ Million)7
- Table 90. Rest of Middle East & Africa Cone Beam Computed Tomography Market, by Application - Revenue and Forecast to 2028 (US$ Million)7
- Table 91. Rest of Middle East & Africa Cone Beam Computed Tomography Market, by Dental Application - Revenue and Forecast to 2028 (US$ Million)8
- Table 92. Rest of Middle East & Africa Cone Beam Computed Tomography Market, by End User - Revenue and Forecast to 2028 (US$ Million)8
- Table 93. South & Central America Cone Beam Computed Tomography Market, by Patient Positioning - Revenue and Forecast to 2028 (US$ Million)0
- Table 94. South & Central America Cone Beam Computed Tomography Market, by Application - Revenue and Forecast to 2028 (US$ Million)1
- Table 95. South & Central America: Cone Beam Computed Tomography Market, by Dental - Revenue and Forecast to 2028 (US$ Million)1
- Table 96. South & Central America Cone Beam Computed Tomography Market, by End User - Revenue and Forecast to 2028 (US$ Million)2
- Table 97. Brazil Cone Beam Computed Tomography Market, by Patient Positioning - Revenue and Forecast to 2028 (US$ Million)4
- Table 98. Brazil Cone Beam Computed Tomography Market, by Application- Revenue and Forecast to 2028 (US$ Million)4
- Table 99. Brazil: Cone Beam Computed Tomography Market, by Dental - Revenue and Forecast to 2028 (US$ Million)5
- Table 100. Brazil Cone Beam Computed Tomography Market, by End User - Revenue and Forecast to 2028 (US$ Million)5
- Table 101. Argentina Cone Beam Computed Tomography Market, by Patient Positioning - Revenue and Forecast to 2028 (US$ Million)7
- Table 102. Argentina Cone Beam Computed Tomography Market, by Application- Revenue and Forecast to 2028 (US$ Million)7
- Table 103. Argentina: Cone Beam Computed Tomography Market, by Dental - Revenue and Forecast to 2028 (US$ Million)8
- Table 104. Argentina Cone Beam Computed Tomography Market, by End User - Revenue and Forecast to 2028 (US$ Million)8
- Table 105. Rest of South & Central America Cone Beam Computed Tomography Market, by Patient Positioning - Revenue and Forecast to 2028 (US$ Million)0
- Table 106. Rest of South & Central America Cone Beam Computed Tomography Market, by Application- Revenue and Forecast to 2028 (US$ Million)0
- Table 107. Rest of South & Central America: Cone Beam Computed Tomography Market, by Dental - Revenue and Forecast to 2028 (US$ Million)1
- Table 108. Rest of South & Central America Cone Beam Computed Tomography Market, by End User - Revenue and Forecast to 2028 (US$ Million)1
- Table 109. Recent Inorganic Growth Strategies in the Cone Beam Computed Tomography Market3
- Table 110. Recent Organic Growth Strategies in Cone Beam Computed Tomography Market3
List Of Figures
- Figure 1. Cone Beam Computed Tomography Market Segmentation
- Figure 2. Cone Beam Computed Tomography Market, by Region
- Figure 3. Global Cone Beam Computed Tomography Market Overview
- Figure 4. Sitting Segment Held Largest Share of Patient Positioning Segment in Cone Beam Computed Tomography Market
- Figure 5. Asia Pacific Expected to Show Remarkable Growth During Forecast Period
- Figure 6. Cone Beam Computed Tomography Market, by Geography (US$ Million)
- Figure 7. Global Cone Beam Computed Tomography Market - Leading Country Markets (US$ Million)
- Figure 8. Global Cone Beam Computed Tomography Market - Industry Landscape
- Figure 9. North America: PEST Analysis
- Figure 10. Europe: PEST Analysis
- Figure 11. Asia Pacific: PEST Analysis
- Figure 12. South & Central America: PEST Analysis
- Figure 13. Middle East & Africa: PEST Analysis
- Figure 14. Experts' Opinion
- Figure 15. Cone Beam Computed Tomography Market: Impact Analysis of Drivers and Restraints
- Figure 16. Global Cone Beam Computed Tomography Market - Revenue Forecast and Analysis - 2020-2028
- Figure 17. Global Cone Beam Computed Tomography Market, by Geography - Forecast and Analysis (2021-2028)
- Figure 18. Market Positioning of Key Players in Cone Beam Computed Tomography Market
- Figure 19. Cone Beam Computed Tomography Market Revenue Share, by Patient Positioning, 2021 & 2028 (%)
- Figure 20. Standing: Cone Beam Computed Tomography Market - Revenue and Forecast to 2028 (US$ Million)
- Figure 21. Sitting: Cone Beam Computed Tomography Market - Revenue and Forecast to 2028 (US$ Million)
- Figure 22. Supine: Cone Beam Computed Tomography Market - Revenue and Forecast to 2028 (US$ Million)
- Figure 23. Global Cone Beam Computed Tomography Market, by Application 2021 & 2028 (%)
- Figure 24. Dental: Cone Beam Computed Tomography Market - Revenue and Forecast to 2028 (US$ Million)
- Figure 25. Dental Implantology: Cone Beam Computed Tomography Market - Revenue and Forecast to 2028 (US$ Million)
- Figure 26. Orthodontics: Cone Beam Computed Tomography Market - Revenue and Forecast to 2028 (US$ Million)
- Figure 27. Endodontics: Cone Beam Computed Tomography Market - Revenue and Forecast to 2028 (US$ Million)
- Figure 28. Periodontics: Cone Beam Computed Tomography Market - Revenue and Forecast to 2028 (US$ Million)
- Figure 29. General Dentistry: Cone Beam Computed Tomography Market - Revenue and Forecast to 2028 (US$ Million)
- Figure 30. Others: Cone Beam Computed Tomography Market - Revenue and Forecast to 2028 (US$ Million)
- Figure 31. ENT: Cone Beam Computed Tomography Market - Revenue and Forecast to 2028 (US$ Million)
- Figure 32. Breast Cancer: Cone Beam Computed Tomography Market - Revenue and Forecast to 2028 (US$ Million)
- Figure 33. Orthopedic: Cone Beam Computed Tomography Market - Revenue and Forecast to 2028 (US$ Million)
- Figure 34. Skull Base: Cone Beam Computed Tomography Market - Revenue and Forecast to 2028 (US$ Million)
- Figure 35. Others: Cone Beam Computed Tomography Market - Revenue and Forecast to 2028 (US$ Million)
- Figure 36. Global Cone Beam Computed Tomography Market, by End User, 2021 & 2028 (%)
- Figure 37. Hospitals and Clinics: Cone Beam Computed Tomography Market - Revenue and Forecast to 2028 (US$ Million)
- Figure 38. Diagnostic Centers: Cone Beam Computed Tomography Market - Revenue and Forecast to 2028 (US$ Million)
- Figure 39. Others: Cone Beam Computed Tomography Market - Revenue and Forecast to 2028 (US$ Million)
- Figure 40. North America: Cone Beam Computed Tomography Market, by Key Country - Revenue (2021) (US$ Million)
- Figure 41. North America Cone Beam Computed Tomography Market - Revenue and Forecast to 2028 (US$ Million)
- Figure 42. North America: Cone Beam Computed Tomography Market, by Country, 2021 & 2028 (%)
- Figure 43. US: Cone Beam Computed Tomography Market - Revenue and Forecast to 2028 (US$ Million)
- Figure 44. Canada: Cone Beam Computed Tomography Market - Revenue and Forecast to 2028 (US$ Million)
- Figure 45. Mexico: Cone Beam Computed Tomography Market - Revenue and Forecast to 2028 (US$ Million)
- Figure 46. Europe Cone Beam Computed Tomography Market Revenue overview, by Country, 2021 (US$ MN)
- Figure 47. Europe Cone Beam Computed Tomography Market Revenue and Forecasts to 2028 (US$ Million)
- Figure 48. Europe Cone Beam Computed Tomography Market Revenue and Forecasts to 2028, By Country (%)
- Figure 49. UK Cone Beam Computed Tomography Market Revenue and Forecasts to 2028 (US$ Million)
- Figure 50. Germany Cone Beam Computed Tomography Market Revenue and Forecasts to 2028 (US$ Million)
- Figure 51. France Cone Beam Computed Tomography Market Revenue and Forecasts to 2028 (US$ Million)
- Figure 52. Italy Cone Beam Computed Tomography Market Revenue and Forecasts to 2028 (US$ Million)2
- Figure 53. Spain Cone Beam Computed Tomography Market Revenue and Forecasts to 2028 (US$ Million)5
- Figure 54. Rest of Europe Cone Beam Computed Tomography Market Revenue and Forecasts to 2028 (US$ Million)8
- Figure 55. Asia Pacific: Cone Beam Computed Tomography Market, by Key Country - Revenue (2021) (US$ Million)1
- Figure 56. Asia Pacific Cone Beam Computed Tomography Market - Revenue and Forecast to 2028 (US$ Million)2
- Figure 57. China: Cone Beam Computed Tomography Market - Revenue and Forecast to 2028 (US$ Million)5
- Figure 58. Japan: Cone Beam Computed Tomography Market - Revenue and Forecast to 2028 (US$ Million)8
- Figure 59. India: Cone Beam Computed Tomography Market - Revenue and Forecast to 2028 (US$ Million)1
- Figure 60. South Korea: Cone Beam Computed Tomography Market - Revenue and Forecast to 2028 (US$ Million)4
- Figure 61. Australia: Cone Beam Computed Tomography Market - Revenue and Forecast to 2028 (US$ Million)7
- Figure 62. Rest of Asia Pacific: Cone Beam Computed Tomography Market - Revenue and Forecast to 2028 (US$ Million)0
- Figure 63. Middle East & Africa: Cone Beam Computed Tomography Market, by Key Country - Revenue (2021) (US$ Million)3
- Figure 64. Middle East & Africa Cone Beam Computed Tomography Market - Revenue and Forecast to 2028 (US$ Million)4
- Figure 65. UAE: Cone Beam Computed Tomography Market - Revenue and Forecast to 2028 (US$ Million)7
- Figure 66. Saudi Arabia: Cone Beam Computed Tomography Market - Revenue and Forecast to 2028 (US$ Million)0
- Figure 67. South Africa: Cone Beam Computed Tomography Market - Revenue and Forecast to 2028 (US$ Million)3
- Figure 68. Rest of Middle East & Africa: Cone Beam Computed Tomography Market - Revenue and Forecast to 2028 (US$ Million)6
- Figure 69. South & Central America: Cone Beam Computed Tomography Market, by Key Country - Revenue (2021) (US$ Million)9
- Figure 70. South & Central America Cone Beam Computed Tomography Market - Revenue and Forecast to 2028 (US$ Million)0
- Figure 71. South & Central America: Cone Beam Computed Tomography Market, by Country, 2021 & 2028 (%)2
- Figure 72. Brazil: Cone Beam Computed Tomography Market - Revenue and Forecast to 2028 (US$ Million)3
- Figure 73. Argentina: Cone Beam Computed Tomography Market - Revenue and Forecast to 2028 (US$ Million)6
- Figure 74. Rest of South & Central America: Cone Beam Computed Tomography Market - Revenue and Forecast to 2028 (US$ Million)9
- Figure 75. Impact of COVID-19 Pandemic on North American Country Markets3
- Figure 76. Impact of COVID-19 Pandemic in European Country Markets5
- Figure 77. Impact of COVID-19 Pandemic in Asia Pacific Country Markets7
- Figure 78. Impact of COVID-19 Pandemic in Middle East & Africa Country Markets9
- Figure 79. Impact of COVID-19 Pandemic on South & Central American Country Markets1
- Figure 80. Growth Strategies in Cone Beam Computed Tomography Market2
The cone beam computed tomography market is expected to reach US$ 2,278.41 million by 2028 from US$ 1,214.51 million in 2022; it is estimated to grow at a CAGR of 11.1% from 2022 to 2028.
The increasing cases of dental disorders and the integration of software tools into cone beam computed tomography devices are among the key forces bolstering the market. However, high initial and maintenance cost hinders the cone beam computed tomography market growth.
Cone beam computed tomography is a modification of the traditional computed tomography (CT) system. The cone beam computed tomography systems used by dental professionals rotate around the patient, capturing data using a cone-shaped X-ray beam. These data are used to reconstruct a three-dimensional image of the dental (teeth); oral and maxillofacial region (mouth, jaw, and neck); and ears, nose, and throat.
Dental diseases are the most common noncommunicable diseases (NCDs), which affect people throughout their lives. The Global Oral Health Status Report 2022 by the World Health Organization (WHO) estimates that oral diseases affect ~3.5 billion people worldwide, with 3 in 4 sufferers living in middle-income countries. The prevalence of the most important oral diseases continues to increase with changing lifestyles worldwide. According to the Centers for Disease Control and Prevention (CDC), over 85% of children, and ~65% of adults (including people aged 65 and above), have various dental diseases. In addition, trauma resulting from factors such as tooth injury, oral or oral cavity, or teeth misalignment is common. According to the WHO, ~20% of people experience such trauma in the orodental region at some point in their lives. As stated by Nguyen Van Chuyen et al. in a research report published in July 2021, dental caries is a global health problem. Moreover, malocclusion is considered one of the most important dental health problems, along with periodontitis and tooth decay, according to a report published in Dentistry Journal in October 2021. The WHO considers the prevalence of malocclusion highly variable, with an estimated rate of 39% and 93% in children and adolescents, respectively. The prevalence of malocclusion is projected to rise in the coming years, thereby increasing the demand for invisible orthodontics, which, in turn, boosts the cone beam computed tomography market. Dental treatment procedures are carried out with the assistance of digital imaging techniques. CBCT helps conduct anatomical characterization and find specific anomalies in dental implants through imaging. Moreover, it helps make procedures more interactive and easier for dentists. Hence, the increasing prevalence of dental diseases bolsters the growth of the cone beam computed tomography market.
The advantages of cone beam computed tomography have led to its widespread adoption in dentistry; maxillofacial surgeries; ear, nose, and throat (ENT) medicine; rheumatology; and traumatology. cone beam computed tomography produces 3D images that are useful in orthodontics and periodontology; this represents an undisputed advantage over conventional radiography. Further, the quality of the device is one of the key aspects that influences the usefulness of cone beam computed tomography in ENT and reconstructive head & neck surgeries. Moreover, the number of referrals and the variety of anatomical regions requested for imaging are also increasing. cone beam computed tomography features a new dedicated breast CT imaging technology based on cone beam X-rays and a flat panel detector, which has opened a new chapter in breast imaging. This revolutionary modality helps overcome the limitations of current imaging techniques used for the examination of dense breast tissues and overlapping structures. These benefits could translate into reduced morbidity and mortality from breast cancer. It also allows easy administration of contrast media for functional imaging.
Cone beam computed tomography is used in the diagnosis of chronic sinusitis due to the lower radiation dose and the lesser cost than conventional CT. Cone beam computed tomography provides a clear distinction between air, membrane, and bone density, which enables the visualization of anatomical structures and their pneumatization. It also aids visibility into inflammation without being able to differentiate between simple mucous membrane thickening, cysts, polyps, or fluid accumulation. CBCT has been used in research on middle ear pathologies, focusing on auditory ossicles. In otologic surgery, Cone beam computed tomography is used for assessing the detailed dimensions of the cochlea and the position of cochlear implant electrodes in the inner ear, which are extremely important for maintaining residual hearing.
In orthopedics, a cone beam computed tomography scanner allows a greater degree of patient positioning. Thus, the use of this technique is no longer limited to the dentomaxillofacial area. cone beam computed tomography scanners enable faster, more accurate, three-dimensional imaging at a fraction of the radiation dose. Owing to smaller imaging equipment, these new scanners can bring CT imaging from radiology departments to clinical rooms, emergency rooms, community facilities, and operating rooms. The scanners can be aligned vertically to examine patients when they are standing. Weight-bearing scans provide better visualization of some pathologies. Therefore, the expanding range of applications of cone beam computed tomography in various areas of healthcare is expected to provide growth opportunities to the global cone beam computed tomography market players in the future.
Patient Positioning Insights
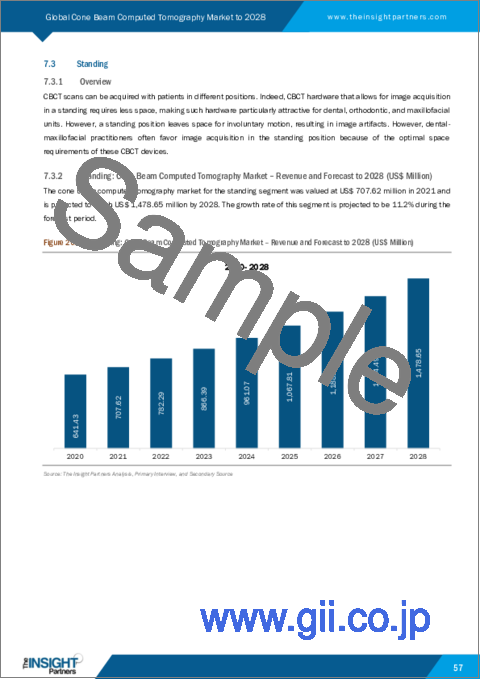
Based on patient positioning, the cone beam computed tomography market is segmented standing, sitting, and supine. The standing segment held the largest market share in 2021, whereas the sitting position is anticipated to register the highest CAGR of 11.2% during the forecast period (2022-2028). CBCT scans can be acquired for patients in different positions. CBCT hardware that allows for image acquisition in a standing position requires less space, making it, particularly, attractive in dental, orthodontic, and maxillofacial units. However, a standing position leaves space for involuntary motion, resulting in image artifacts. Dental-maxillofacial practitioners often favor image acquisition when patients are in the standing position because of the optimal space requirements of these devices.
Application Insights
Based on application, the cone beam computed tomography market is divided into dental, ENT, breast cancer, skull base, and orthopedic applications. The dental segment held the largest share of the market in 2021. The cone beam computed tomography market for the ENT segment is expected to grow at the highest CAGR of 11.9% during the forecast period. High-quality cone beam computed tomography scans help in post-operative, middle, and inner ear cochlear implant visualization and evaluation, reuniting duct (of the inner ear) visualization, and intraoperative temporal bone surgical guidance. Superior image quality, validity, reproducibility, and less radiation exposure are the characteristics of cone beam computed tomography imaging that have made it an attractive alternative to traditional imaging methods in ENT. The technique is gradually replacing the native X-ray method in ENT, as. Cone beam computed tomography can be used in ENT applications such as sino-nasal pathology, maxillofacial and nose trauma evaluation, cochlear implant visualization, middle/inner ear malformation and ossicular chain malformation diagnosis, and obstructive sleep apnea examination.
Reasons to Buy:
Save and reduce time carrying out entry-level research by identifying the growth, size, leading players, and segments in the global cone beam computed tomography market.
Highlights key business priorities in order to assist companies to realign their business strategies.
The key findings and recommendations highlight crucial progressive industry trends in the global cone beam computed tomography market, thereby allowing players across the value chain to develop effective long-term strategies.
Develop/modify business expansion plans by using substantial growth offering developed and emerging markets.
Scrutinize in-depth market trends and outlook in global market coupled with the factors driving the market, as well as those hindering it.
Enhancing the decision-making process by understanding the strategies that underpin security interest with respect to client products, segmentation, pricing, and distribution.
Table Of Contents
1. Introduction
- 1.1 Scope of the Study
- 1.2 The Insight Partners Research Report Guidance
- 1.3 Market Segmentation
- 1.3.1 Global Cone Beam Computed Tomography Market - by Patient Positioning
- 1.3.2 Global Cone Beam Computed Tomography Market - by Application
- 1.3.3 Global Cone Beam Computed Tomography Market - by End User
- 1.3.4 Global Cone Beam Computed Tomography Market - by Geography
2. Cone Beam Computed Tomography Market - Key Takeaways
3. Research Methodology
- 3.1 Coverage
- 3.2 Secondary Research
- 3.3 Primary Research
4. Cone Beam Computed Tomography Market - Market Landscape
- 4.1 Overview
- 4.2 PEST Analysis
- 4.2.1 North America PEST Analysis
- 4.2.2 Europe PEST Analysis
- 4.2.3 Asia Pacific PEST Analysis
- 4.2.4 South & Central America PEST Analysis
- 4.2.5 Middle East & Africa PEST Analysis
- 4.3 Expert's Opinion
5. Cone Beam Computed Tomography Market - Key Market Dynamics
- 5.1 Market Drivers
- 5.1.1 Increasing Cases of Dental Disorders
- 5.1.2 Integration of Software Tools into CBCT Devices
- 5.2 Market Restraints
- 5.2.1 High Initial and Maintenance Cost
- 5.3 Market Opportunities
- 5.3.1 Expanding Application Areas of CBCT Devices
- 5.4 Future Trends
- 5.4.1 Technological Advancements and R&D
- 5.5 Impact Analysis
6. Cone Beam Computed Tomography Market - Global Analysis
- 6.1 Global Cone Beam Computed Tomography Market Revenue Forecast and Analysis
- 6.2 Global Cone Beam Computed Tomography Market, by Geography - Forecast and Analysis
- 6.3 Market Positioning of Key Players
7. Global Cone Beam Computed Tomography Market Analysis and Forecast to 2028 - by Patient Positioning
- 7.1 Overview
- 7.2 Cone Beam Computed Tomography Market Revenue Share, by Patient Positioning, 2021 & 2028 (%)
- 7.3 Standing
- 7.3.1 Overview
- 7.3.2 Standing: Cone Beam Computed Tomography Market - Revenue and Forecast to 2028 (US$ Million)
- 7.4 Sitting
- 7.4.1 Overview
- 7.4.2 Sitting: Cone Beam Computed Tomography Market - Revenue and Forecast to 2028 (US$ Million)
- 7.5 Supine
- 7.5.1 Overview
- 7.5.2 Supine: Cone Beam Computed Tomography Market - Revenue and Forecast to 2028 (US$ Million)
8. Global Cone Beam Computed Tomography Market Analysis and Forecasts to 2028 - by Application
- 8.1 Overview
- 8.2 Global Cone Beam Computed Tomography Market, by Application 2021 & 2028 (%)
- 8.3 Dental
- 8.3.1 Overview
- 8.3.2 Dental: Cone Beam Computed Tomography Market - Revenue and Forecast to 2028 (US$ Million)
- 8.3.3 Dental Implantology
- 8.3.3.1 Overview
- 8.3.4 Dental Implantology: Cone Beam Computed Tomography Market - Revenue and Forecast to 2028 (US$ Million)
- 8.3.5 Orthodontics
- 8.3.5.1 Overview
- 8.3.6 Orthodontics: Cone Beam Computed Tomography Market - Revenue and Forecast to 2028 (US$ Million)
- 8.3.7 Endodontics
- 8.3.7.1 Overview
- 8.3.8 Endodontics: Cone Beam Computed Tomography Market - Revenue and Forecast to 2028 (US$ Million)
- 8.3.9 Periodontics
- 8.3.9.1 Overview
- 8.3.10 Periodontics: Cone Beam Computed Tomography Market - Revenue and Forecast to 2028 (US$ Million)
- 8.3.11 General Dentistry
- 8.3.11.1 Overview
- 8.3.12 General Dentistry: Cone Beam Computed Tomography Market - Revenue and Forecast to 2028 (US$ Million)
- 8.3.13 Others
- 8.3.13.1 Overview
- 8.3.14 Others: Cone Beam Computed Tomography Market - Revenue and Forecast to 2028 (US$ Million)
- 8.4 ENT
- 8.4.1 Overview
- 8.4.2 ENT: Cone Beam Computed Tomography Market - Revenue and Forecast to 2028 (US$ Million)
- 8.5 Breast Cancer
- 8.5.1 Overview
- 8.5.2 Breast Cancer: Cone Beam Computed Tomography Market - Revenue and Forecast to 2028 (US$ Million)
- 8.6 Orthopedic
- 8.6.1 Overview
- 8.6.2 Orthopedic: Cone Beam Computed Tomography Market - Revenue and Forecast to 2028 (US$ Million)
- 8.7 Skull Base
- 8.7.1 Overview
- 8.7.2 Skull Base: Cone Beam Computed Tomography Market - Revenue and Forecast to 2028 (US$ Million)
- 8.9 Others
- 8.9.1 Overview
- 8.9.2 Others: Cone Beam Computed Tomography Market - Revenue and Forecast to 2028 (US$ Million)
9. Global Cone Beam Computed Tomography Market Analysis and Forecast to 2028 - by End User
- 9.1 Overview
- 9.2 Global Cone Beam Computed Tomography Market, by End User, 2021 & 2028 (%)
- 9.3 Hospitals and Clinics
- 9.3.1 Overview
- 9.3.2 Hospitals and Clinics: Cone Beam Computed Tomography Market - Revenue and Forecast to 2028 (US$ Million)
- 9.4 Diagnostic Centers
- 9.4.1 Overview
- 9.4.2 Diagnostic Centers: Cone Beam Computed Tomography Market - Revenue and Forecast to 2028 (US$ Million)
- 9.5 Others
- 9.5.1 Overview
- 9.5.2 Others: Cone Beam Computed Tomography Market - Revenue and Forecast to 2028 (US$ Million)
10. Cone Beam Computed Tomography Market - Revenue and Forecast to 2028 - Geographic Analysis
- 10.1 North America: Cone Beam Computed Tomography Market
- 10.1.1 Overview
- 10.1.2 North America: Cone Beam Computed Tomography Market - Revenue and Forecast to 2028 (US$ Million)
- 10.1.3 North America: Cone Beam Computed Tomography Market, by Patient Positioning, 2019-2028 (US$ Million)
- 10.1.4 North America: Cone Beam Computed Tomography Market, by Application, 2019-2028 (US$ Million)
- 10.1.4.1 North America: Cone Beam Computed Tomography Market, by Dental, 2019-2028 (US$ Million)
- 10.1.5 North America: Cone Beam Computed Tomography Market, by End User, 2019-2028 (US$ Million)
- 10.1.5.1 US: Cone Beam Computed Tomography Market - Revenue and Forecast to 2028 (US$ Million)
- 10.1.5.1.1 Overview
- 10.1.5.1.2 US: Cone Beam Computed Tomography Market - Revenue and Forecast to 2028 (US$ Million)
- 10.1.5.1.3 US: Cone Beam Computed Tomography Market, by Patient Positioning, 2019-2028 (US$ Million)
- 10.1.5.1.4 US: Cone Beam Computed Tomography Market, by Application, 2019-2028 (US$ Million)
- 10.1.5.1.4.1 US: Cone Beam Computed Tomography Market, by Dental, 2019-2028 (US$ Million)
- 10.1.5.1.5 US: Cone Beam Computed Tomography Market, by End User, 2019-2028 (US$ Million)
- 10.1.5.2 Canada: Cone Beam Computed Tomography Market - Revenue and Forecast to 2028 (US$ Million)
- 10.1.5.2.1 Overview
- 10.1.5.2.2 Canada: Cone Beam Computed Tomography Market - Revenue and Forecast to 2028 (US$ Million)
- 10.1.5.2.3 Canada: Cone Beam Computed Tomography Market, by Patient Positioning, 2019-2028 (US$ Million)
- 10.1.5.2.4 Canada: Cone Beam Computed Tomography Market, by Application, 2019-2028 (US$ Million)
- 10.1.5.2.4.1 Canada: Cone Beam Computed Tomography Market, by Dental, 2019-2028 (US$ Million)
- 10.1.5.2.5 Canada: Cone Beam Computed Tomography Market, by End User, 2019-2028 (US$ Million)
- 10.1.5.3 Mexico: Cone Beam Computed Tomography Market - Revenue and Forecast to 2028 (US$ Million)
- 10.1.5.3.1 Overview
- 10.1.5.3.2 Mexico: Cone Beam Computed Tomography Market - Revenue and Forecast to 2028 (US$ Million)
- 10.1.5.3.3 Mexico: Cone Beam Computed Tomography Market, by Patient Positioning, 2019-2028 (US$ Million)
- 10.1.5.3.4 Mexico: Cone Beam Computed Tomography Market, by Application, 2019-2028 (US$ Million)
- 10.1.5.3.4.1 Mexico: Cone Beam Computed Tomography Market, by Dental, 2019-2028 (US$ Million)
- 10.1.5.3.5 Mexico: Cone Beam Computed Tomography Market, by End User, 2019-2028 (US$ Million)
- 10.1.5.1 US: Cone Beam Computed Tomography Market - Revenue and Forecast to 2028 (US$ Million)
- 10.2 Europe: Cone Beam Computed Tomography Market
- 10.2.1 Overview
- 10.2.2 Europe Cone Beam Computed Tomography Market Revenue and Forecasts to 2028 (US$ Million)
- 10.2.3 Europe Cone Beam Computed Tomography Market Revenue and Forecasts to 2028, By Patient Positioning (US$ Million)
- 10.2.4 Europe Cone Beam Computed Tomography Market Revenue and Forecasts to 2028, By Application (US$ Million)
- 10.2.4.1 Europe Cone Beam Computed Tomography Market Revenue and Forecasts to 2028, By Dental Application (US$ Million)
- 10.2.5 Europe Cone Beam Computed Tomography Market Revenue and Forecasts to 2028, By End User (US$ Million)
- 10.2.6 Europe Cone Beam Computed Tomography Market Revenue and Forecasts to 2028, By Country (%)
- 10.2.6.1 UK Cone Beam Computed Tomography Market Revenue and Forecasts to 2028 (US$ Million)
- 10.2.6.1.1 UK Cone Beam Computed Tomography Market Revenue and Forecasts to 2028 (US$ Million)
- 10.2.6.1.2 UK Cone Beam Computed Tomography Market Revenue and Forecasts to 2028, By Patient Positioning (US$ Million)
- 10.2.6.1.3 UK Cone Beam Computed Tomography Market Revenue and Forecasts to 2028, By Application (US$ Million)
- 10.2.6.1.3.1 UK Cone Beam Computed Tomography Market Revenue and Forecasts to 2028, By Dental Application (US$ Million)
- 10.2.6.1.4 UK Cone Beam Computed Tomography Market Revenue and Forecasts to 2028, By End User (US$ Million)
- 10.2.6.2 Germany Cone Beam Computed Tomography Market Revenue and Forecasts to 2028 (US$ Million)
- 10.2.6.2.1 Germany Cone Beam Computed Tomography Market Revenue and Forecasts to 2028 (US$ Million)
- 10.2.6.2.2 Germany Cone Beam Computed Tomography Market Revenue and Forecasts to 2028, By Patient Positioning (US$ Million)
- 10.2.6.2.3 Germany Cone Beam Computed Tomography Market Revenue and Forecasts to 2028, By Application (US$ Million)
- 10.2.6.2.3.1 Germany Cone Beam Computed Tomography Market Revenue and Forecasts to 2028, By Dental Application (US$ Million)
- 10.2.6.2.4 Germany Cone Beam Computed Tomography Market Revenue and Forecasts to 2028, By End User (US$ Million)
- 10.2.6.3 France Cone Beam Computed Tomography Market Revenue and Forecasts to 2028 (US$ Million)
- 10.2.6.3.1 France Cone Beam Computed Tomography Market Revenue and Forecasts to 2028 (US$ Million)
- 10.2.6.3.2 France Cone Beam Computed Tomography Market Revenue and Forecasts to 2028, By Patient Positioning (US$ Million)0
- 10.2.6.3.3 France Cone Beam Computed Tomography Market Revenue and Forecasts to 2028, By Application (US$ Million)0
- 10.2.6.3.3.1 France Cone Beam Computed Tomography Market Revenue and Forecasts to 2028, By Dental Application (US$ Million)1
- 10.2.6.3.4 France Cone Beam Computed Tomography Market Revenue and Forecasts to 2028, By End User (US$ Million)1
- 10.2.6.4 Italy Cone Beam Computed Tomography Market Revenue and Forecasts to 2028 (US$ Million)2
- 10.2.6.4.1 Italy Cone Beam Computed Tomography Market Revenue and Forecasts to 2028 (US$ Million)2
- 10.2.6.4.2 Italy Cone Beam Computed Tomography Market Revenue and Forecasts to 2028, By Patient Positioning (US$ Million)3
- 10.2.6.4.3 Italy Cone Beam Computed Tomography Market Revenue And Forecasts to 2028, By Application (US$ Million)3
- 10.2.6.4.3.1 Italy Cone Beam Computed Tomography Market Revenue and Forecasts to 2028, By Dental Application (US$ Million)4
- 10.2.6.4.4 Italy Cone Beam Computed Tomography Market Revenue and Forecasts to 2028, By End User (US$ Million)4
- 10.2.6.5 Spain Cone Beam Computed Tomography Market Revenue and Forecasts to 2028 (US$ Million)5
- 10.2.6.5.1 Spain Cone Beam Computed Tomography Market Revenue and Forecasts to 2028 (US$ Million)5
- 10.2.6.5.2 Spain Cone Beam Computed Tomography Market Revenue And Forecasts to 2028, By Patient Positioning (US$ Million)6
- 10.2.6.5.3 Spain Cone Beam Computed Tomography Market Revenue and Forecasts to 2028, By Application (US$ Million)6
- 10.2.6.5.3.1 Spain Cone Beam Computed Tomography Market Revenue and Forecasts to 2028, By Dental Application (US$ Million)7
- 10.2.6.5.4 Spain Cone Beam Computed Tomography Market Revenue and Forecasts to 2028, By End User (US$ Million)7
- 10.2.6.6 Rest of Europe Cone Beam Computed Tomography Market Revenue and Forecasts to 2028 (US$ Million)8
- 10.2.6.6.1 Rest of Europe Cone Beam Computed Tomography Market Revenue and Forecasts to 2028 (US$ Million)8
- 10.2.6.6.2 Rest of Europe Cone Beam Computed Tomography Market Revenue and Forecasts to 2028, By Patient Positioning (US$ Million)9
- 10.2.6.6.3 Rest of Europe Cone Beam Computed Tomography Market Revenue and Forecasts to 2028, By Application (US$ Million)9
- 10.2.6.6.3.1 Rest of Europe Cone Beam Computed Tomography Market Revenue and Forecasts to 2028, By Dental Application (US$ Million)0
- 10.2.6.6.4 Rest Europe Cone Beam Computed Tomography Market Revenue and Forecasts to 2028, By End User (US$ Million)0
- 10.2.6.1 UK Cone Beam Computed Tomography Market Revenue and Forecasts to 2028 (US$ Million)
- 10.3 Asia Pacific: Cone Beam Computed Tomography Market1
- 10.3.1 Overview1
- 10.3.2 Asia Pacific: Cone Beam Computed Tomography Market - Revenue and Forecast to 2028 (US$ Million)2
- 10.3.3 Asia Pacific: Cone Beam Computed Tomography Market, by Patient Positioning, 2019-2028 (US$ Million)2
- 10.3.4 Asia Pacific: Cone Beam Computed Tomography Market, by Application, 2019-2028 (US$ Million)3
- 10.3.4.1 Asia Pacific: Cone Beam Computed Tomography Market, by Dental Application, 2019-2028 (US$ Million)3
- 10.3.5 Asia Pacific: Cone Beam Computed Tomography Market, by End User, 2019-2028 (US$ Million)4
- 10.3.6 Asia Pacific: Cone Beam Computed Tomography Market, by Country, 2021 & 2028 (%)4
- 10.3.6.1 China: Cone Beam Computed Tomography Market - Revenue and Forecast to 2028 (US$ Million)5
- 10.3.6.1.1 Overview5
- 10.3.6.1.2 China: Cone Beam Computed Tomography Market - Revenue and Forecast to 2028 (US$ Million)5
- 10.3.6.1.3 China: Cone Beam Computed Tomography Market, by Patient Positioning, 2019-2028 (US$ Million)6
- 10.3.6.1.4 China: Cone Beam Computed Tomography Market, by Application, 2019-2028 (US$ Million)6
- 10.3.6.1.4.1 China: Cone Beam Computed Tomography Market, by Dental Application, 2019-2028 (US$ Million)7
- 10.3.6.1.5 China Cone Beam Computed Tomography Market, by End User, 2019-2028 (US$ Million)7
- 10.3.6.2 Japan: Cone Beam Computed Tomography Market - Revenue and Forecast to 2028 (US$ Million)8
- 10.3.6.2.1 Overview8
- 10.3.6.2.2 Japan: Cone Beam Computed Tomography Market - Revenue and Forecast to 2028 (US$ Million)8
- 10.3.6.2.3 Japan: Cone Beam Computed Tomography Market, by Patient Positioning, 2019-2028 (US$ Million)9
- 10.3.6.2.4 Japan: Cone Beam Computed Tomography Market, by Application, 2019-2028 (US$ Million)9
- 10.3.6.2.4.1 Japan: Cone Beam Computed Tomography Market, by Dental Application, 2019-2028 (US$ Million)0
- 10.3.6.2.5 Japan: Cone Beam Computed Tomography Market, by End User, 2019-2028 (US$ Million)0
- 10.3.6.3 India: Cone Beam Computed Tomography Market - Revenue and Forecast to 2028 (US$ Million)1
- 10.3.6.3.1 Overview1
- 10.3.6.3.2 India: Cone Beam Computed Tomography Market - Revenue and Forecast to 2028 (US$ Million)1
- 10.3.6.3.3 India: Cone Beam Computed Tomography Market, by Patient Positioning, 2019-2028 (US$ Million)2
- 10.3.6.3.4 India: Cone Beam Computed Tomography Market, by Application, 2019-2028 (US$ Million)2
- 10.3.6.3.4.1 India: Cone Beam Computed Tomography Market, by Dental Application, 2019-2028 (US$ Million)3
- 10.3.6.3.5 India: Cone Beam Computed Tomography Market, by End User, 2019-2028 (US$ Million)3
- 10.3.6.4 South Korea: Cone Beam Computed Tomography Market - Revenue and Forecast to 2028 (US$ Million)4
- 10.3.6.4.1 Overview4
- 10.3.6.4.2 South Korea: Cone Beam Computed Tomography Market - Revenue and Forecast to 2028 (US$ Million)4
- 10.3.6.4.3 South Korea: Cone Beam Computed Tomography Market, by Patient Positioning, 2019-2028 (US$ Million)5
- 10.3.6.4.4 South Korea: Cone Beam Computed Tomography Market, by Application, 2019-2028 (US$ Million)5
- 10.3.6.4.4.1 South Korea: Cone Beam Computed Tomography Market, by Dental Application, 2019-2028 (US$ Million)6
- 10.3.6.4.5 South Korea: Cone Beam Computed Tomography Market, by End User, 2019-2028 (US$ Million)6
- 10.3.6.5 Australia: Cone Beam Computed Tomography Market - Revenue and Forecast to 2028 (US$ Million)7
- 10.3.6.5.1 Overview7
- 10.3.6.5.2 Australia: Cone Beam Computed Tomography Market - Revenue and Forecast to 2028 (US$ Million)7
- 10.3.6.5.3 Australia: Cone Beam Computed Tomography Market, by Patient Positioning, 2019-2028 (US$ Million)8
- 10.3.6.5.4 Australia: Cone Beam Computed Tomography Market, by Application, 2019-2028 (US$ Million)8
- 10.3.6.5.4.1 Australia: Cone Beam Computed Tomography Market, by Dental Application, 2019-2028 (US$ Million)9
- 10.3.6.5.5 Australia: Cone Beam Computed Tomography Market, by End User, 2019-2028 (US$ Million)9
- 10.3.6.6 Rest of Asia Pacific: Cone Beam Computed Tomography Market - Revenue and Forecast to 2028 (US$ Million)0
- 10.3.6.6.1 Overview0
- 10.3.6.6.2 Rest of Asia Pacific: Cone Beam Computed Tomography Market - Revenue and Forecast to 2028 (US$ Million)0
- 10.3.6.6.3 Rest of Asia Pacific: Cone Beam Computed Tomography Market, by Patient Positioning, 2019-2028 (US$ Million)1
- 10.3.6.6.4 Rest of Asia Pacific: Cone Beam Computed Tomography Market, by Application, 2019-2028 (US$ Million)1
- 10.3.6.6.4.1 Rest of Asia Pacific: Cone Beam Computed Tomography Market, by Dental Application, 2019-2028 (US$ Million)2
- 10.3.6.6.5 Rest of Asia Pacific: Cone Beam Computed Tomography Market, by End User, 2019-2028 (US$ Million)2
- 10.3.6.1 China: Cone Beam Computed Tomography Market - Revenue and Forecast to 2028 (US$ Million)5
- 10.4 Middle East & Africa Cone Beam Computed Tomography Market3
- 10.4.1 Overview3
- 10.4.2 Middle East & Africa: Cone Beam Computed Tomography Market - Revenue and Forecast to 2028 (US$ Million)4
- 10.4.3 Middle East & Africa: Cone Beam Computed Tomography Market, by Patient Positioning, 2019-2028 (US$ Million)4
- 10.4.4 Middle East & Africa: Cone Beam Computed Tomography Market, by Application, 2019-2028 (US$ Million)5
- 10.4.4.1 Middle East & Africa: Cone Beam Computed Tomography Market, by Dental Application, 2019-2028 (US$ Million)5
- 10.4.5 Middle East & Africa Cone Beam Computed Tomography Market, by End User, 2019-2028 (US$ Million)6
- 10.4.6 Middle East & Africa: Cone Beam Computed Tomography Market, by Country, 2021 & 2028 (%)6
- 10.4.6.1 UAE: Cone Beam Computed Tomography Market - Revenue and Forecast to 2028 (US$ Million)7
- 10.4.6.1.1 Overview7
- 10.4.6.1.2 UAE: Cone Beam Computed Tomography Market - Revenue and Forecast to 2028 (US$ Million)7
- 10.4.6.1.3 UAE: Cone Beam Computed Tomography Market, by Patient Positioning, 2019-2028 (US$ Million)8
- 10.4.6.1.4 UAE: Cone Beam Computed Tomography Market, by Application, 2019-2028 (US$ Million)8
- 10.4.6.1.4.1 UAE: Cone Beam Computed Tomography Market, by Dental Application, 2019-2028 (US$ Million)9
- 10.4.6.1.5 UAE Cone Beam Computed Tomography Market, by End User, 2019-2028 (US$ Million)9
- 10.4.6.2 Saudi Arabia: Cone Beam Computed Tomography Market - Revenue and Forecast to 2028 (US$ Million)0
- 10.4.6.2.1 Overview0
- 10.4.6.2.2 Saudi Arabia: Cone Beam Computed Tomography Market - Revenue and Forecast to 2028 (US$ Million)0
- 10.4.6.2.3 Saudi Arabia: Cone Beam Computed Tomography Market, by Patient Positioning, 2019-2028 (US$ Million)1
- 10.4.6.2.4 Saudi Arabia: Cone Beam Computed Tomography Market, by Application, 2019-2028 (US$ Million)1
- 10.4.6.2.4.1 Saudi Arabia: Cone Beam Computed Tomography Market, by Dental Application, 2019-2028 (US$ Million)2
- 10.4.6.2.5 Saudi Arabia Cone Beam Computed Tomography Market, by End User, 2019-2028 (US$ Million)2
- 10.4.6.3 South Africa: Cone Beam Computed Tomography Market - Revenue and Forecast to 2028 (US$ Million)3
- 10.4.6.3.1 Overview3
- 10.4.6.3.2 South Africa: Cone Beam Computed Tomography Market - Revenue and Forecast to 2028 (US$ Million)3
- 10.4.6.3.3 South Africa: Cone Beam Computed Tomography Market, by Patient Positioning, 2019-2028 (US$ Million)4
- 10.4.6.3.4 South Africa: Cone Beam Computed Tomography Market, by Application, 2019-2028 (US$ Million)4
- 10.4.6.3.4.1 South Africa: Cone Beam Computed Tomography Market, by Dental Application, 2019-2028 (US$ Million)5
- 10.4.6.3.5 South Africa Cone Beam Computed Tomography Market, by End User, 2019-2028 (US$ Million)5
- 10.4.6.4 Rest of Middle East & Africa: Cone Beam Computed Tomography Market - Revenue and Forecast to 2028 (US$ Million)6
- 10.4.6.4.1 Overview6
- 10.4.6.4.2 Rest of Middle East & Africa: Cone Beam Computed Tomography Market - Revenue and Forecast to 2028 (US$ Million)6
- 10.4.6.4.3 Rest of Middle East & Africa: Cone Beam Computed Tomography Market, by Patient Positioning, 2019-2028 (US$ Million)7
- 10.4.6.4.4 Rest of Middle East & Africa: Cone Beam Computed Tomography Market, by Application, 2019-2028 (US$ Million)7
- 10.4.6.4.4.1 Rest of Middle East & Africa: Cone Beam Computed Tomography Market, by Dental Application, 2019-2028 (US$ Million)8
- 10.4.6.4.5 Rest of Middle East & Africa Cone Beam Computed Tomography Market, by End User, 2019-2028 (US$ Million)8
- 10.4.6.1 UAE: Cone Beam Computed Tomography Market - Revenue and Forecast to 2028 (US$ Million)7
- 10.5 South & Central America Cone Beam Computed Tomography Market9
- 10.5.1 Overview9
- 10.5.2 South & Central America: Cone Beam Computed Tomography Market - Revenue and Forecast to 2028 (US$ Million)0
- 10.5.3 South & Central America: Cone Beam Computed Tomography Market, by Patient Positioning, 2019-2028 (US$ Million)0
- 10.5.4 South & Central America: Cone Beam Computed Tomography Market, by Application, 2019-2028 (US$ Million)1
- 10.5.4.1 South & Central America: Cone Beam Computed Tomography Market, by Dental, 2019-2028 (US$ Million)1
- 10.5.5 South & Central America: Cone Beam Computed Tomography Market, by End User, 2019-2028 (US$ Million)2
- 10.5.6 South & Central America: Cone Beam Computed Tomography Market, by Country, 2021 & 2028 (%)2
- 10.5.6.1 Brazil: Cone Beam Computed Tomography Market - Revenue and Forecast to 2028 (US$ Million)3
- 10.5.6.1.1 Overview3
- 10.5.6.1.2 Brazil: Cone Beam Computed Tomography Market - Revenue and Forecast to 2028 (US$ Million)3
- 10.5.6.1.3 Brazil: Cone Beam Computed Tomography Market, by Patient Positioning, 2019-2028 (US$ Million)4
- 10.5.6.1.4 Brazil: Cone Beam Computed Tomography Market, by Application, 2019-2028 (US$ Million)4
- 10.5.6.1.4.1 Brazil: Cone Beam Computed Tomography Market, by Dental, 2019-2028 (US$ Million)5
- 10.5.6.1.5 Brazil: Cone Beam Computed Tomography Market, by End User, 2019-2028 (US$ Million)5
- 10.5.6.2 Argentina: Cone Beam Computed Tomography Market - Revenue and Forecast to 2028 (US$ Million)6
- 10.5.6.2.1 Overview6
- 10.5.6.2.2 Argentina: Cone Beam Computed Tomography Market - Revenue and Forecast to 2028 (US$ Million)6
- 10.5.6.2.3 Argentina: Cone Beam Computed Tomography Market, by Patient Positioning, 2019-2028 (US$ Million)7
- 10.5.6.2.4 Argentina: Cone Beam Computed Tomography Market, by Application, 2019-2028 (US$ Million)7
- 10.5.6.2.4.1 Argentina: Cone Beam Computed Tomography Market, by Dental, 2019-2028 (US$ Million)8
- 10.5.6.2.5 Argentina: Cone Beam Computed Tomography Market, by End User, 2019-2028 (US$ Million)8
- 10.5.6.3 Rest of South & Central America: Cone Beam Computed Tomography Market - Revenue and Forecast to 2028 (US$ Million)9
- 10.5.6.3.1 Overview9
- 10.5.6.3.2 Rest of South & Central America: Cone Beam Computed Tomography Market - Revenue and Forecast to 2028 (US$ Million)9
- 10.5.6.3.3 Rest of South & Central America: Cone Beam Computed Tomography Market, by Patient Positioning, 2019-2028 (US$ Million)0
- 10.5.6.3.4 Rest of South & Central America: Cone Beam Computed Tomography Market, by Application, 2019-2028 (US$ Million)0
- 10.5.6.3.4.1 Rest of South & Central America: Cone Beam Computed Tomography Market, by Dental, 2019-2028 (US$ Million)1
- 10.5.6.3.5 Rest of South & Central America: Cone Beam Computed Tomography Market, by End User, 2019-2028 (US$ Million)1
- 10.5.6.1 Brazil: Cone Beam Computed Tomography Market - Revenue and Forecast to 2028 (US$ Million)3
11. Impact Of COVID-19 Pandemic on Cone Beam Computed Tomography Market2
- 11.1 North America: Impact Assessment of COVID-19 Pandemic2
- 11.2 Europe: Impact Assessment of COVID-19 Pandemic4
- 11.3 Asia Pacific: Impact Assessment of COVID-19 Pandemic6
- 11.4 Middle East & Africa: Impact Assessment of COVID-19 Pandemic8
- 11.5 South & Central America: Impact Assessment of COVID-19 Pandemic0
12. Cone Beam Computed Tomography Market - Industry Landscape2
- 12.1 Overview2
- 12.2 Growth Strategies in Cone Beam Computed Tomography Market2
- 12.3 Inorganic Growth Strategies3
- 12.3.1 Overview3
- 12.4 Organic Growth Strategies3
- 12.4.1 Overview3
13. Company Profiles4
- 13.1 Dentsply Sirona Inc4
- 13.1.1 Key Facts4
- 13.1.2 Business Description4
- 13.1.3 Products and Services4
- 13.1.4 Financial Overview5
- 13.1.5 SWOT Analysis6
- 13.1.6 Key Developments7
- 13.2 Newtom8
- 13.2.1 Key Facts8
- 13.2.2 Business Description8
- 13.2.3 Products and Services8
- 13.2.4 Financial Overview8
- 13.2.5 SWOT Analysis9
- 13.2.6 Key Developments9
- 13.3 Carestream Dental LLC.0
- 13.3.1 Key Facts0
- 13.3.2 Business Description0
- 13.3.3 Products and Services0
- 13.3.4 Financial Overview0
- 13.3.5 SWOT Analysis1
- 13.3.6 Key Developments1
- 13.4 Fussen Group2
- 13.4.1 Key Facts2
- 13.4.2 Business Description2
- 13.4.3 Products and Services2
- 13.4.4 Financial Overview2
- 13.4.5 SWOT Analysis3
- 13.4.6 Key Developments3
- 13.5 PreXion4
- 13.5.1 Key Facts4
- 13.5.2 Business Description4
- 13.5.3 Products and Services4
- 13.5.4 Financial Overview4
- 13.5.5 SWOT Analysis5
- 13.5.6 Key Developments5
- 13.6 Brainlab AG6
- 13.6.1 Key Facts6
- 13.6.2 Business Description6
- 13.6.3 Products and Services6
- 13.6.4 Financial Overview6
- 13.6.5 SWOT Analysis7
- 13.6.6 Key Developments7
- 13.7 IDETEC MEDICAL IMAGING8
- 13.7.1 Key Facts8
- 13.7.2 Business Description8
- 13.7.3 Products and Services8
- 13.7.4 Financial Overview8
- 13.7.5 SWOT Analysis9
- 13.7.6 Key Developments9
- 13.8 Vatech Co., Ltd.0
- 13.8.1 Key Facts0
- 13.8.2 Business Description0
- 13.8.3 Products and Services0
- 13.8.4 Financial Overview1
- 13.8.5 SWOT Analysis1
- 13.8.6 Key Developments1
- 13.9 Planmeca Oy2
- 13.9.1 Key Facts2
- 13.9.2 Business Description2
- 13.9.3 Products and Services2
- 13.9.4 Financial Overview2
- 13.9.5 SWOT Analysis3
- 13.9.6 Key Developments3
- 13.10 Canon Medical Systems4
- 13.10.1 Key Facts4
- 13.10.2 Business Description4
- 13.10.3 Products and Services4
- 13.10.4 Financial Overview5
- 13.10.5 SWOT Analysis6
- 13.10.6 Key Developments7