|
|
市場調査レポート
商品コード
1141891
仮想パイプラインシステムの2028年までの市場予測-世界分析- タイプ、ガス、圧力定格、アプリケーション別Virtual Pipeline Systems Market Forecast to 2028 - COVID-19 Impact and Global Analysis - by Type, Gas, Pressure Rating, and Application |
||||||
|
|
|||||||


| 仮想パイプラインシステムの2028年までの市場予測-世界分析- タイプ、ガス、圧力定格、アプリケーション別 |
|
出版日: 2022年10月04日
発行: The Insight Partners
ページ情報: 英文 181 Pages
納期: 即納可能
|
- 全表示
- 概要
- 図表
- 目次
仮想パイプラインシステム市場は、2022年の11億9159万米ドルから2028年には18億8683万米ドルに成長すると予測されています。2022年から2028年までのCAGRは9.2%と推定されています。
世界のエネルギー需要の高まりとガス探査活動の活発化が、仮想パイプラインシステム市場の成長を後押しすると予想されます。また、従来のパイプラインインフラから仮想パイプラインシステムへの移行が進んでいることも、予測期間中の仮想パイプラインシステム市場の成長に拍車をかけると予想されます。仮想パイプラインは、天然ガスの輸送に柔軟性をもたらし、大規模な物理的パイプラインの設置の必要性を排除します。したがって、仮想パイプラインシステムは、石油・ガス産業でより多くの牽引力を得ています。
欧州、米国、中東諸国におけるシェールガスの採掘量の増加が、仮想パイプラインシステムの需要を促進しています。欧州連合(EU)は、米国の液化天然ガスの増加供給とパイプラインの輸入のためのより良い契約状況のために、シェールガス探査活動の上昇のために大きな成長を示すことが期待されます。低コストで環境負荷の少ない新世代のシェールガス開発手法により、2030年以降の長期的にはEU域内のシェールガス埋蔵量が魅力的なものになるかもしれないです。中国は最も多くのシェールガスを埋蔵しており、その生産量のかなりの部分が四川盆地から産出されています。そのため、関連技術の開発によるシェルガス探査・採掘プロジェクトの増加と、埋蔵量の多さが相まって、仮想パイプラインシステムの需要を押し上げ、市場成長を後押ししています。
しかし、従来型のパイプライン・インフラが大きく支配していることが、市場成長の妨げになる可能性があります。従来のパイプラインインフラの受け入れは、仮想パイプラインインフラよりも高く、これは世界の仮想パイプラインシステム市場の成長に影響を与える主要な要因の1つです。政府機関や民間企業は、仮想よりも従来型のパイプラインを採用し、大規模な投資を行うことが進んでいます。
また、エネルギー需要の増大は、市場の成長にプラスの影響を与えると予想されます。日本を除くアジア太平洋地域のほとんどの国で、2024年まで電力需要の増加が続くと予想されています。
仮想パイプラインシステム市場は、主にBaker Hughes、Certarus Ltd.、CNG Services Ltd、Exxon Mobil Corporation、Galileo Technologies S.A.などのプレーヤーによって支配されており、さらにこれらのプレーヤーは、新製品の発売、市場イニシアティブ、技術的アップグレードへの投資、M&A、その他の共同活動を通じて事業を拡大させています。
例えば、2021年12月、Certarus Ltd.は、完全統合型代替エネルギー企業であるQuantum Fuel Systemsから業界最先端の水素用仮想パイプライントレーラーを確保しました。Quantum社のVPLite-H45/40'トレーラーは、3,600気圧でガス質量803kgで、Certarus社に納入されました(248気圧)。このトレーラは、カナダと米国の両方で使用が許可されています。
COVID-19バーチャルパイプラインシステムへの影響市況
ほとんどの欧州連合諸国は、ロシアにリンクしていないEUクロスボーダー内の相当なパイプライン容量を持っています。例えば、欧州送電システム運用者ネットワークによると、ドイツはノルウェー、ベルギー、スイス、オーストリア、デンマーク、オランダから合計114Bcmの容量を保有しているが、年間総消費量は94Bcmです。このように、欧州各国の天然ガス容量ネットワークは、COVID-19の大流行で支障をきたしています。しかし、COVID-19の流行は、スペイン-フランス間、イタリア-中欧間、中欧・南東欧間、ドイツ-イタリア間のパイプラインの需要減退と操業停止を招いた。また、新規プロジェクトのリスクとして、温室効果ガス排出への取り組みが挙げられます。
仮想パイプラインシステム市場調査でプロファイルされている企業には、Bayotech, Inc、CNG Services Ltd、Petroliam Nasional Berhad(PETRONAS)、RAG Austria AG、Quantum Fuel Systems LLC、Galileo Technologies S.A、Chart Industries, Inc、SHIJIAZHUANG ENRIC GAS EQUIPMENT CO., LTD、Fiba Technologies Inc、Hexagon Agility、Composite Advanced Technologies、LLCが含まれています。仮想パイプラインシステム市場のプレイヤーは、競争力を維持するために有機的および無機的な成長戦略に従っています。研究開発への投資やバーチャルリアリティ(VR)シミュレータのトレーニングセンターの形成など、数多くの取り組みがバーチャルパイプラインシステム市場の成長にプラスの影響を与えると予想されます。例えば、2022年、チャートはCSC Cryogenic Service Center AB(CSC)を買収しました。スウェーデンの同社は、多くの重複する顧客を持つ北欧地域の強力なサービスの足跡を追加し、同社はサービスと修理のプレゼンスを地理的に広げ、強力な元の機器のインストールされたデータベースに対してさらにローカライズされたサポートを提供することができるようになりました。
仮想パイプラインシステム市場の全体的な分析は、一次情報と二次情報の両方を用いて行われました。調査プロセスを開始するにあたり、仮想パイプラインシステム市場に関連する定性的・定量的情報を得るために、社内外の情報源を用いて徹底的な二次調査を実施しました。このプロセスは、すべての市場セグメントに関する仮想パイプラインシステムの市場規模の概要と予測を得るという目的も兼ねています。また、業界関係者やコメンテーターは、データを検証し、より分析的な洞察を得るために、複数の一次インタビューを実施しました。仮想パイプラインシステム市場の調査に通常参加するのは、副社長、事業開発マネージャー、市場情報マネージャー、国内営業マネージャー、仮想パイプラインシステム市場を専門とする評価専門家、調査アナリスト、キーオピニオンリーダーなどの外部コンサルタントなどです。
目次
第1章 イントロダクション
- 調査範囲
- インサイトパートナーズの調査報告書ガイダンス
- 市場セグメンテーション
第2章 重要なポイント
第3章 調査手法
- 対象範囲
- 2次調査
- 1次調査
第4章 バーチャルパイプラインシステム市場の情勢
- 市場概要
- PEST分析
- 北米
- 欧州
- アジア太平洋地域
- 中東・アフリカ地域
- 南米
- エコシステム分析
- 専門家の見解
第5章 バーチャルパイプラインシステム市場- 主な市場力学
- 市場促進要因
- エネルギー需要の増加別バーチャルパイプラインシステムへのニーズの高まり
- シェールガス採掘の増加別バーチャルパイプラインシステムの需要増加
- 市場抑制要因
- 従来型パイプラインのインフラストラクチャの重要な優位性
- 市場機会
- 天然ガス消費への傾倒の高まり
- 今後の動向
- VPS技術への投資の増加
- 促進要因と抑制要因の影響分析
第6章 バーチャルパイプラインシステム- 世界市場分析
- 仮想パイプラインシステムの世界市場概要
- バーチャルパイプラインシステムの世界市場収益と予測・分析
- 市場のポジショニング-主要5社
- 市場プレイヤーの分析
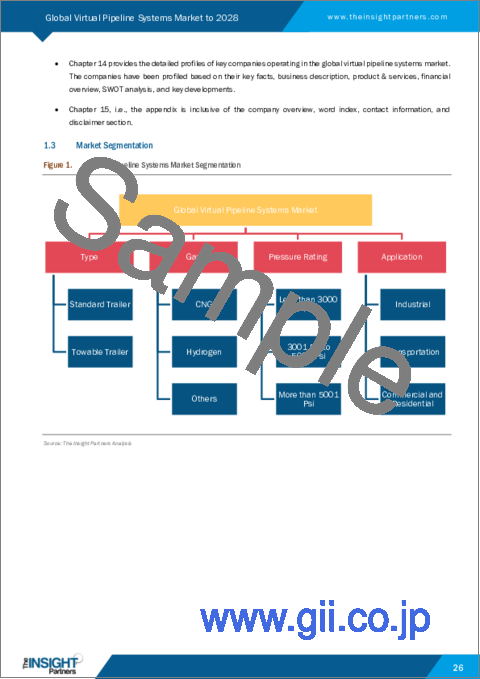
第7章 バーチャルパイプラインシステムの世界市場- タイプ別
- バーチャルパイプラインシステム市場:タイプ別(2020年、2028年)
- 標準トレーラ
- 牽引式トレーラ
第8章 バーチャルパイプラインシステム市場~ガス別
- バーチャルパイプラインシステム市場:ガス別(2020年、2028年)
- CNG
- 水素
- その他
第9章 バーチャルパイプラインシステム市場~圧力等級別
- バーチャルパイプラインシステム市場:圧力定格別(2020年、2028年)
- 3000Psi未満
- Psi~5000Psi
- 5001Psi以上
第10章 バーチャルパイプラインシステム市場~アプリケーション別
- バーチャルパイプラインシステム市場:アプリケーション別(2020年、2028年)
- 産業用
- 運輸
- 商業・住宅用
第11章 バーチャルパイプラインシステム市場- 地域別分析
- 北米
- 米国
- カナダ
- メキシコ
- 欧州
- ドイツ
- フランス
- イタリア
- 英国
- ロシア
- その他欧州
- APAC
- オーストラリア
- 中国
- インド
- 日本
- 韓国
- APACのその他諸国
- MEA
- 南アフリカ
- サウジアラビア
- UAE
- MEAの残りの地域
- 南米
- ブラジル
- アルゼンチン
- その他の南米地域
第12章 バーチャルパイプラインシステム市場-COVID-19インパクト分析
- COVID-19のパンデミック別仮想パイプラインシステムの世界市場への影響
- 北米
- 欧州
- アジア太平洋地域
- 中東・アフリカ
- 南米
第13章 業界の情勢
- 新製品発売
- 合併・買収
第14章 企業プロファイル
- Galileo Technologies S.A.
- Bayotech, Inc.
- Petroliam Nasional Berhad(PETRONAS)
- RAG Austria AG
- Quantum Fuel Systems LLC.
- Chart Industries, Inc.
- SHIJIAZHUANG ENRIC GAS EQUIPMENT CO., LTD.
- Fiba Technologies Inc
- Hexagon Agility
- Composite Advanced Technologies, LLC.
第15章 付録
- The Insight Partners について
- 単語索引
List Of Tables
- Table 1. Global Virtual Pipeline Systems Market Revenue and Forecast to 2028 (US$ Million)
- Table 2. North America: Virtual Pipeline Systems Market, By Type - Revenue and Forecast to 2028 (US$ Million)
- Table 3. North America: Virtual Pipeline Systems Market, By Gas - Revenue and Forecast to 2028 (US$ Million)
- Table 4. North America: Virtual Pipeline Systems Market, By Pressure Rating - Revenue and Forecast to 2028 (US$ Million)
- Table 5. North America: Virtual Pipeline Systems Market, By Application - Revenue and Forecast to 2028 (US$ Million)
- Table 6. North America: Virtual Pipeline Systems Market, By Country - Revenue and Forecast to 2028 (US$ Million)
- Table 7. US: Virtual Pipeline Systems Market, By Type - Revenue and Forecast to 2028 (US$ Million)
- Table 8. US: Virtual Pipeline Systems Market, By Gas - Revenue and Forecast to 2028 (US$ Million)
- Table 9. US: Virtual Pipeline Systems Market, By Pressure Rating - Revenue and Forecast to 2028 (US$ Million)
- Table 10. US: Virtual Pipeline Systems Market, By Application - Revenue and Forecast to 2028 (US$ Million)
- Table 11. Canada: Virtual Pipeline Systems Market, By Type - Revenue and Forecast to 2028 (US$ Million)
- Table 12. Canada: Virtual Pipeline Systems Market, By Gas - Revenue and Forecast to 2028 (US$ Million)
- Table 13. Canada: Virtual Pipeline Systems Market, By Pressure Rating - Revenue and Forecast to 2028 (US$ Million)
- Table 14. Canada: Virtual Pipeline Systems Market, By Application - Revenue and Forecast to 2028 (US$ Million)
- Table 15. Mexico: Virtual Pipeline Systems Market, By Type - Revenue and Forecast to 2028 (US$ Million)
- Table 16. Mexico: Virtual Pipeline Systems Market, By Gas - Revenue and Forecast to 2028 (US$ Million)
- Table 17. Mexico: Virtual Pipeline Systems Market, By Pressure Rating - Revenue and Forecast to 2028 (US$ Million)
- Table 18. Mexico: Virtual Pipeline Systems Market, By Application - Revenue and Forecast to 2028 (US$ Million)
- Table 19. Europe: Virtual Pipeline Systems Market, By Type - Revenue and Forecast to 2028 (US$ Million)
- Table 20. Europe: Virtual Pipeline Systems Market, By Gas - Revenue and Forecast to 2028 (US$ Million)
- Table 21. Europe: Virtual Pipeline Systems Market, By Pressure Rating - Revenue and Forecast to 2028 (US$ Million)
- Table 22. Europe: Virtual Pipeline Systems Market, By Application - Revenue and Forecast to 2028 (US$ Million)
- Table 23. Europe: Virtual Pipeline Systems Market, By Country - Revenue and Forecast to 2028 (US$ Million)
- Table 24. Germany: Virtual Pipeline Systems Market, By Type - Revenue and Forecast to 2028 (US$ Million)
- Table 25. Germany: Virtual Pipeline Systems Market, By Gas - Revenue and Forecast to 2028 (US$ Million)
- Table 26. Germany: Virtual Pipeline Systems Market, By Pressure Rating - Revenue and Forecast to 2028 (US$ Million)
- Table 27. Germany: Virtual Pipeline Systems Market, By Application - Revenue and Forecast to 2028 (US$ Million)
- Table 28. France: Virtual Pipeline Systems Market, By Type - Revenue and Forecast to 2028 (US$ Million)
- Table 29. France: Virtual Pipeline Systems Market, By Gas - Revenue and Forecast to 2028 (US$ Million)
- Table 30. France: Virtual Pipeline Systems Market, By Pressure Rating - Revenue and Forecast to 2028 (US$ Million)
- Table 31. France: Virtual Pipeline Systems Market, By Application - Revenue and Forecast to 2028 (US$ Million)
- Table 32. Italy: Virtual Pipeline Systems Market, By Type - Revenue and Forecast to 2028 (US$ Million)
- Table 33. Italy: Virtual Pipeline Systems Market, By Gas - Revenue and Forecast to 2028 (US$ Million)
- Table 34. Italy: Virtual Pipeline Systems Market, By Pressure Rating - Revenue and Forecast to 2028 (US$ Million)
- Table 35. Italy: Virtual Pipeline Systems Market, By Application - Revenue and Forecast to 2028 (US$ Million)
- Table 36. UK: Virtual Pipeline Systems Market, By Type - Revenue and Forecast to 2028 (US$ Million)
- Table 37. UK: Virtual Pipeline Systems Market, By Gas - Revenue and Forecast to 2028 (US$ Million)
- Table 38. UK: Virtual Pipeline Systems Market, By Pressure Rating - Revenue and Forecast to 2028 (US$ Million)
- Table 39. UK: Virtual Pipeline Systems Market, By Application - Revenue and Forecast to 2028 (US$ Million)
- Table 40. Russia: Virtual Pipeline Systems Market, By Type - Revenue and Forecast to 2028 (US$ Million)
- Table 41. Russia: Virtual Pipeline Systems Market, By Gas - Revenue and Forecast to 2028 (US$ Million)
- Table 42. Russia: Virtual Pipeline Systems Market, By Pressure Rating - Revenue and Forecast to 2028 (US$ Million)
- Table 43. Russia: Virtual Pipeline Systems Market, By Application - Revenue and Forecast to 2028 (US$ Million)
- Table 44. Rest of Europe: Virtual Pipeline Systems Market, By Type - Revenue and Forecast to 2028 (US$ Million)
- Table 45. Rest of Europe: Virtual Pipeline Systems Market, By Gas - Revenue and Forecast to 2028 (US$ Million)
- Table 46. Rest of Europe: Virtual Pipeline Systems Market, By Pressure Rating - Revenue and Forecast to 2028 (US$ Million)
- Table 47. Rest of Europe: Virtual Pipeline Systems Market, By Application - Revenue and Forecast to 2028 (US$ Million)
- Table 48. APAC: Virtual Pipeline Systems Market, By Type - Revenue and Forecast to 2028 (US$ Million)
- Table 49. APAC: Virtual Pipeline Systems Market, By Gas - Revenue and Forecast to 2028 (US$ Million)
- Table 50. APAC: Virtual Pipeline Systems Market, By Pressure Rating - Revenue and Forecast to 2028 (US$ Million)
- Table 51. APAC: Virtual Pipeline Systems Market, By Application - Revenue and Forecast to 2028 (US$ Million)
- Table 52. APAC: Virtual Pipeline Systems Market, By Country - Revenue and Forecast to 2028 (US$ Million)
- Table 53. Australia: Virtual Pipeline Systems Market, By Type - Revenue and Forecast to 2028 (US$ Million)
- Table 54. Australia: Virtual Pipeline Systems Market, By Gas - Revenue and Forecast to 2028 (US$ Million)
- Table 55. Australia: Virtual Pipeline Systems Market, By Pressure Rating - Revenue and Forecast to 2028 (US$ Million)
- Table 56. Australia: Virtual Pipeline Systems Market, By Application - Revenue and Forecast to 2028 (US$ Million)
- Table 57. China: Virtual Pipeline Systems Market, By Type - Revenue and Forecast to 2028 (US$ Million)
- Table 58. China: Virtual Pipeline Systems Market, By Gas - Revenue and Forecast to 2028 (US$ Million)
- Table 59. China: Virtual Pipeline Systems Market, By Pressure Rating - Revenue and Forecast to 2028 (US$ Million)
- Table 60. China: Virtual Pipeline Systems Market, By Application - Revenue and Forecast to 2028 (US$ Million)
- Table 61. India: Virtual Pipeline Systems Market, By Type - Revenue and Forecast to 2028 (US$ Million)
- Table 62. India: Virtual Pipeline Systems Market, By Gas - Revenue and Forecast to 2028 (US$ Million)
- Table 63. India: Virtual Pipeline Systems Market, By Pressure Rating - Revenue and Forecast to 2028 (US$ Million)
- Table 64. India: Virtual Pipeline Systems Market, By Application - Revenue and Forecast to 2028 (US$ Million)
- Table 65. Japan: Virtual Pipeline Systems Market, By Type - Revenue and Forecast to 2028 (US$ Million)
- Table 66. Japan: Virtual Pipeline Systems Market, By Gas - Revenue and Forecast to 2028 (US$ Million)
- Table 67. Japan: Virtual Pipeline Systems Market, By Pressure Rating - Revenue and Forecast to 2028 (US$ Million)
- Table 68. Japan: Virtual Pipeline Systems Market, By Application - Revenue and Forecast to 2028 (US$ Million)
- Table 69. South Korea: Virtual Pipeline Systems Market, By Type - Revenue and Forecast to 2028 (US$ Million)
- Table 70. South Korea: Virtual Pipeline Systems Market, By Gas - Revenue and Forecast to 2028 (US$ Million)
- Table 71. South Korea: Virtual Pipeline Systems Market, By Pressure Rating - Revenue and Forecast to 2028 (US$ Million)
- Table 72. South Korea: Virtual Pipeline Systems Market, By Application - Revenue and Forecast to 2028 (US$ Million)
- Table 73. Rest of APAC: Virtual Pipeline Systems Market, By Type - Revenue and Forecast to 2028 (US$ Million)
- Table 74. Rest of APAC: Virtual Pipeline Systems Market, By Gas - Revenue and Forecast to 2028 (US$ Million)
- Table 75. Rest of APAC: Virtual Pipeline Systems Market, By Pressure Rating - Revenue and Forecast to 2028 (US$ Million)
- Table 76. Rest of APAC: Virtual Pipeline Systems Market, By Application - Revenue and Forecast to 2028 (US$ Million)
- Table 77. MEA: Virtual Pipeline Systems Market, By Type - Revenue and Forecast to 2028 (US$ Million)
- Table 78. MEA: Virtual Pipeline Systems Market, By Gas - Revenue and Forecast to 2028 (US$ Million)
- Table 79. MEA: Virtual Pipeline Systems Market, By Pressure Rating - Revenue and Forecast to 2028 (US$ Million)
- Table 80. MEA: Virtual Pipeline Systems Market, By Application - Revenue and Forecast to 2028 (US$ Million)
- Table 81. MEA: Virtual Pipeline Systems Market, By Country - Revenue and Forecast to 2028 (US$ Million)
- Table 82. South Africa: Virtual Pipeline Systems Market, By Type - Revenue and Forecast to 2028 (US$ Million)
- Table 83. South Africa: Virtual Pipeline Systems Market, By Gas - Revenue and Forecast to 2028 (US$ Million)
- Table 84. South Africa: Virtual Pipeline Systems Market, By Pressure Rating - Revenue and Forecast to 2028 (US$ Million)
- Table 85. South Africa: Virtual Pipeline Systems Market, By Application - Revenue and Forecast to 2028 (US$ Million)
- Table 86. Saudi Arabia: Virtual Pipeline Systems Market, By Type - Revenue and Forecast to 2028 (US$ Million)
- Table 87. Saudi Arabia: Virtual Pipeline Systems Market, By Gas - Revenue and Forecast to 2028 (US$ Million)
- Table 88. Saudi Arabia: Virtual Pipeline Systems Market, By Pressure Rating - Revenue and Forecast to 2028 (US$ Million)
- Table 89. Saudi Arabia: Virtual Pipeline Systems Market, By Application - Revenue and Forecast to 2028 (US$ Million)
- Table 90. UAE: Virtual Pipeline Systems Market, By Type - Revenue and Forecast to 2028 (US$ Million)
- Table 91. UAE: Virtual Pipeline Systems Market, By Gas - Revenue and Forecast to 2028 (US$ Million)
- Table 92. UAE: Virtual Pipeline Systems Market, By Pressure Rating - Revenue and Forecast to 2028 (US$ Million)
- Table 93. UAE: Virtual Pipeline Systems Market, By Application - Revenue and Forecast to 2028 (US$ Million)
- Table 94. Rest of MEA: Virtual Pipeline Systems Market, By Type - Revenue and Forecast to 2028 (US$ Million)
- Table 95. Rest of MEA: Virtual Pipeline Systems Market, By Gas - Revenue and Forecast to 2028 (US$ Million)
- Table 96. Rest of MEA: Virtual Pipeline Systems Market, By Pressure Rating - Revenue and Forecast to 2028 (US$ Million)
- Table 97. Rest of MEA: Virtual Pipeline Systems Market, By Application - Revenue and Forecast to 2028 (US$ Million)
- Table 98. SAM: Virtual Pipeline Systems Market, By Type - Revenue and Forecast to 2028 (US$ Million)
- Table 99. SAM: Virtual Pipeline Systems Market, By Gas - Revenue and Forecast to 2028 (US$ Million)
- Table 100. SAM: Virtual Pipeline Systems Market, By Pressure Rating - Revenue and Forecast to 2028 (US$ Million)
- Table 101. SAM: Virtual Pipeline Systems Market, By Application - Revenue and Forecast to 2028 (US$ Million)
- Table 102. SAM: Virtual Pipeline Systems Market, By Country - Revenue and Forecast to 2028 (US$ Million)
- Table 103. Brazil: Virtual Pipeline Systems Market, By Type - Revenue and Forecast to 2028 (US$ Million)
- Table 104. Brazil: Virtual Pipeline Systems Market, By Gas - Revenue and Forecast to 2028 (US$ Million)
- Table 105. Brazil: Virtual Pipeline Systems Market, By Pressure Rating - Revenue and Forecast to 2028 (US$ Million)
- Table 106. Brazil: Virtual Pipeline Systems Market, By Application - Revenue and Forecast to 2028 (US$ Million)
- Table 107. Argentina: Virtual Pipeline Systems Market, By Type - Revenue and Forecast to 2028 (US$ Million)
- Table 108. Argentina: Virtual Pipeline Systems Market, By Gas - Revenue and Forecast to 2028 (US$ Million)
- Table 109. Argentina: Virtual Pipeline Systems Market, By Pressure Rating - Revenue and Forecast to 2028 (US$ Million)
- Table 110. Argentina: Virtual Pipeline Systems Market, By Application - Revenue and Forecast to 2028 (US$ Million)
- Table 111. Rest of SAM: Virtual Pipeline Systems Market, By Type - Revenue and Forecast to 2028 (US$ Million)
- Table 112. Rest of SAM: Virtual Pipeline Systems Market, By Gas - Revenue and Forecast to 2028 (US$ Million)
- Table 113. Rest of SAM: Virtual Pipeline Systems Market, By Pressure Rating - Revenue and Forecast to 2028 (US$ Million)
- Table 114. Rest of SAM: Virtual Pipeline Systems Market, By Application - Revenue and Forecast to 2028 (US$ Million)
- Table 115. List of Abbreviation
List Of Figures
- Figure 1. Virtual Pipeline Systems Market Segmentation
- Figure 2. Virtual Pipeline Systems Market Segmentation - By Geography
- Figure 3. Global Virtual Pipeline Systems Market Overview
- Figure 4. Virtual Pipeline Systems Market, By Type
- Figure 5. Virtual Pipeline Systems Market, By Gas
- Figure 6. Virtual Pipeline Systems Market, By Pressure Rating
- Figure 7. Virtual Pipeline Systems Market, By Application
- Figure 8. Virtual Pipeline Systems Market, By Geography
- Figure 9. North America - PEST Analysis
- Figure 10. Europe - PEST Analysis
- Figure 11. Asia-Pacific - PEST Analysis
- Figure 12. Middle East and Africa - PEST Analysis
- Figure 13. South America - PEST Analysis
- Figure 14. Virtual Pipeline Systems Market- Ecosystem Analysis
- Figure 15. Virtual Pipeline Systems Market Impact Analysis of Drivers and Restraints
- Figure 16. Geographic Overview of Virtual Pipeline Systems Market
- Figure 17. Global Virtual Pipeline Systems Market Revenue Forecast and Analysis (US$ Million)
- Figure 18. Virtual Pipeline Systems Market Revenue Share, by Type (2020 and 2028)
- Figure 19. Standard Trailer: Virtual Pipeline Systems Market - Revenue and Forecast to 2028 (US$ Million)
- Figure 20. Towable Trailer: Virtual Pipeline Systems Market - Revenue and Forecast to 2028 (US$ Million)
- Figure 21. Virtual Pipeline Systems Market Revenue Share, by Gas (2020 and 2028)
- Figure 22. CNG: Virtual Pipeline Systems Market - Revenue and Forecast to 2028 (US$ Million)
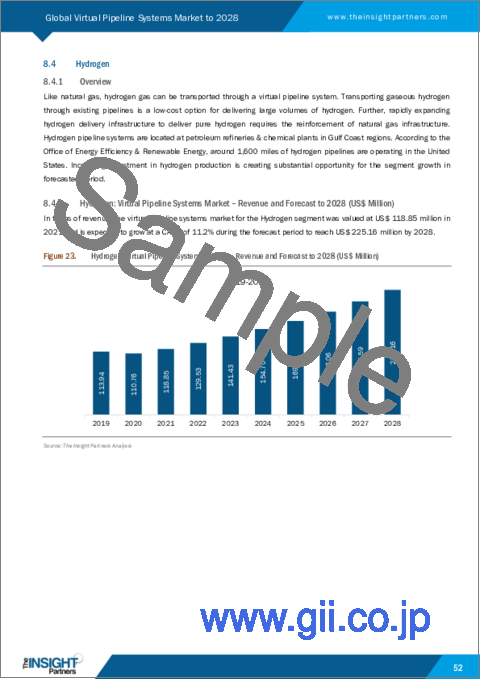
- Figure 23. Hydrogen: Virtual Pipeline Systems Market - Revenue and Forecast to 2028 (US$ Million)
- Figure 24. Others: Virtual Pipeline Systems Market - Revenue and Forecast to 2028 (US$ Million)
- Figure 25. Virtual Pipeline Systems Market Revenue Share, by Pressure Rating (2020 and 2028)
- Figure 26. Less than 3000 Psi: Virtual Pipeline Systems Market - Revenue and Forecast to 2028 (US$ Million)
- Figure 27.1 Psi to 5000 Psi: Virtual Pipeline Systems Market - Revenue and Forecast to 2028 (US$ Million)
- Figure 28. More than 5001 Psi: Virtual Pipeline Systems Market - Revenue and Forecast to 2028 (US$ Million)
- Figure 29. Virtual Pipeline Systems Market Revenue Share, by Application (2020 and 2028)
- Figure 30. Industrial: Virtual Pipeline Systems Market - Revenue and Forecast to 2028 (US$ Million)
- Figure 31. Transportation: Virtual Pipeline Systems Market - Revenue and Forecast to 2028 (US$ Million)
- Figure 32. Commercial & Residential: Virtual Pipeline Systems Market - Revenue and Forecast to 2028 (US$ Million)
- Figure 33. Global Virtual Pipeline Systems Market Revenue Share, By Region (2021 & 2028)
- Figure 34. North America: Virtual Pipeline Systems Market - Revenue and Forecast to 2028 (US$ Million)
- Figure 35. North America: Virtual Pipeline Systems Market Revenue Share, by Type (2021 & 2028)
- Figure 36. North America: Virtual Pipeline Systems Market Revenue Share, by Gas (2021 & 2028)
- Figure 37. North America: Virtual Pipeline Systems Market Revenue Share, by Pressure Rating (2021 & 2028)
- Figure 38. North America: Virtual Pipeline Systems Market Revenue Share, by Application (2021 & 2028)
- Figure 39. North America: Virtual Pipeline Systems Market Revenue Share, by Key Country (2021 & 2028)
- Figure 40. US: Virtual Pipeline Systems Market - Revenue and Forecast to 2028 (US$ Million)
- Figure 41. Canada: Virtual Pipeline Systems Market - Revenue and Forecast to 2028 (US$ Million)
- Figure 42. Mexico: Virtual Pipeline Systems Market - Revenue and Forecast to 2028 (US$ Million)
- Figure 43. Europe: Virtual Pipeline Systems Market - Revenue and Forecast to 2028 (US$ Million)
- Figure 44. Europe: Virtual Pipeline Systems Market Revenue Share, by Type (2021 & 2028)
- Figure 45. Europe: Virtual Pipeline Systems Market Revenue Share, by Gas (2021 & 2028)
- Figure 46. Europe: Virtual Pipeline Systems Market Revenue Share, by Pressure Rating (2021 & 2028)
- Figure 47. Europe: Virtual Pipeline Systems Market Revenue Share, by Application (2021 & 2028)
- Figure 48. Europe: Virtual Pipeline Systems Market Revenue Share, by Key Country (2021 & 2028)
- Figure 49. Germany: Virtual Pipeline Systems Market - Revenue and Forecast to 2028 (US$ Million)
- Figure 50. France: Virtual Pipeline Systems Market - Revenue and Forecast to 2028 (US$ Million)
- Figure 51. Italy: Virtual Pipeline Systems Market - Revenue and Forecast to 2028 (US$ Million)
- Figure 52. UK: Virtual Pipeline Systems Market - Revenue and Forecast to 2028 (US$ Million)
- Figure 53. Russia: Virtual Pipeline Systems Market - Revenue and Forecast to 2028 (US$ Million)
- Figure 54. Rest of Europe: Virtual Pipeline Systems Market - Revenue and Forecast to 2028 (US$ Million)
- Figure 55. APAC: Virtual Pipeline Systems Market - Revenue and Forecast to 2028 (US$ Million)
- Figure 56. APAC: Virtual Pipeline Systems Market Revenue Share, by Type (2021 & 2028)
- Figure 57. APAC: Virtual Pipeline Systems Market Revenue Share, by Gas (2021 & 2028)
- Figure 58. APAC: Virtual Pipeline Systems Market Revenue Share, by Pressure Rating (2021 & 2028)
- Figure 59. APAC: Virtual Pipeline Systems Market Revenue Share, by Application (2021 & 2028)
- Figure 60. APAC: Virtual Pipeline Systems Market Revenue Share, by Key Country (2021 & 2028)
- Figure 61. Australia: Virtual Pipeline Systems Market - Revenue and Forecast to 2028 (US$ Million)
- Figure 62. China: Virtual Pipeline Systems Market - Revenue and Forecast to 2028 (US$ Million)
- Figure 63. India: Virtual Pipeline Systems Market - Revenue and Forecast to 2028 (US$ Million)
- Figure 64. Japan: Virtual Pipeline Systems Market - Revenue and Forecast to 2028 (US$ Million)
- Figure 65. South Korea: Virtual Pipeline Systems Market - Revenue and Forecast to 2028 (US$ Million)
- Figure 66. Rest of APAC: Virtual Pipeline Systems Market - Revenue and Forecast to 2028 (US$ Million)
- Figure 67. MEA: Virtual Pipeline Systems Market - Revenue and Forecast to 2028 (US$ Million)
- Figure 68. MEA: Virtual Pipeline Systems Market Revenue Share, by Type (2021 & 2028)
- Figure 69. MEA: Virtual Pipeline Systems Market Revenue Share, by Gas (2021 & 2028)
- Figure 70. MEA: Virtual Pipeline Systems Market Revenue Share, by Pressure Rating (2021 & 2028)
- Figure 71. MEA: Virtual Pipeline Systems Market Revenue Share, by Application (2021 & 2028)
- Figure 72. MEA: Virtual Pipeline Systems Market Revenue Share, by Key Country (2021 & 2028)
- Figure 73. South Africa: Virtual Pipeline Systems Market - Revenue and Forecast to 2028 (US$ Million)
- Figure 74. Saudi Arabia: Virtual Pipeline Systems Market - Revenue and Forecast to 2028 (US$ Million)
- Figure 75. UAE: Virtual Pipeline Systems Market - Revenue and Forecast to 2028 (US$ Million)
- Figure 76. Rest of MEA: Virtual Pipeline Systems Market - Revenue and Forecast to 2028 (US$ Million)
- Figure 77. SAM: Virtual Pipeline Systems Market - Revenue and Forecast to 2028 (US$ Million)
- Figure 78. SAM: Virtual Pipeline Systems Market Revenue Share, by Type (2021 & 2028)
- Figure 79. SAM: Virtual Pipeline Systems Market Revenue Share, by Gas (2021 & 2028)
- Figure 80. SAM: Virtual Pipeline Systems Market Revenue Share, by Pressure Rating (2021 & 2028)
- Figure 81. SAM: Virtual Pipeline Systems Market Revenue Share, by Application (2021 & 2028)
- Figure 82. SAM: Virtual Pipeline Systems Market Revenue Share, by Key Country (2021 & 2028)
- Figure 83. Brazil: Virtual Pipeline Systems Market - Revenue and Forecast to 2028 (US$ Million)
- Figure 84. Argentina: Virtual Pipeline Systems Market - Revenue and Forecast to 2028 (US$ Million)
- Figure 85. Rest of SAM: Virtual Pipeline Systems Market - Revenue and Forecast to 2028 (US$ Million)
- Figure 86. Impact of COVID-19 Pandemic in North American Country Markets
- Figure 87. Impact of COVID-19 Pandemic in Europe Country Markets
- Figure 88. Impact of COVID-19 Pandemic in Asia Pacific Country Markets
- Figure 89. Impact of COVID-19 Pandemic in Middle East & Africa Country Markets
The virtual pipeline systems market is expected to grow from US$ 1,191.59 million in 2022 to US$ 1,886.83 million by 2028. It is estimated to grow at a CAGR of 9.2% from 2022 to 2028.
Growing energy demand and rising gas exploration activities globally are expected to boost the virtual pipeline systems market growth. In addition, the growing shift from conventional pipeline infrastructure to virtual pipeline systems is anticipated to fuel the virtual pipeline systems market growth over the forecast period. Virtual pipelines offer flexibility in transporting natural gas and remove the need for large physical pipeline installations. Thus, virtual pipeline systems are gaining more traction in the oil & gas industry.
The rising shale gas extraction across Europe, the US, and the Middle Eastern countries is driving the demand for virtual pipeline systems. The European Union (EU) is expected to witness a significant growth owing to rising shale gas exploration activities, owing to an increased supply of liquefied natural gas in the US and better contractual circumstances for pipeline imports. A new generation of shale gas exploitation methods, with lower costs and fewer environmental footprints, might make indigenous shale gas reserves in the EU appealing in the long term after 2030. China has the most shale reserves, and a sizable portion of its output comes from the Sichuan basin. Therefore, the increase in shell gas exploration and extraction projects due to developments in related technologies, coupled with the availability of a large number of reserves, is boosting the demand for virtual pipeline systems, thereby boosting market growth.
However, the significant dominance of conventional pipeline infrastructure may hamper the market growth. The acceptance of conventional pipeline infrastructure is higher than the virtual pipeline infrastructure, which is one of the primary factors affecting the global virtual pipeline system market growth. Government and private entities are progressively adopting conventional pipelines over virtual and making significant investments.
In addition, the growing energy demands are expected to impact market growth positively. Except for Japan, electricity demand in most countries in the Asia Pacific region is expected to continue to grow through 2024.
The virtual pipeline systems market is mainly dominated by players such as Baker Hughes, Certarus Ltd., CNG Services Ltd, Exxon Mobil Corporation, and Galileo Technologies S.A. Further, these players expand their business through new product launches, market initiatives, investment in technological upgrades, mergers & acquisitions, and other joint activities.
For instance, in December 2021, Certarus Ltd. secured industry-leading virtual pipeline trailers for hydrogen from Quantum Fuel Systems, a fully integrated alternative energy firm. Quantum's VPLite-H45/40' trailers, with a gas mass of 803 kg at 3,600 pressures, were delivered to Certarus (248 bar). The trailers are permitted for use in both Canada and the US.
COVID-19 Impact on Virtual pipeline systems Market
Most European Union countries have substantial pipeline capacity within EU cross-border that is not linked to Russia. For example, Germany has a total of 114 Bcm of capacity from Norway, Belgium, Switzerland, Austria, Denmark, and the Netherlands, while total annual consumption is 94 Bcm, according to the European Network of Transmission System Operators. Thus, the natural gas capacities network in European countries has been hampered due to COVID-19 pandemic. However, the COVID-19 pandemic brought reduction in demand and disruption in pipeline operations between Spain and France, Italy and Central Europe, Central Europe & South-Eastern Europe, and Germany and Italy. Risks to new projects also come from efforts to address greenhouse gas emissions.
Companies profiled in the virtual pipeline systems market study include Bayotech, Inc; CNG Services Ltd; Petroliam Nasional Berhad (PETRONAS); RAG Austria AG; Quantum Fuel Systems LLC; Galileo Technologies S.A.; Chart Industries, Inc.; SHIJIAZHUANG ENRIC GAS EQUIPMENT CO., LTD; Fiba Technologies Inc; Hexagon Agility; and Composite Advanced Technologies, LLC. Virtual pipeline systems market players are following both organic and inorganic growth strategies to sustain the competitive edge. Numerous initiatives, such as investment in research and development and the formation of virtual reality (VR) simulator training centers, are expected to impact the virtual pipeline systems market growth positively. For example, in 2022, Chart acquired CSC Cryogenic Service Center AB (CSC). The Swedish company adds a strong service footprint in the Nordic Region with many overlapping customers enabling the company to broaden its service and repair presence geographically and provide further localized support for its strong original equipment installed database.
The overall virtual pipeline systems market analysis has been derived using both primary and secondary sources. To begin the research process, exhaustive secondary research has been conducted using internal and external sources to obtain qualitative and quantitative information related to the virtual pipeline systems market. The process also serves the purpose of obtaining an overview and forecast of the virtual pipeline systems market size with respect to all market segments. Also, industry participants and commentators have conducted multiple primary interviews to validate the data and gain more analytical insights. The participants typically involved in the virtual pipeline systems market study include VPs, business development managers, market intelligence managers, national sales managers, and external consultants, such as valuation experts, research analysts, and key opinion leaders, specializing in the virtual pipeline systems market.
Reasons to Buy:
Save and reduce time carrying out entry-level research by identifying the growth, size, leading players and segments in the global virtual pipeline systems market
Highlights key business priorities in order to assist companies to realign their business strategies
The key findings and recommendations highlight crucial progressive industry trends in the global virtual pipeline systems market, thereby allowing players across the value chain to develop effective long-term strategies
Develop/modify business expansion plans by using substantial growth offering developed and emerging markets
Scrutinize in-depth global market trends and outlook coupled with the factors driving the market, as well as those hindering it
Enhance the decision-making process by understanding the strategies that underpin commercial interest with respect to client products, segmentation, pricing and distribution
Table Of Contents
1. Introduction
- 1.1 Study Scope
- 1.2 The Insight Partners Research Report Guidance
- 1.3 Market Segmentation
2. Key Takeaways
3. Research Methodology
- 3.1 Coverage
- 3.2 Secondary Research
- 3.3 Primary Research
4. Virtual Pipeline Systems Market Landscape
- 4.1 Market Overview
- 4.2 PEST Analysis
- 4.2.1 North America
- 4.2.2 Europe
- 4.2.3 Asia-Pacific
- 4.2.4 Middle East and Africa
- 4.2.5 South America
- 4.3 Ecosystem Analysis
- 4.4 Expert Opinions
5. Virtual Pipeline Systems Market - Key Market Dynamics
- 5.1 Market Drivers
- 5.1.1 Increasing Energy Demands Creating Need for Virtual Pipeline Systems
- 5.1.2 Rising Shale Gas Extraction Driving Demand for Virtual Pipeline System
- 5.2 Market Restraints
- 5.2.1 Significant Dominance of Conventional Pipeline Infrastructure
- 5.3 Market Opportunities
- 5.3.1 Growing Inclination towards Consumption of Natural Gas
- 5.4 Future Trends
- 5.4.1 Growing Investment in VPS Technologies
- 5.5 Impact Analysis of Drivers And Restraints
6. Virtual Pipeline Systems - Global Market Analysis
- 6.1 Global Virtual Pipeline Systems Market Overview
- 6.2 Global Virtual Pipeline Systems Market Revenue Forecast and Analysis
- 6.3 Market Positioning - Five Key Players
- 6.3.1 Market Players Anlysis
7. Virtual Pipeline Systems Market - By Type
- 7.1 Overview
- 7.2 Virtual Pipeline Systems Market, By Type (2020 and 2028)
- 7.3 Standard Trailer
- 7.3.1 Overview
- 7.3.2 Standard Trailer: Virtual Pipeline Systems Market - Revenue and Forecast to 2028 (US$ Million)
- 7.4 Towable Trailer
- 7.4.1 Overview
- 7.4.2 Towable Trailer: Virtual Pipeline Systems Market - Revenue and Forecast to 2028 (US$ Million)
8. Virtual Pipeline Systems Market - By Gas
- 8.1 Overview
- 8.2 Virtual Pipeline Systems Market, By Gas (2020 and 2028)
- 8.3 CNG
- 8.3.1 Overview
- 8.3.2 CNG: Virtual Pipeline Systems Market - Revenue and Forecast to 2028 (US$ Million)
- 8.4 Hydrogen
- 8.4.1 Overview
- 8.4.2 Hydrogen: Virtual Pipeline Systems Market - Revenue and Forecast to 2028 (US$ Million)
- 8.5 Others
- 8.5.1 Overview
- 8.5.2 Others: Virtual Pipeline Systems Market - Revenue and Forecast to 2028 (US$ Million)
9. Virtual pipeline systems Market - By Pressure Rating
- 9.1 Overview
- 9.2 Virtual Pipeline Systems Market, By Pressure Rating (2020 and 2028)
- 9.3 Less than 3000 Psi
- 9.3.1 Overview
- 9.3.2 Less than 3000 Psi: Virtual Pipeline Systems Market - Revenue and Forecast to 2028 (US$ Million)
- 9.41 Psi to 5000 Psi
- 9.4.1 Overview
- 9.4.21 Psi to 5000 Psi: Virtual Pipeline Systems Market - Revenue and Forecast to 2028 (US$ Million)
- 9.5 More than 5001 Psi
- 9.5.1 Overview
- 9.5.2 More than 5001 Psi: Virtual Pipeline Systems Market - Revenue and Forecast to 2028 (US$ Million)
10. Virtual Pipeline Systems Market - By Application
- 10.1 Overview
- 10.2 Virtual Pipeline Systems Market, By Application (2020 and 2028)
- 10.3 Industrial
- 10.3.1 Overview
- 10.3.2 Industrial: Virtual Pipeline Systems Market - Revenue and Forecast to 2028 (US$ Million)
- 10.4 Transportation
- 10.4.1 Overview
- 10.4.2 Transportation: Virtual Pipeline Systems Market - Revenue and Forecast to 2028 (US$ Million)
- 10.5 Commercial & Residential
- 10.5.1 Overview
- 10.5.2 Commercial & Residential: Virtual Pipeline Systems Market - Revenue and Forecast to 2028 (US$ Million)
11. Virtual Pipeline Systems Market - Geographic Analysis
- 11.1 Overview
- 11.2 North America: Virtual Pipeline Systems Market
- 11.2.1 North America: Virtual Pipeline Systems Market - Revenue and Forecast to 2028 (US$ Million)
- 11.2.2 North America: Virtual Pipeline Systems Market, By Type
- 11.2.3 North America: Virtual Pipeline Systems Market, By Gas
- 11.2.4 North America: Virtual Pipeline Systems Market, By Pressure Rating
- 11.2.5 North America: Virtual Pipeline Systems Market, By Application
- 11.2.6 North America: Virtual Pipeline Systems Market, By Key Country
- 11.2.6.1 US: Virtual Pipeline Systems Market - Revenue and Forecast to 2028 (US$ Million)
- 11.2.6.1.1 US: Virtual Pipeline Systems Market, By Type
- 11.2.6.1.2 US: Virtual Pipeline Systems Market, By Gas
- 11.2.6.1.3 US: Virtual Pipeline Systems Market, By Pressure Rating
- 11.2.6.1.4 US: Virtual Pipeline Systems Market, By Application
- 11.2.6.2 Canada: Virtual Pipeline Systems Market - Revenue and Forecast to 2028 (US$ Million)
- 11.2.6.2.1 Canada: Virtual Pipeline Systems Market, By Type
- 11.2.6.2.2 Canada: Virtual Pipeline Systems Market, By Gas
- 11.2.6.2.3 Canada: Virtual Pipeline Systems Market, By Pressure Rating
- 11.2.6.2.4 Canada: Virtual Pipeline Systems Market, By Application
- 11.2.6.3 Mexico: Virtual Pipeline Systems Market - Revenue and Forecast to 2028 (US$ Million)
- 11.2.6.3.1 Mexico: Virtual Pipeline Systems Market, By Type
- 11.2.6.3.2 Mexico: Virtual Pipeline Systems Market, By Gas
- 11.2.6.3.3 Mexico: Virtual Pipeline Systems Market, By Pressure Rating
- 11.2.6.3.4 Mexico: Virtual Pipeline Systems Market, By Application
- 11.2.6.1 US: Virtual Pipeline Systems Market - Revenue and Forecast to 2028 (US$ Million)
- 11.3 Europe: Virtual Pipeline Systems Market
- 11.3.1 Europe: Virtual Pipeline Systems Market - Revenue and Forecast to 2028 (US$ Million)
- 11.3.2 Europe: Virtual Pipeline Systems Market, By Type
- 11.3.3 Europe: Virtual Pipeline Systems Market, By Gas
- 11.3.4 Europe: Virtual Pipeline Systems Market, By Pressure Rating
- 11.3.5 Europe: Virtual Pipeline Systems Market, By Application
- 11.3.6 Europe: Virtual Pipeline Systems Market, By Key Country
- 11.3.6.1 Germany: Virtual Pipeline Systems Market - Revenue and Forecast to 2028 (US$ Million)
- 11.3.6.1.1 Germany: Virtual Pipeline Systems Market, By Type
- 11.3.6.1.2 Germany: Virtual Pipeline Systems Market, By Gas
- 11.3.6.1.3 Germany: Virtual Pipeline Systems Market, By Pressure Rating
- 11.3.6.1.4 Germany: Virtual Pipeline Systems Market, By Application
- 11.3.6.2 France: Virtual Pipeline Systems Market - Revenue and Forecast to 2028 (US$ Million)
- 11.3.6.2.1 France: Virtual Pipeline Systems Market, By Type
- 11.3.6.2.2 France: Virtual Pipeline Systems Market, By Gas
- 11.3.6.2.3 France: Virtual Pipeline Systems Market, By Pressure Rating
- 11.3.6.2.4 France: Virtual Pipeline Systems Market, By Application
- 11.3.6.3 Italy: Virtual Pipeline Systems Market - Revenue and Forecast to 2028 (US$ Million)
- 11.3.6.3.1 Italy: Virtual Pipeline Systems Market, By Type
- 11.3.6.3.2 Italy: Virtual Pipeline Systems Market, By Gas
- 11.3.6.3.3 Italy: Virtual Pipeline Systems Market, By Pressure Rating
- 11.3.6.3.4 Italy: Virtual Pipeline Systems Market, By Application
- 11.3.6.4 UK: Virtual Pipeline Systems Market - Revenue and Forecast to 2028 (US$ Million)
- 11.3.6.4.1 UK: Virtual Pipeline Systems Market, By Type
- 11.3.6.4.2 UK: Virtual Pipeline Systems Market, By Gas
- 11.3.6.4.3 UK: Virtual Pipeline Systems Market, By Pressure Rating
- 11.3.6.4.4 UK: Virtual Pipeline Systems Market, By Application
- 11.3.6.5 Russia: Virtual Pipeline Systems Market - Revenue and Forecast to 2028 (US$ Million)
- 11.3.6.5.1 Russia: Virtual Pipeline Systems Market, By Type
- 11.3.6.5.2 Russia: Virtual Pipeline Systems Market, By Gas
- 11.3.6.5.3 Russia: Virtual Pipeline Systems Market, By Pressure Rating
- 11.3.6.5.4 Russia: Virtual Pipeline Systems Market, By Application
- 11.3.6.6 Rest of Europe: Virtual Pipeline Systems Market - Revenue and Forecast to 2028 (US$ Million)
- 11.3.6.6.1 Rest of Europe: Virtual Pipeline Systems Market, By Type
- 11.3.6.6.2 Rest of Europe: Virtual Pipeline Systems Market, By Gas
- 11.3.6.6.3 Rest of Europe: Virtual Pipeline Systems Market, By Pressure Rating
- 11.3.6.6.4 Rest of Europe: Virtual Pipeline Systems Market, By Application
- 11.3.6.1 Germany: Virtual Pipeline Systems Market - Revenue and Forecast to 2028 (US$ Million)
- 11.4 APAC: Virtual Pipeline Systems Market
- 11.4.1 APAC: Virtual Pipeline Systems Market - Revenue and Forecast to 2028 (US$ Million)
- 11.4.2 APAC: Virtual Pipeline Systems Market, By Type
- 11.4.3 APAC: Virtual Pipeline Systems Market, By Gas
- 11.4.4 APAC: Virtual Pipeline Systems Market, By Pressure Rating
- 11.4.5 APAC: Virtual Pipeline Systems Market, By Application
- 11.4.6 APAC: Virtual Pipeline Systems Market, By Key Country
- 11.4.6.1 Australia: Virtual Pipeline Systems Market - Revenue and Forecast to 2028 (US$ Million)
- 11.4.6.1.1 Australia: Virtual Pipeline Systems Market, By Type
- 11.4.6.1.2 Australia: Virtual Pipeline Systems Market, By Gas
- 11.4.6.1.3 Australia: Virtual Pipeline Systems Market, By Pressure Rating
- 11.4.6.1.4 Australia: Virtual Pipeline Systems Market, By Application
- 11.4.6.2 China: Virtual Pipeline Systems Market - Revenue and Forecast to 2028 (US$ Million)
- 11.4.6.2.1 China: Virtual Pipeline Systems Market, By Type
- 11.4.6.2.2 China: Virtual Pipeline Systems Market, By Gas
- 11.4.6.2.3 China: Virtual Pipeline Systems Market, By Pressure Rating
- 11.4.6.2.4 China: Virtual Pipeline Systems Market, By Application
- 11.4.6.3 India: Virtual Pipeline Systems Market - Revenue and Forecast to 2028 (US$ Million)
- 11.4.6.3.1 India: Virtual Pipeline Systems Market, By Type
- 11.4.6.3.2 India: Virtual Pipeline Systems Market, By Gas
- 11.4.6.3.3 India: Virtual Pipeline Systems Market, By Pressure Rating
- 11.4.6.3.4 India: Virtual Pipeline Systems Market, By Application
- 11.4.6.4 Japan: Virtual Pipeline Systems Market - Revenue and Forecast to 2028 (US$ Million)
- 11.4.6.4.1 Japan: Virtual Pipeline Systems Market, By Type
- 11.4.6.4.2 Japan: Virtual Pipeline Systems Market, By Gas
- 11.4.6.4.3 Japan: Virtual Pipeline Systems Market, By Pressure Rating
- 11.4.6.4.4 Japan: Virtual Pipeline Systems Market, By Application
- 11.4.6.5 South Korea: Virtual Pipeline Systems Market - Revenue and Forecast to 2028 (US$ Million)
- 11.4.6.5.1 South Korea: Virtual Pipeline Systems Market, By Type
- 11.4.6.5.2 South Korea: Virtual Pipeline Systems Market, By Gas
- 11.4.6.5.3 South Korea: Virtual Pipeline Systems Market, By Pressure Rating
- 11.4.6.5.4 South Korea: Virtual Pipeline Systems Market, By Application
- 11.4.6.6 Rest of APAC: Virtual Pipeline Systems Market - Revenue and Forecast to 2028 (US$ Million)
- 11.4.6.6.1 Rest of APAC: Virtual Pipeline Systems Market, By Type
- 11.4.6.6.2 Rest of APAC: Virtual Pipeline Systems Market, By Gas
- 11.4.6.6.3 Rest of APAC: Virtual Pipeline Systems Market, By Pressure Rating
- 11.4.6.6.4 Rest of APAC: Virtual Pipeline Systems Market, By Application
- 11.4.6.1 Australia: Virtual Pipeline Systems Market - Revenue and Forecast to 2028 (US$ Million)
- 11.5 MEA: Virtual Pipeline Systems Market
- 11.5.1 MEA: Virtual Pipeline Systems Market - Revenue and Forecast to 2028 (US$ Million)
- 11.5.2 MEA: Virtual Pipeline Systems Market, By Type
- 11.5.3 MEA: Virtual Pipeline Systems Market, By Gas
- 11.5.4 MEA: Virtual Pipeline Systems Market, By Pressure Rating
- 11.5.5 MEA: Virtual Pipeline Systems Market, By Application
- 11.5.6 MEA: Virtual Pipeline Systems Market, By Key Country
- 11.5.6.1 South Africa: Virtual Pipeline Systems Market - Revenue and Forecast to 2028 (US$ Million)
- 11.5.6.1.1 South Africa: Virtual Pipeline Systems Market, By Type
- 11.5.6.1.2 South Africa: Virtual Pipeline Systems Market, By Gas
- 11.5.6.1.3 South Africa: Virtual Pipeline Systems Market, By Application
- 11.5.6.2 Saudi Arabia: Virtual Pipeline Systems Market - Revenue and Forecast to 2028 (US$ Million)
- 11.5.6.2.1 Saudi Arabia: Virtual Pipeline Systems Market, By Type
- 11.5.6.2.2 Saudi Arabia: Virtual Pipeline Systems Market, By Gas
- 11.5.6.2.3 Saudi Arabia: Virtual Pipeline Systems Market, By Pressure Rating
- 11.5.6.2.4 Saudi Arabia: Virtual Pipeline Systems Market, By Application
- 11.5.6.3 UAE: Virtual Pipeline Systems Market - Revenue and Forecast to 2028 (US$ Million)
- 11.5.6.3.1 UAE: Virtual Pipeline Systems Market, By Type
- 11.5.6.3.2 UAE: Virtual Pipeline Systems Market, By Gas
- 11.5.6.3.3 UAE: Virtual Pipeline Systems Market, By Pressure Rating
- 11.5.6.3.4 UAE: Virtual Pipeline Systems Market, By Application
- 11.5.6.4 Rest of MEA: Virtual Pipeline Systems Market - Revenue and Forecast to 2028 (US$ Million)
- 11.5.6.4.1 Rest of MEA: Virtual Pipeline Systems Market, By Type
- 11.5.6.4.2 Rest of MEA: Virtual Pipeline Systems Market, By Gas
- 11.5.6.4.3 Rest of MEA: Virtual Pipeline Systems Market, By Pressure Rating
- 11.5.6.4.4 Rest of MEA: Virtual Pipeline Systems Market, By Application
- 11.5.6.1 South Africa: Virtual Pipeline Systems Market - Revenue and Forecast to 2028 (US$ Million)
- 11.6 SAM: Virtual Pipeline Systems Market
- 11.6.1 SAM: Virtual Pipeline Systems Market - Revenue and Forecast to 2028 (US$ Million)
- 11.6.2 SAM: Virtual Pipeline Systems Market, By Type
- 11.6.3 SAM: Virtual Pipeline Systems Market, By Gas
- 11.6.4 SAM: Virtual Pipeline Systems Market, By Pressure Rating
- 11.6.5 SAM: Virtual Pipeline Systems Market, By Application
- 11.6.6 SAM: Virtual Pipeline Systems Market, By Key Country
- 11.6.6.1 Brazil: Virtual Pipeline Systems Market - Revenue and Forecast to 2028 (US$ Million)
- 11.6.6.1.1 Brazil: Virtual Pipeline Systems Market, By Type
- 11.6.6.1.2 Brazil: Virtual Pipeline Systems Market, By Gas
- 11.6.6.1.3 Brazil: Virtual Pipeline Systems Market, By Pressure Rating
- 11.6.6.1.4 Brazil: Virtual Pipeline Systems Market, By Application
- 11.6.6.2 Argentina: Virtual Pipeline Systems Market - Revenue and Forecast to 2028 (US$ Million)
- 11.6.6.2.1 Argentina: Virtual Pipeline Systems Market, By Type
- 11.6.6.2.2 Argentina: Virtual Pipeline Systems Market, By Gas
- 11.6.6.2.3 Argentina: Virtual Pipeline Systems Market, By Pressure Rating
- 11.6.6.2.4 Argentina: Virtual Pipeline Systems Market, By Application
- 11.6.6.3 Rest of SAM: Virtual Pipeline Systems Market - Revenue and Forecast to 2028 (US$ Million)
- 11.6.6.3.1 Rest of SAM: Virtual Pipeline Systems Market, By Type
- 11.6.6.3.2 Rest of SAM: Virtual Pipeline Systems Market, By Gas
- 11.6.6.3.3 Rest of SAM: Virtual Pipeline Systems Market, By Pressure Rating
- 11.6.6.3.4 Rest of SAM: Virtual Pipeline Systems Market, By Application
- 11.6.6.1 Brazil: Virtual Pipeline Systems Market - Revenue and Forecast to 2028 (US$ Million)
12. Virtual Pipeline Systems Market - Covid-19 Impact Analysis
- 12.1 Overview
- 12.2 Impact of COVID-19 Pandemic on Global Virtual pipeline systems Market
- 12.2.1 North America: Impact Assessment of COVID-19 Pandemic
- 12.2.2 Europe: Impact Assessment of COVID-19 Pandemic
- 12.2.3 Asia-Pacific: Impact Assessment of COVID-19 Pandemic
- 12.2.4 Middle East & Africa: Impact Assessment of COVID-19 Pandemic
- 12.2.5 South America: Impact Assessment of COVID-19 Pandemic
13. Industry Landscape
- 13.1 Overview
- 13.2 New Product Launch
- 13.3 Merger and Acquisition
14. Company Profiles
- 14.1 Galileo Technologies S.A.
- 14.1.1 Key Facts
- 14.1.2 Business Description
- 14.1.3 Products and Services
- 14.1.4 Financial Overview
- 14.1.5 SWOT Analysis
- 14.1.6 Key Developments
- 14.2 Bayotech, Inc.
- 14.2.1 Key Facts
- 14.2.2 Business Description
- 14.2.3 Products and Services
- 14.2.4 Financial Overview
- 14.2.5 SWOT Analysis
- 14.2.6 Key Developments
- 14.3 Petroliam Nasional Berhad (PETRONAS)
- 14.3.1 Key Facts
- 14.3.2 Business Description
- 14.3.3 Products and Services
- 14.3.4 Financial Overview
- 14.3.5 SWOT Analysis
- 14.3.6 Key Developments
- 14.4 RAG Austria AG
- 14.4.1 Key Facts
- 14.4.2 Business Description
- 14.4.3 Products and Services
- 14.4.4 Financial Overview
- 14.4.5 SWOT Analysis
- 14.4.6 Key Developments
- 14.5 Quantum Fuel Systems LLC.
- 14.5.1 Key Facts
- 14.5.2 Business Description
- 14.5.3 Products and Services
- 14.5.4 Financial Overview
- 14.5.5 SWOT Analysis
- 14.5.6 Key Developments
- 14.6 Chart Industries, Inc.
- 14.6.1 Key Facts
- 14.6.2 Business Description
- 14.6.3 Products and Services
- 14.6.4 Financial Overview
- 14.6.5 SWOT Analysis
- 14.6.6 Key Developments
- 14.7 SHIJIAZHUANG ENRIC GAS EQUIPMENT CO., LTD.
- 14.7.1 Key Facts
- 14.7.2 Business Description
- 14.7.3 Products and Services
- 14.7.4 Financial Overview
- 14.7.5 SWOT Analysis
- 14.7.6 Key Developments
- 14.8 Fiba Technologies Inc
- 14.8.1 Key Facts
- 14.8.2 Business Description
- 14.8.3 Products and Services
- 14.8.4 Financial Overview
- 14.8.5 SWOT Analysis
- 14.8.6 Key Developments
- 14.9 Hexagon Agility
- 14.9.1 Key Facts
- 14.9.2 Business Description
- 14.9.3 Products and Services
- 14.9.4 Financial Overview
- 14.9.5 SWOT Analysis
- 14.9.6 Key Developments
- 14.10 Composite Advanced Technologies, LLC.
- 14.10.1 Key Facts
- 14.10.2 Business Description
- 14.10.3 Products and Services
- 14.10.4 Financial Overview
- 14.10.5 SWOT Analysis
- 14.10.6 Key Developments
15. Appendix
- 15.1 About The Insight Partners
- 15.2 Word Index