|
|
市場調査レポート
商品コード
1126282
風力エネルギー市場の2028年までの予測-世界の分析:発電容量別(1MW未満、1~3MW、3~5MW、5MW以上)と設置場所別(陸上、海上)Wind Energy Market Forecast to 2028 - COVID-19 Impact and Global Analysis By Capacity (Upto 1MW, 1-3 MW, 3-5 MW, and Above 5MW) and Installation (Onshore and Offshore) |
||||||
|
|
|||||||


| 風力エネルギー市場の2028年までの予測-世界の分析:発電容量別(1MW未満、1~3MW、3~5MW、5MW以上)と設置場所別(陸上、海上) |
|
出版日: 2022年09月02日
発行: The Insight Partners
ページ情報: 英文 150 Pages
納期: 即納可能
|
- 全表示
- 概要
- 図表
- 目次
風力エネルギー市場は、2022年に853億7522万米ドル、2028年には1365億4405万米ドルとなり、2022年から2028年までCAGR8.1%で成長すると予測されています。
アジア太平洋地域における風力エネルギー市場の成長は、再生可能エネルギー産業への投資の増加、工業化の急激な進展、風力エネルギー発電能力、新規電化プロジェクト、送電網強化の取り組みが主な要因となっています。Wood Mackenzieによると、中国は2021年から2030年にかけて93GWの洋上風力発電容量を新たに追加する可能性があるとされています。洋上風力発電に対する高い国内需要が、2030年までに中国本土を世界最大の市場に変えるため、APACの風力エネルギー分野は急速な成長を記録し、今後数年間で再生可能エネルギーの電力容量構成の約4分の1を占めると予想されています。また、ウッドマッケンジーによれば、台湾、日本、韓国、ベトナム、インドは、2021年から2030年までに合計29GWの新規風力発電容量を追加し、世界最大の洋上風力エネルギー市場の上位にランクインする見込みです。さらに、APACでは2021年から2030年にかけて122GWの新規風力発電容量が追加され、同期間に予測される欧州と米国の新規発電容量を上回ると予想されます。
浮体式風力発電技術は、洋上風力発電機を浮体に搭載することで、水深の深い場所でも発電できるようにしたものです。浮体式風力発電は、厳しい環境条件下でも高い発電効率を発揮するため、大量の電力を生み出すことができます。この技術は、中国、ドイツ、日本、英国、フランス、ベルギー、デンマークなどの国々で世界的に採用されています。浮体式風力発電技術の採用が拡大しているのは、主に技術の進歩や、さまざまなサービスプロバイダーが提供するターンキーソリューションが要因です。さまざまな国によるクリーンエネルギー目標達成への意識の高まりが、浮体式洋上風力発電の需要を後押ししており、風力エネルギー市場の成長に潜在的な機会を提供しています。
浮体式洋上風力発電センターオブエクセレンスのレポートでは、新生の再生可能エネルギー技術の主要プレーヤーになる準備が最も整っている22カ国を特定しています。2022年1月、英国政府は11の再生可能エネルギープロジェクトの成功例を発表し、それぞれ投資額として最大9億5923万米ドル、英国で発生する再生可能エネルギーを後押しするために29億7000万米ドルを授与する予定であることを明らかにしました。また、2022年4月には、テクニップエナジーズが、韓国東海岸に位置する洋上浮体式風力発電「ファイアフライ」プロジェクトのFEED(フロントエンドエンジニアリング設計)に、エクイノールから選定されています。
新興経済諸国では、電力消費量の増加が最も顕著な傾向となっています。電力需要の急増は、主に人口の増加、工業化の成長見通し、都市化の大幅な増加に起因しています。2021年の世界の電力需要は人口増加により増加し、エネルギー価格を前例のない水準に押し上げ、電力部門の排出量を過去最高水準に押し上げました。電力消費の増加により、排出量を最低限に抑えてより多くの電力を利用する必要性が高まっており、発電需要が加速しています。2020年に小幅に減少した後、2021年の世界の電力需要は~6%増加しました。
電力市場は、2021年に電力需要の強い伸び、再生可能エネルギーの不利な条件、ガス価格の上昇を示しました。IEAが発表した「電力市場レポート」によると、2021年の火力発電総量は~6%(980TWh)増加しました。中国とインドの電力消費量の増加(ともに~10%増)により、発電需要は2020年の最低値2%から2021年には8%に増加しました。発電ミックスの多様化にもかかわらず、中国の電力システムは依然として石炭が大部分を占めています。2021年には、石炭が発電量の64%を占め、次いで水力が16%、風力が7%、原子力が5%となります。したがって、石炭火力発電所による電力需要の増加は、継続的な需要に対応するために電力生産者に圧力をかけており、排出物を出すことで環境に支障をきたしているのです。
風力エネルギー市場の調査においてプロファイルされている主要企業は、Alpha ESS Co., Ltd.;BYD Motors Inc.;HagerEnergy GmbH;ENERSYS;Kokam;Leclanche SA;LG Electronics;SimpliPhi Power;sonnen GmbH;and SAMSUNG SDI CO., LTD.です。風力エネルギー市場のレポートは、市場の詳細な洞察を提供し、主要企業が今後数年間の成長を戦略化するのに役立ちます。
進行中の風力発電所への投資の増加は、風力エネルギーの発電能力を増強しており、風力エネルギー市場の成長を支えています。例えば、2021年第3四半期に開始されたAPACにおける最大の風力エネルギー建設プロジェクトは、3億2800万米ドル相当の投資で180MWの風力発電所の建設を含むDulacca Wind Farmで、2023年第3四半期までに終了する予定です。したがって、このような要因は、予測期間にわたって風力エネルギー市場の成長を後押しすると予想されます。
風力エネルギー市場は、容量と設置に二分されます。容量に基づいて、風力エネルギー市場は1MWまで、1~3MW、3~5MW、5MW以上に区分されます。設置量に基づき、風力エネルギー市場は陸上と沖合に二分されます。
風力エネルギー市場は、北米、欧州、アジア太平洋(APAC)、中東・アフリカ(MEA)、南米(SAM)の5つの主要地域に区分されます。2021年には、APACが最大のシェアを獲得して風力エネルギー市場をリードし、北米がこれに続く。さらに、欧州は2022年から2028年にかけて、風力エネルギー市場で最高のCAGRを記録すると予測されています。
目次
第1章 イントロダクション
- 調査範囲
- インサイトパートナーズの調査報告書ガイダンス
- 市場セグメンテーション
第2章 重要なポイント
第3章 調査手法
- 対象範囲
- 2次調査
- 1次調査
第4章 風力エネルギー市場の情勢
- 市場概要
- PEST分析
- 北米
- 欧州
- APAC
- MEA
- SAM
- エコシステム分析
- 専門家の見解
第5章 風力エネルギー市場- 主な市場力学
- 市場促進要因
- 再生可能エネルギー源への投資の増加
- 風力タービンファームの設置を促進する政府の取り組み
- 市場抑制要因
- 高い資本コストが市場の成長を抑制要因
- 市場機会
- 浮体式風力発電技術への注目の高まり別潜在的な成長機会
- 今後の動向
- 電力消費の増加とカーボンフットプリントを最小限に抑えるための重要な努力
- 推進要因と抑制要因の影響分析
第6章 風力エネルギー市場- 世界分析
- 風力エネルギー市場の概要
- 市場のポジショニング-主要5社
第7章 風力エネルギー市場の分析-設置場所別
- 風力エネルギーの市場内訳(設置場所別)(2020年、2028年
- オンショア
- オフショア
第8章 風力エネルギーの市場分析- タイプ別
- 風力エネルギーの市場内訳(タイプ別):2020年、2028年
- 1MWまで
- 1~3MW
- 3~5MW
- 5MW以上
第9章 風力エネルギー市場-地域別分析
- 北米
- 米国
- カナダ
- メキシコ
- 欧州
- ドイツ
- フランス
- イタリア
- 英国
- ロシア
- その他欧州
- APAC
- オーストラリア
- 中国
- インド
- 日本
- 韓国
- APACのその他諸国
- MEA
- サウジアラビア
- UAE
- 南アフリカ
- MEAの残りの地域
- 南米
- ブラジル
- アルゼンチン
- その他の南米地域
第10章 風力エネルギー市場-COVID-19影響度分析
- 北米
- 欧州
- APAC
- MEA
- SAM
第11章 風力エネルギー市場- 業界情勢
- 市場への取り組み
- 新製品開発
- 合併・買収
第12章 企業プロファイル
- Vestas Wind Systems
- Goldwind
- Siemens Gamesa
- Envision
- GE Renewable Energy
- Mingyang Smart Energy
- NORDEX SE
- Shanghai Electric
- China Shipbuilding Group Haizhuang Wind Power Co., Ltd.
- Zhejiang Windey Co., Ltd.
第13章 付録
- インサイト・パートナーズについて
- 単語索引
List Of Tables
- Table 1. Wind Energy Market - Revenue and Forecast to 2028 (US$ Million)
- Table 2. North America Wind Energy Market, Revenue and Forecast To 2028 - By installation (US$ million)
- Table 3. North America Wind Energy Market, Revenue and Forecast To 2028 - By Type (US$ million)
- Table 4. North America Wind Energy Market Breakdown, by Country
- Table 5. North America Wind Energy Market, Revenue and Forecast To 2028 - By Country (US$ million)
- Table 6. US Wind Energy Market, Revenue and Forecast to 2028 - By installation (US$ million)
- Table 7. US Wind Energy Market, Revenue and Forecast to 2028 - By Type (US$ million)
- Table 8. Canada Wind Energy Market, Revenue and Forecast to 2028 - By installation (US$ million)
- Table 9. Canada Wind Energy Market, Revenue and Forecast to 2028 - By Type (US$ million)
- Table 10. Mexico Wind Energy Market, Revenue and Forecast to 2028 - By installation (US$ million)
- Table 11. Mexico Wind Energy Market, Revenue and Forecast to 2028 - By Type (US$ million)
- Table 12. Europe Wind Energy Market, Revenue and Forecast To 2028 - By installation (US$ million)
- Table 13. Europe Wind Energy Market, Revenue and Forecast To 2028 - By Type (US$ million)
- Table 14. Europe Wind Energy Market, Revenue and Forecast To 2028 - By Country (US$ million)
- Table 15. Germany Wind Energy Market, Revenue and Forecast to 2028 - By installation (US$ million)
- Table 16. Germany Wind Energy Market, Revenue and Forecast to 2028 - By Type (US$ million)
- Table 17. France Wind Energy Market, Revenue and Forecast to 2028 - By installation (US$ million)
- Table 18. France Wind Energy Market, Revenue and Forecast to 2028 - By Type (US$ million)
- Table 19. Italy Wind Energy Market, Revenue and Forecast to 2028 - By installation (US$ million)
- Table 20. Italy Wind Energy Market, Revenue and Forecast to 2028 - By Type (US$ million)
- Table 21. UK Wind Energy Market, Revenue and Forecast to 2028 - By installation (US$ million)
- Table 22. UK Wind Energy Market, Revenue and Forecast to 2028 - By Type (US$ million)
- Table 23. Russia Wind Energy Market, Revenue and Forecast to 2028 - By installation (US$ million)
- Table 24. Russia Wind Energy Market, Revenue and Forecast to 2028 - By Type (US$ million)
- Table 25. Rest of Europe Wind Energy Market, Revenue and Forecast to 2028 - By installation (US$ million)
- Table 26. Rest of Europe Wind Energy Market, Revenue and Forecast to 2028 - By Type (US$ million)
- Table 27. APAC Wind Energy Market, Revenue and Forecast To 2028 - By installation (US$ million)
- Table 28. APAC Wind Energy Market, Revenue and Forecast To 2028 - By Type (US$ million)
- Table 29. APAC Wind Energy Market, Revenue and Forecast To 2028 - By Country (US$ million)
- Table 30. Australia Wind Energy Market, Revenue and Forecast to 2028 - By installation (US$ million)
- Table 31. Australia Wind Energy Market, Revenue and Forecast to 2028 - By Type (US$ million)
- Table 32. China Wind Energy Market, Revenue and Forecast to 2028 - By installation (US$ million)
- Table 33. China Wind Energy Market, Revenue and Forecast to 2028 - By Type (US$ million)
- Table 34. India Wind Energy Market, Revenue and Forecast to 2028 - By installation (US$ million)
- Table 35. India Wind Energy Market, Revenue and Forecast to 2028 - By Type (US$ million)
- Table 36. Japan Wind Energy Market, Revenue and Forecast to 2028 - By installation (US$ million)
- Table 37. Japan Wind Energy Market, Revenue and Forecast to 2028 - By Type (US$ million)
- Table 38. South Korea Wind Energy Market, Revenue and Forecast to 2028 - By installation (US$ million)
- Table 39. South Korea Wind Energy Market, Revenue and Forecast to 2028 - By Type (US$ million)
- Table 40. Rest of APAC Wind Energy Market, Revenue and Forecast to 2028 - By installation (US$ million)
- Table 41. Rest of APAC Wind Energy Market, Revenue and Forecast to 2028 - By Type (US$ million)
- Table 42. MEA Wind Energy Market, Revenue and Forecast To 2028 - By installation (US$ million)
- Table 43. MEA Wind Energy Market, Revenue and Forecast To 2028 - By Type (US$ million)
- Table 44. MEA Wind Energy Market, Revenue and Forecast to 2028 - By Country (US$ million)
- Table 45. Saudi Arabia Wind Energy Market, Revenue and Forecast to 2028 - By installation (US$ million)
- Table 46. Saudi Arabia Wind Energy Market, Revenue and Forecast to 2028 - By Type (US$ million)
- Table 47. UAE Wind Energy Market, Revenue and Forecast to 2028 - By installation (US$ million)
- Table 48. UAE Wind Energy Market, Revenue and Forecast to 2028 - By Type (US$ million)
- Table 49. South Africa Wind Energy Market, Revenue and Forecast to 2028 - By installation (US$ million)
- Table 50. South Africa Wind Energy Market, Revenue and Forecast to 2028 - By Type (US$ million)
- Table 51. Rest of MEA Wind Energy Market, Revenue and Forecast to 2028 - By installation (US$ million)
- Table 52. Rest of MEA Wind Energy Market, Revenue and Forecast to 2028 - By Type (US$ million)
- Table 53. SAM Wind Energy Market, Revenue and Forecast To 2028 - By installation (US$ million)
- Table 54. SAM Wind Energy Market, Revenue and Forecast To 2028 - By Type (US$ million)
- Table 55. SAM Wind Energy Market, Revenue and Forecast To 2028 - By Country (US$ million)
- Table 56. Brazil Wind Energy Market, Revenue and Forecast to 2028 - By installation (US$ million)
- Table 57. Brazil Wind Energy Market, Revenue and Forecast to 2028 - By Type (US$ million)
- Table 58. Argentina Wind Energy Market, Revenue and Forecast to 2028 - By installation (US$ million)
- Table 59. Argentina Wind Energy Market, Revenue and Forecast to 2028 - By Type (US$ million)
- Table 60. Rest of SAM Wind Energy Market, Revenue and Forecast to 2028 - By installation (US$ million)
- Table 61. Rest of SAM Wind Energy Market, Revenue and Forecast to 2028 - By Type (US$ million)
- Table 62. List of Abbreviation
List Of Figures
- Figure 1. Wind Energy Market Segmentation
- Figure 2. Wind Energy Market Segmentation - By Geography
- Figure 3. Global Wind Energy Market Overview
- Figure 4. Onshore Installation Held the Largest Market Share in 2020
- Figure 5. Upto 1MW Held the Highest CAGR
- Figure 6. APAC was the Largest Revenue Contributor in 2020
- Figure 7. North America- PEST Analysis
- Figure 8. Europe - PEST Analysis
- Figure 9. APAC - PEST Analysis
- Figure 10. MEA - PEST Analysis
- Figure 11. SAM - PEST Analysis
- Figure 12. Wind Energy Market- Ecosystem Analysis
- Figure 13. Expert Opinion
- Figure 14. Wind Energy Market: Impact Analysis of Drivers and Restraints
- Figure 15. Geographic Overview of Wind Energy Market
- Figure 16. Global Wind Energy Market - Revenue and Forecast to 2028 (US$ Million)
- Figure 17. Wind Energy Market Revenue Share, By installation (2020 and 2028)
- Figure 18. Onshore: Wind Energy Market Revenue and Forecast to 2028 (US$ Million)
- Figure 19. Offshore: Wind Energy Market Revenue and Forecast to 2028 (US$ Million)
- Figure 20. Wind Energy Market Revenue Share, By Type (2020 and 2028)
- Figure 21. Upto 1MW: Wind Energy Market Revenue and Forecast to 2028 (US$ Million)
- Figure 22. 1-3 MW: Wind Energy Market Revenue and Forecast to 2028 (US$ Million)
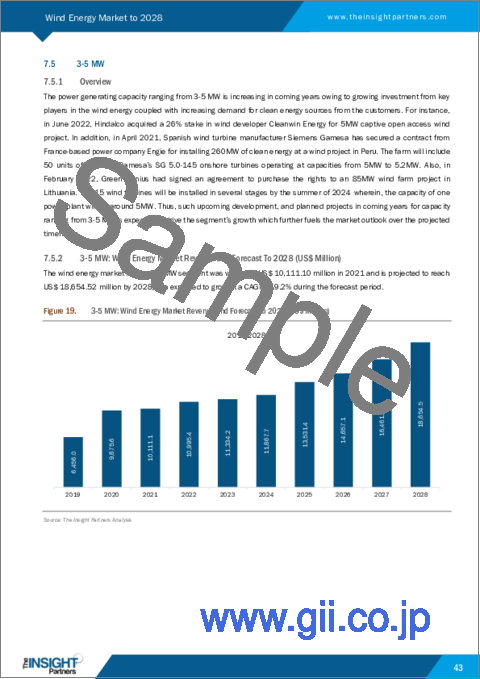
- Figure 23. 3-5 MW: Wind Energy Market Revenue and Forecast to 2028 (US$ Million)
- Figure 24. Above 5MW: Wind Energy Market Revenue and Forecast to 2028 (US$ Million)
- Figure 25. Global Wind Energy Market Breakdown, by Region, 2020 & 2028 (%)
- Figure 26. North America Wind Energy Market, Revenue and Forecast to 2028 (US$ million)
- Figure 27. North America Wind Energy Market Breakdown, By installation, 2020 & 2028 (%)
- Figure 28. North America Wind Energy Market Breakdown, By Type, 2020 & 2028 (%)
- Figure 29. North America Wind Energy Market Breakdown, by Country, 2020 & 2028 (%)
- Figure 30. US Wind Energy Market, Revenue and Forecast to 2028 (US$ million)
- Figure 31. Canada Wind Energy Market, Revenue and Forecast to 2028 (US$ million)
- Figure 32. Mexico Wind Energy Market, Revenue and Forecast to 2028 (US$ million)
- Figure 33. Europe Wind Energy Market, Revenue and Forecast To 2028 (US$ million)
- Figure 34. Europe Wind Energy Market Breakdown, By installation, 2020 & 2028 (%)
- Figure 35. Europe Wind Energy Market Breakdown, By Type, 2020 & 2028 (%)
- Figure 36. Europe Wind Energy Market Breakdown, by Country, 2018 & 2027(%)
- Figure 37. Germany Wind Energy Market, Revenue and Forecast to 2028 (US$ million)
- Figure 38. France Wind Energy Market, Revenue and Forecast to 2028 (US$ million)
- Figure 39. Italy Wind Energy Market, Revenue and Forecast to 2028 (US$ million)
- Figure 40. UK Wind Energy Market, Revenue and Forecast to 2028 (US$ million)
- Figure 41. Russia Wind Energy Market, Revenue and Forecast to 2028 (US$ million)
- Figure 42. Rest of Europe Wind Energy Market, Revenue and Forecast to 2028 (US$ million)
- Figure 43. APAC Wind Energy Market, Revenue and Forecast To 2028 (US$ million)
- Figure 44. APAC Wind Energy Market Breakdown, By installation, 2020 & 2028 (%)
- Figure 45. APAC Wind Energy Market Breakdown, By Type, 2020 & 2028 (%)
- Figure 46. APAC Wind Energy Market Breakdown, by Country, 2020 & 2028 (%)
- Figure 47. Australia Wind Energy Market, Revenue and Forecast To 2028 (US$ million)
- Figure 48. China Wind Energy Market, Revenue and Forecast To 2028 (US$ million)
- Figure 49. India Wind Energy Market, Revenue and Forecast To 2028 (US$ million)
- Figure 50. Japan Wind Energy Market, Revenue and Forecast To 2028 (US$ million)
- Figure 51. South Korea Wind Energy Market, Revenue and Forecast To 2028 (US$ million)
- Figure 52. Rest of APAC Wind Energy Market, Revenue and Forecast To 2028 (US$ million)
- Figure 53. MEA Wind Energy Market, Revenue and Forecast to 2028 (US$ million)
- Figure 54. MEA Wind Energy Market Breakdown, By installation, 2020 & 2028 (%)
- Figure 55. MEA Wind Energy Market Breakdown, By Type, 2020 & 2028 (%)
- Figure 56. MEA Wind Energy Market Breakdown, By Country, 2020 & 2028 (%)
- Figure 57. Saudi Arabia Wind Energy Market, Revenue and Forecast To 2028 (US$ million)
- Figure 58. UAE Wind Energy Market, Revenue and Forecast To 2028 (US$ million)
- Figure 59. South Africa Wind Energy Market, Revenue and Forecast To 2028 (US$ million)
- Figure 60. Rest of MEA Wind Energy Market, Revenue and Forecast To 2028 (US$ million)
- Figure 61. SAM Wind Energy Market, Revenue and Forecast to 2028 (US$ million)
- Figure 62. SAM Wind Energy Market Breakdown, By installation, 2020 & 2028 (%)
- Figure 63. SAM Wind Energy Market Breakdown, By Type, 2020 & 2028 (%)
- Figure 64. SAM Wind Energy Market Breakdown, by Country, 2020 & 2028 (%)
- Figure 65. Brazil Wind Energy Market, Revenue and Forecast to 2028 (US$ million)
- Figure 66. Argentina Wind Energy Market, Revenue and Forecast to 2028 (US$ million)
- Figure 67. Rest of SAM Wind Energy Market, Revenue and Forecast to 2028 (US$ million)
- Figure 68. Impact of COVID-19 Pandemic in North American Countries
- Figure 69. Impact of COVID-19 Pandemic in European Countries
- Figure 70. Impact of COVID-19 Pandemic in APAC Countries
- Figure 71. Impact of COVID-19 Pandemic in MEA Countries
- Figure 72. Impact of COVID-19 Pandemic in SAM Countries
The wind energy market was valued at US$ 85,375.22 million in 2022 to US$ 1,36,544.05 million by 2028; it is anticipated to grow at a CAGR of 8.1% from 2022 to 2028.
The growth of the wind energy market in Asia Pacific is primarily attributed to increasing investment in the renewable industry, exponential increase in industrialization, wind energy generation capacity, new electrification projects, and grid strengthening initiatives. As per Wood Mackenzie, China could add 93 GW of new offshore wind power capacity from 2021 to 2030. The wind energy sector in APAC is expected to register rapid growth and could make up approximately a quarter of the power capacity mix in the renewable energy in coming years, as high domestic demand for offshore wind power will turn mainland China into the world's largest market by 2030. Also, as per Wood Mackenzie, Taiwan, Japan, South Korea, Vietnam, and India will rank among the world's twenty largest offshore wind markets, adding a combined 29GW of new wind capacity from 2021 to 2030. Further, APAC will add 122 GW of new wind capacity from 2021 to 2030, surpassing the projected new capacity across Europe and the US in the same period.
The floating wind technology is the offshore wind turbine mounted on a floating structure that allows the turbine to generate electricity in water depths. The floating wind technology is highly efficient in harsh environmental conditions and thus capable of producing a huge amount of power. This technology is globally adopted across countries such as China, Germany, Japan, the UK, France, Belgium, and Denmark. The growth prospects in adopting floating wind technology are primarily attributed to increased technological advancements, and turnkey solutions provided by various service providers. The growing awareness for achieving the clean energy targets by various countries is propelling the demand for floating offshore wind power, which offers a potential opportunity for the growth of the wind energy market.
The Floating Offshore Wind Centre of Excellence report has identified 22 countries that are most ready to become major players in the nascent renewable energy technology. In January 2022, the UK government announced 11 successful renewable energy projects that will each be awarded up to US$ 959.23 million as investment and US$ 2.97 billion to boost the renewable energy generated in the UK. In addition, in April 2022, Technip Energies was selected by Equinor to perform a front-end engineering design (FEED) for the offshore floating wind Firefly project, which is located on the East Coast of South Korea.
The increase in power consumption is the most prominent trend in developing economies. The surge in power demand is primarily attributed to an increase in population, growth prospects in industrialization, and a significant increase in urbanization. The global electricity demand increased in 2021 owing to a increasing population, pushing the energy prices to unprecedented levels and driving the power sector's emissions to a record high level. The growing consumption of power is increasing the need to harness more power by keeping the emissions level at its minimum, which is accelerating the demand for generating power. After a small drop in 2020, global electricity demand grew by ~6% in 2021.
The electricity markets witnessed strong growth in electricity demand, unfavorable renewable conditions, and increasing gas prices in 2021. As per the Electricity Market Report published by IEA, total thermal electricity generation increased by ~6% (980 TWh) in 2021. The demand for electricity generation increased from a low of 2% in 2020 to 8% in 2021 due to rising electricity consumption of China and India (both up ~10%). Despite a diversifying generation mix, China's electricity system remains largely coal-dominated. In 2021, coal accounted for 64% of power generation, followed by hydropower with a share of 16%, wind at 7%, and nuclear at 5%. Thus, increasing electricity demand from coal-fired plants has put pressure on the power producer to cater to the ongoing demand, which is hampering the environment by producing emissions.
The key players profiled in the wind energy market study are Alpha ESS Co., Ltd.; BYD Motors Inc.; HagerEnergy GmbH; ENERSYS; Kokam; Leclanche SA; LG Electronics; SimpliPhi Power; sonnen GmbH; and SAMSUNG SDI CO., LTD. The wind energy market report provides detailed market insights, which help the key players to strategize the growth in the coming years.
The increasing investment in ongoing wind farms is augmenting the wind energy generation capacity, which is supporting the wind energy market growth. For instance, the largest wind energy construction projects in APAC that were initiated in the third quarter of 2021 were Dulacca Wind Farm which involves the construction of a 180MW wind farm with an investment worth US$ 328 million and is expected to finish by Q3 2023. Thus, such factors are expected to boost the wind energy market growth over the forecast period.
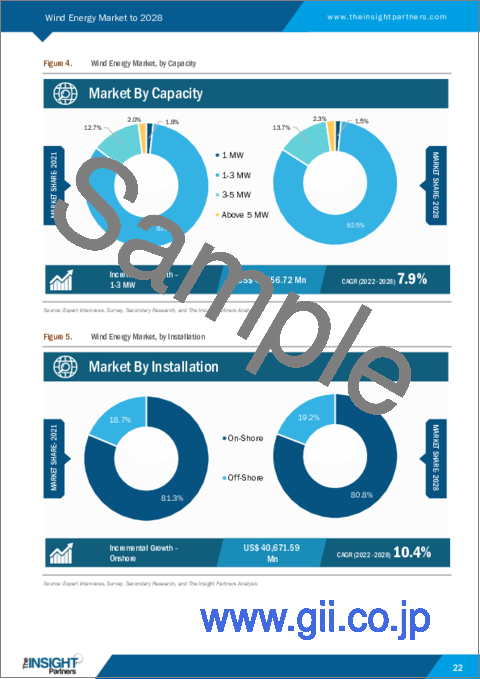
The wind energy market is bifurcated into capacity and installation. Based on capacity, the wind energy market is segmented into upto 1MW, 1-3 MW, 3-5 MW, and above 5MW. Based on installation, the wind energy market is bifurcated into onshore and offshore.
The wind energy market is segmented into five major regions-North America, Europe, Asia Pacific (APAC), the Middle East & Africa (MEA), and South America (SAM). In 2021, APAC led the wind energy market with the largest share, followed by North America. Further, Europe is expected to register the highest CAGR in the wind energy market from 2022 to 2028.
Reasons to Buy:
- Save and reduce time carrying out entry-level research by identifying the growth, size, leading players, and segments in the wind energy market
- Highlights key business priorities in order to assist companies to realign their business strategies
- The key findings and recommendations highlight crucial progressive industry trends in the wind energy market thereby allowing players across the value chain to develop effective long-term strategies
- Develop/modify business expansion plans by using substantial growth offering developed and emerging markets
- Scrutinize in-depth global market trends and outlook coupled with the factors driving the market, as well as those hindering it
- Enhance the decision-making process by understanding the strategies that underpin commercial interest with respect to client products, segmentation, pricing, and distribution
Table Of Contents
1. Introduction
- 1.1 Study Scope
- 1.2 The Insight Partners Research Report Guidance
- 1.3 Market Segmentation
2. Key Takeaways
3. Research Methodology
- 3.1 Coverage
- 3.2 Secondary Research
- 3.3 Primary Research
4. Wind Energy Market Landscape
- 4.1 Market Overview
- 4.2 PEST Analysis
- 4.2.1 North America
- 4.2.2 Europe
- 4.2.3 APAC
- 4.2.4 MEA
- 4.2.5 SAM
- 4.3 Ecosystem Analysis
- 4.4 Expert Opinion
5. Wind Energy Market - Key Market Dynamics
- 5.1 Market Drivers
- 5.1.1 Increasing Investments in Renewable Energy Sources
- 5.1.2 Government initiatives to promote Installation of Wind Turbine Farms
- 5.2 Market Restraints
- 5.2.1 High capital cost restraints the growth of the market
- 5.3 Market Opportunities
- 5.3.1 The growing focus on floating wind technology holds potential growth opportunity
- 5.4 Future Trends
- 5.4.1 Growing power consumption coupled with significant efforts to minimize carbon footprint
- 5.5 Impact Analysis of Drivers and Restraints
6. Wind Energy Market - Global Analysis
- 6.1 Wind Energy Market Global Overview
- 6.2 Wind Energy Market - Global Revenue and Forecast to 2028 (US$ Million)
- 6.3 Market Positioning - Five Key Players
7. Wind Energy Market Analysis - By installation
- 7.1 Overview
- 7.2 Wind Energy Market Breakdown, By installation, 2020 and 2028
- 7.3 Onshore
- 7.3.1 Overview
- 7.3.2 Onshore: Wind Energy Market Revenue and Forecast to 2028 (US$ Million)
- 7.4 Offshore
- 7.4.1 Overview
- 7.4.2 Offshore: Wind Energy Market Revenue and Forecast to 2028 (US$ Million)
8. Wind Energy Market Analysis - By Type
- 8.1 Overview
- 8.2 Wind Energy Market Breakdown, By Type, 2020 and 2028
- 8.3 Upto 1MW
- 8.3.1 Overview
- 8.3.2 Upto 1MW: Wind Energy Market Revenue and Forecast to 2028 (US$ Million)
- 8.4 1-3 MW
- 8.4.1 Overview
- 8.4.2 1-3 MW: Wind Energy Market Revenue and Forecast to 2028 (US$ Million)
- 8.5 3-5 MW
- 8.5.1 Overview
- 8.5.2 3-5 MW: Wind Energy Market Revenue and Forecast to 2028 (US$ Million)
- 8.6 Above 5MW
- 8.6.1 Overview
- 8.6.2 Above 5MW: Wind Energy Market Revenue and Forecast to 2028 (US$ Million)
9. Wind Energy Market - Geographic Analysis
- 9.1 Overview
- 9.2 North America: Wind Energy Market
- 9.2.1 Overview
- 9.2.2 North America Wind Energy Market, Revenue and Forecast to 2028 (US$ million)
- 9.2.3 North America Wind Energy Market Breakdown, By installation
- 9.2.4 North America Wind Energy Market Breakdown, By Type
- 9.2.4.1 US Wind Energy Market, Revenue and Forecast to 2028
- 9.2.4.1.1 US Wind Energy Market Breakdown, By installation
- 9.2.4.1.2 US Wind Energy Market Breakdown, By Type
- 9.2.4.2 Canada Wind Energy Market, Revenue and Forecast to 2028
- 9.2.4.2.1 Canada Wind Energy Market Breakdown, By installation
- 9.2.4.2.2 Canada Wind Energy Market Breakdown, By Type
- 9.2.4.3 Mexico Wind Energy Market, Revenue and Forecast to 2028
- 9.2.4.3.1 Mexico Wind Energy Market Breakdown, By installation
- 9.2.4.3.2 Mexico Wind Energy Market Breakdown, By Type
- 9.2.4.1 US Wind Energy Market, Revenue and Forecast to 2028
- 9.3 Europe: Wind Energy Market
- 9.3.1 Overview
- 9.3.2 Europe Wind Energy Market Revenue and Forecast to 2028 (US$ million)
- 9.3.3 Europe Wind Energy Market Breakdown, By installation
- 9.3.4 Europe Wind Energy Market Breakdown, By Type
- 9.3.5 Europe Wind Energy Market Breakdown, by Country
- 9.3.5.1 Germany Wind Energy Market, Revenue and Forecast to 2028
- 9.3.5.1.1 Germany Wind Energy Market Breakdown, By installation
- 9.3.5.1.2 Germany Wind Energy Market Breakdown, By Type
- 9.3.5.2 France Wind Energy Market, Revenue and Forecast to 2028
- 9.3.5.2.1 France Wind Energy Market Breakdown, By installation
- 9.3.5.2.2 France Wind Energy Market Breakdown, By Type
- 9.3.5.3 Italy Wind Energy Market, Revenue and Forecast to 2028
- 9.3.5.3.1 Italy Wind Energy Market Breakdown, By installation
- 9.3.5.3.2 Italy Wind Energy Market Breakdown, By Type
- 9.3.5.4 UK Wind Energy Market, Revenue and Forecast to 2028
- 9.3.5.4.1 UK Wind Energy Market Breakdown, By installation
- 9.3.5.4.2 UK Wind Energy Market Breakdown, By Type
- 9.3.5.5 Russia Wind Energy Market, Revenue and Forecast to 2028
- 9.3.5.5.1 Russia Wind Energy Market Breakdown, By installation
- 9.3.5.5.2 Russia Wind Energy Market Breakdown, By Type
- 9.3.5.6 Rest of Europe Wind Energy Market, Revenue and Forecast to 2028
- 9.3.5.6.1 Rest of Europe Wind Energy Market Breakdown, By installation
- 9.3.5.6.2 Rest of Europe Wind Energy Market Breakdown, By Type
- 9.3.5.1 Germany Wind Energy Market, Revenue and Forecast to 2028
- 9.4 APAC: Wind Energy Market
- 9.4.1 Overview
- 9.4.2 APAC Wind Energy Market, Revenue and Forecast to 2028 (US$ million)
- 9.4.3 APAC Wind Energy Market Breakdown, By installation
- 9.4.4 APAC Wind Energy Market Breakdown, By Type
- 9.4.5 APAC Wind Energy Market Breakdown, by Country
- 9.4.5.1 Australia Wind Energy Market, Revenue and Forecast to 2028 (US$ million)
- 9.4.5.1.1 Australia Wind Energy Market Breakdown, By installation
- 9.4.5.1.2 Australia Wind Energy Market Breakdown, By Type
- 9.4.5.2 China Wind Energy Market, Revenue and Forecast to 2028 (US$ million)
- 9.4.5.2.1 China Wind Energy Market Breakdown, By installation
- 9.4.5.2.2 China Wind Energy Market Breakdown, By Type
- 9.4.5.3 India Wind Energy Market, Revenue and Forecast to 2028 (US$ million)
- 9.4.5.3.1 India Wind Energy Market Breakdown, By installation
- 9.4.5.3.2 India Wind Energy Market Breakdown, By Type
- 9.4.5.4 Japan Wind Energy Market, Revenue and Forecast to 2028 (US$ million)
- 9.4.5.4.1 Japan Wind Energy Market Breakdown, By installation
- 9.4.5.4.2 Japan Wind Energy Market Breakdown, By Type
- 9.4.5.5 South Korea Wind Energy Market, Revenue and Forecast to 2028 (US$ million)
- 9.4.5.5.1 South Korea Wind Energy Market Breakdown, By installation
- 9.4.5.5.2 South Korea Wind Energy Market Breakdown, By Type
- 9.4.5.6 Rest of APAC Wind Energy Market, Revenue and Forecast to 2028 (US$ million)
- 9.4.5.6.1 Rest of APAC Wind Energy Market Breakdown, By installation
- 9.4.5.6.2 Rest of APAC Wind Energy Market Breakdown, By Type
- 9.4.5.1 Australia Wind Energy Market, Revenue and Forecast to 2028 (US$ million)
- 9.5 MEA: Wind Energy Market
- 9.5.1 Overview
- 9.5.2 MEA Wind Energy Market, Revenue and Forecast to 2028 (US$ million)
- 9.5.3 MEA Wind Energy Market Breakdown, By installation
- 9.5.4 MEA Wind Energy Market Breakdown, By Type
- 9.5.5 MEA Wind Energy Market Breakdown, By Country
- 9.5.5.1 Saudi Arabia Wind Energy Market, Revenue and Forecast to 2028 (US$ million)
- 9.5.5.1.1 Saudi Arabia Wind Energy Market Breakdown, By installation
- 9.5.5.1.2 Saudi Arabia Wind Energy Market Breakdown, By Type
- 9.5.5.2 UAE Wind Energy Market, Revenue and Forecast to 2028 (US$ million)
- 9.5.5.2.1 UAE Wind Energy Market Breakdown, By installation
- 9.5.5.2.2 UAE Wind Energy Market Breakdown, By Type
- 9.5.5.3 South Africa Wind Energy Market, Revenue and Forecast to 2028 (US$ million)
- 9.5.5.3.1 South Africa Wind Energy Market Breakdown, By installation
- 9.5.5.3.2 South Africa Wind Energy Market Breakdown, By Type
- 9.5.5.4 Rest of MEA Wind Energy Market, Revenue and Forecast to 2028 (US$ million)
- 9.5.5.4.1 Rest of MEA Wind Energy Market Breakdown, By installation
- 9.5.5.4.2 Rest of MEA Wind Energy Market Breakdown, By Type
- 9.5.5.1 Saudi Arabia Wind Energy Market, Revenue and Forecast to 2028 (US$ million)
- 9.6 SAM: Wind Energy Market
- 9.6.1 Overview
- 9.6.2 SAM Wind Energy Market, Revenue and Forecast to 2028 (US$ million)
- 9.6.3 SAM Wind Energy Market Breakdown, By installation
- 9.6.4 SAM Wind Energy Market Breakdown, By Type
- 9.6.5 SAM Wind Energy Market Breakdown, by Country
- 9.6.5.1 Brazil Wind Energy Market, Revenue and Forecast to 2028
- 9.6.5.1.1 Brazil Wind Energy Market Breakdown, By installation
- 9.6.5.1.2 Brazil Wind Energy Market Breakdown, By Type
- 9.6.5.2 Argentina Wind Energy Market, Revenue and Forecast to 2028
- 9.6.5.2.1 Argentina Wind Energy Market Breakdown, By installation
- 9.6.5.2.2 Argentina Wind Energy Market Breakdown, By Type
- 9.6.5.3 Rest of SAM Wind Energy Market, Revenue and Forecast to 2028
- 9.6.5.3.1 Rest of SAM Wind Energy Market Breakdown, By installation
- 9.6.5.3.2 Rest of SAM Wind Energy Market Breakdown, By Type
- 9.6.5.1 Brazil Wind Energy Market, Revenue and Forecast to 2028
10. Wind Energy Market- COVID-19 Impact Analysis
- 10.1 Overview
- 10.1 North America
- 10.2 Europe
- 10.3 APAC
- 10.4 MEA
- 10.5 SAM
11. Wind Energy Market - Industry Landscape
- 11.1 Overview
- 11.2 Market Initiative
- 11.3 New Product Development
- 11.4 Merger and Acquisition
12. Company Profiles
- 12.1 Vestas Wind Systems
- 12.1.1 Key Facts
- 12.1.2 Business Description
- 12.1.3 Products and Services
- 12.1.4 Financial Overview
- 12.1.5 SWOT Analysis
- 12.1.6 Key Developments
- 12.2 Goldwind
- 12.2.1 Key Facts
- 12.2.2 Business Description
- 12.2.3 Products and Services
- 12.2.4 Financial Overview
- 12.2.5 SWOT Analysis
- 12.2.6 Key Developments
- 12.3 Siemens Gamesa
- 12.3.1 Key Facts
- 12.3.2 Business Description
- 12.3.3 Products and Services
- 12.3.4 Financial Overview
- 12.3.5 SWOT Analysis
- 12.3.6 Key Developments
- 12.4 Envision
- 12.4.1 Key Facts
- 12.4.2 Business Description
- 12.4.3 Products and Services
- 12.4.4 Financial Overview
- 12.4.5 SWOT Analysis
- 12.4.6 Key Developments
- 12.5 GE Renewable Energy
- 12.5.1 Key Facts
- 12.5.2 Business Description
- 12.5.3 Products and Services
- 12.5.4 Financial Overview
- 12.5.5 SWOT Analysis
- 12.5.6 Key Developments
- 12.6 Mingyang Smart Energy
- 12.6.1 Key Facts
- 12.6.2 Business Description
- 12.6.3 Products and Services
- 12.6.4 Financial Overview
- 12.6.5 SWOT Analysis
- 12.6.6 Key Developments
- 12.7 NORDEX SE
- 12.7.1 Key Facts
- 12.7.2 Business Description
- 12.7.3 Products and Services
- 12.7.4 Financial Overview
- 12.7.5 SWOT Analysis
- 12.7.6 Key Developments
- 12.8 Shanghai Electric
- 12.8.1 Key Facts
- 12.8.2 Business Description
- 12.8.3 Products and Services
- 12.8.4 Financial Overview
- 12.8.5 SWOT Analysis
- 12.8.6 Key Developments
- 12.9 China Shipbuilding Group Haizhuang Wind Power Co., Ltd.
- 12.9.1 Key Facts
- 12.9.2 Business Description
- 12.9.3 Products and Services
- 12.9.4 Financial Overview
- 12.9.5 SWOT Analysis
- 12.9.6 Key Developments
- 12.10 Zhejiang Windey Co., Ltd.
- 12.10.1 Key Facts
- 12.10.2 Business Description
- 12.10.3 Products and Services
- 12.10.4 Financial Overview
- 12.10.5 SWOT Analysis
- 12.10.6 Key Developments
13. Appendix
- 13.1 About The Insight Partners
- 13.2 Word Index