|
|
市場調査レポート
商品コード
1754843
ミリタリーパワーソリューションの世界市場:2034年までの機会と戦略Military Power Solutions Global Market Opportunities And Strategies To 2034 |
||||||
|
|||||||
カスタマイズ可能
|
|||||||

| ミリタリーパワーソリューションの世界市場:2034年までの機会と戦略 |
|
出版日: 2025年06月16日
発行: The Business Research Company
ページ情報: 英文 325 Pages
納期: 2~3営業日
|

全表示
- 概要
- 目次
世界のミリタリーパワーソリューション市場は、2019年に70億5,054万米ドルと評価され、2024年まで5.00%以上の複合年間成長率(CAGR)で成長しました。
再生可能エネルギーの統合
再生可能エネルギーの統合がミリタリーパワーソリューション市場の成長を牽引してきました。再生可能エネルギーの軍用電力ソリューションへの統合は、エネルギー安全保障の強化、物流負担の軽減、運用効率の改善によって、変革的転換を促しています。軍隊が太陽光、風力、ハイブリッド・エネルギー・システムを採用するようになると、脆弱な燃料サプライ・チェーンへの依存を最小限に抑えながら、より大きな持続可能性を達成することができます。この移行は、戦場の回復力を強化するだけでなく、世界の持続可能性の目標にも合致し、多様な作戦環境における軍の戦略的・戦術的能力を強化します。例えば、フランスに本部を置く国際エネルギー機関(IEA)によると、2023年の太陽光発電の発電量は320テラワット時(TWh)と記録的な伸びを示し、2022年と比較して25%増加しました。世界の総発電量の5.4%を占め、水力、風力に次ぐ第3の再生可能エネルギーとして君臨しています。したがって、再生可能エネルギーの統合がミリタリーパワーソリューション市場の成長を牽引しました。
目次
第1章 エグゼクティブサマリー
- ミリタリーパワーソリューション-市場の魅力とマクロ経済情勢
第2章 目次
第3章 表一覧
第4章 図一覧
第5章 レポート構成
第6章 市場の特徴
- 一般的な市場の定義
- 概要
- ミリタリーパワーソリューション市場定義とセグメンテーション
- 市場セグメンテーション:タイプ別
- ポータブル
- 非ポータブル
- 市場セグメンテーション:電源別
- 電池
- 発電機
- 燃料電池
- エネルギーハーベスター
- その他の電源
- 市場セグメンテーション:ワット数別
- 低電力
- 中電力
- 高電力
- 市場セグメンテーション:プラットフォーム別
- 航空
- 陸上
- 海洋
第7章 主要な市場動向
- 戦術および監視用途向け高効率バッテリーの開発
- 戦術電力システムの防衛契約を締結
- 軍事および産業用途向けの耐久性に優れた電源ソリューション
- 高性能パワーユニットが戦術車両のアップグレードを推進
第8章 ミリタリーパワーソリューションの成長分析と戦略分析フレームワーク
- 世界のミリタリーパワーソリューションのPESTEL分析(政治、社会、技術、環境、法的要因)
- 政治的
- 経済
- 社会
- 技術的
- 環境
- 法律上
- エンドユーザー(B2B)の分析
- 軍隊
- 特殊作戦部隊(SOF)
- 防衛請負業者
- 無人システムオペレーター
- その他のエンドユーザー
- ミリタリーパワーソリューション市場:成長率分析
- 市場成長実績, 2019-2024
- 市場促進要因2019年~2024年
- 市場抑制要因2019-2024年
- 市場成長予測, 2024-2029, 2034F
- 市場促進要因2024年~2029年
- 市場抑制要因2024年~2029年
- 成長予測の貢献要因
- 量的成長の貢献者
- 促進要因
- 抑制要因
- 軍事用電力ソリューションの有効市場規模(TAM)
第9章 ミリタリーパワーソリューション市場:セグメンテーション
- ミリタリーパワーソリューション市場:タイプ別、実績と予測, 2019-2024, 2029F, 2034F
- ミリタリーパワーソリューション市場:ソース別、実績と予測, 2019-2024, 2029F, 2034F
- ミリタリーパワーソリューション市場:ワット数別、実績と予測, 2019-2024, 2029F, 2034F
- ミリタリーパワーソリューション市場:プラットフォーム別、実績と予測, 2019-2024, 2029F, 2034F
- ミリタリーパワーソリューション市場、ポータブル、タイプ別サブセグメンテーション、実績と予測, 2019-2024, 2029F, 2034F
- ミリタリーパワーソリューション市場、非ポータブル、タイプ別サブセグメンテーション、実績と予測, 2019-2024, 2029F, 2034F
第10章 ミリタリーパワーソリューション市場:地域・国別分析
- ミリタリーパワーソリューション市場:地域別、実績と予測, 2019-2024, 2029F, 2034F
- ミリタリーパワーソリューション市場:国別、実績と予測, 2019-2024, 2029F, 2034F
第11章 アジア太平洋市場
第12章 西欧市場
第13章 東欧市場
第14章 北米市場
第15章 南米市場
第16章 中東市場
第17章 アフリカ市場
第18章 競合情勢と企業プロファイル
- 企業プロファイル
- Raytheon Technologies Corporation
- Cummins Inc.
- EnerSys Inc.
- L3Harris Technologies Inc.
- Inventus Power Inc.
第19章 その他の大手企業と革新的企業
- Eaglepicher Technologies LLC
- Saft Group S.A.
- Northrop Grumman Corporation
- Oshkosh Defense LLC
- GS Yuasa Corporation
- Arotech Corporation
- Ultralife Corporation
- Rheinmetall AG
- HIMOINSA S.A.
- Digital Power Corporation
- Concorde Battery Corporation
- Advanced Conversion Technology Inc.
- SFC Energy AG.
- Denchi Power Ltd.
- Hyundai Rotem Company
第20章 競合ベンチマーキング
第21章 競合ダッシュボード
第22章 主要な合併と買収
- Atlas Energy Solutions Inc. Acquired Moser Energy Systems
- EnerSys Acquired Bren-Tronics
- HEICO Corporation Acquired Marway Power Solutions Inc.
第23章 ミリタリーパワーソリューションの最近の動向
- 高性能バッテリーが防衛能力を強化
- 高度な表面治療技術により軍事用途のバッテリー寿命が向上
- 軍事作戦用ポータブル水素発生器の試験
- 軍事施設にクリーンエネルギーを供給する新しい太陽光発電施設
- 極限の軍事条件向けに設計された高性能バッテリー
第24章 機会と戦略
- ミリタリーパワーソリューション市場2029:新たな機会を提供する国
- ミリタリーパワーソリューション市場2029:新たな機会を提供するセグメント
- ミリタリーパワーソリューション市場2029:成長戦略
- 市場動向に基づく戦略
- 競合の戦略
第25章 ミリタリーパワーソリューション市場、結論・提言
- 結論
- 提言
- 製品
- 場所
- 価格
- プロモーション
- 人々
第26章 付録
Military power solutions are specialized systems designed to provide reliable and efficient energy to military equipment and operations across various domains, including air, land and sea. These solutions are integral to modern defense forces, ensuring that a wide array of devices-from portable communication tools to large-scale vehicles and weaponry-receive consistent power to function effectively in diverse and often challenging environments.
The military power solutions market consists of sales by entities (organizations, sole traders and partnerships) of military power solutions that utilize these power solutions during training exercises, active combat, surveillance missions and humanitarian assistance operations, among other scenarios. Complementary products include advanced energy storage systems and power management technologies, while substitute products may involve alternative energy sources like renewable energy systems adapted for military use.
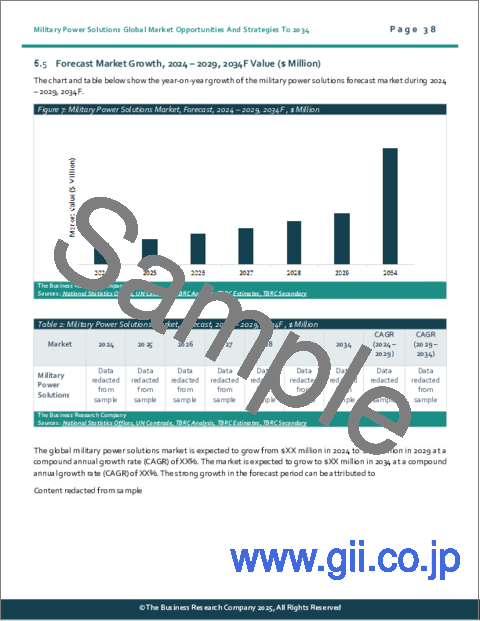
The global military power solutions market was valued at $7,050.54 million in 2019 which grew till 2024 at a compound annual growth rate (CAGR) of more than 5.00%.
Integration of Renewable Energy
During the historic period, the integration of renewable energy has driven the growth of the military power solutions market. The integration of renewable energy into military power solutions is driving a transformative shift by enhancing energy security, reducing logistical burdens and improving operational efficiency. As military forces increasingly adopt solar, wind and hybrid energy systems, they achieve greater sustainability while minimizing reliance on vulnerable fuel supply chains. This transition not only strengthens battlefield resilience but also aligns with global sustainability goals, reinforcing the military's strategic and tactical capabilities in diverse operational environments. For example, according to the International Energy Agency (IEA), a France-based, in 2023, solar PV power generation saw a record increase of 320 terawatt-hour (TWh), marking a 25% rise compared to 2022. It contributed 5.4% of the world's total electricity output and remains the third-largest renewable energy source, following hydropower and wind. Therefore, the integration of renewable energy drove the growth of the military power solutions market.
Defense Contract Awarded For Tactical Power Systems
Companies operating in the military power solutions market are focusing on the strategic military power initiative for tactical power systems. The initiative ensures continuity in supply and prevents the need to rebid or negotiate new terms unless performance or requirements change. For instance, in February 2024, Cummins Power Generation, a US-based provider of power solutions for military applications, secured a firm-fixed-price, indefinite-delivery or indefinite-quantity contract worth up to $509.5 million from the U.S. Army to manufacture and supply advanced medium mobile power sources (AMMPS) systems. These generators, powered by Jet Propellant 8, will be available in multiple configurations ranging from 5 kilowatts (kW) to 60 kW to support the tactical power generation needs of the Army and other Department of Defense entities.
The global military power solutions markets is fairly fragmented, with large number of players operating in the market. The top 10 competitors in the market made up 19.32% of the total market in 2023.
Military Power Solutions Global Market Opportunities And Strategies To 2034 from The Business Research Company provides the strategists; marketers and senior management with the critical information they need to assess the global military power solutions market as it emerges from the COVID-19 shut down.
Reasons to Purchase
- Gain a truly global perspective with the most comprehensive report available on this market covering 15 geographies.
- Understand how the market is being affected by the coronavirus and how it is likely to emerge and grow as the impact of the virus abates.
- Create regional and country strategies on the basis of local data and analysis.
- Identify growth segments for investment.
- Outperform competitors using forecast data and the drivers and trends shaping the market.
- Understand customers based on the latest market research findings.
- Benchmark performance against key competitors.
- Utilize the relationships between key data sets for superior strategizing.
- Suitable for supporting your internal and external presentations with reliable high-quality data and analysis.
Where is the largest and fastest-growing market for military power solutions? How does the market relate to the overall economy; demography and other similar markets? What forces will shape the market going forward? The military power solutions market global report from The Business Research Company answers all these questions and many more.
The report covers market characteristics; size and growth; segmentation; regional and country breakdowns; competitive landscape; market shares; trends and strategies for this market. It traces the market's history and forecasts market growth by geography. It places the market within the context of the wider military power solutions market; and compares it with other markets.
The report covers the following chapters
- Introduction and Market Characteristics- Brief introduction to the segmentations covered in the market, definitions and explanations about the segment by type, by source, by wattage and by platform.
- Key Trends- Highlights the major trends shaping the global market. This section also highlights likely future developments in the market.
- Macro-Economic Scenario- The report provides an analysis of the impact of the COVID-19 pandemic, impact of the Russia-Ukraine war and impact of rising inflation on global and regional markets, providing strategic insights for businesses in the aerospace forging market.
- Global Market Size And Growth- Global historic (2019-2024) and forecast (2024-2029, 2034F) market values and drivers and restraints that support and control the growth of the market in the historic and forecast periods.
- Regional And Country Analysis- Historic (2019-2024) and forecast (2024-2029, 2034F) market values and growth and market share comparison by region and country.
- Market Segmentation- Contains the market values (2019-2024) (2024-2029, 2034F) and analysis for each segment by type, by source, by wattage and by platform in the market. Historic (2019-2024) and forecast (2024-2029) and (2029-2034) market values and growth and market share comparison by region market.
- Regional Market Size And Growth- Regional market size (2024), historic (2019-2024) and forecast (2024-2029, 2034F) market values and growth and market share comparison of countries within the region. This report includes information on all the regions Asia-Pacific, Western Europe, Eastern Europe, North America, South America, Middle East and Africa and major countries within each region.
- Competitive Landscape- Details on the competitive landscape of the market, estimated market shares and company profiles of the leading players.
- Competitive Benchmarking- Briefs on the financials comparison between major players in the market.
- Competitive Dashboard- Briefs on competitive dashboard of major players.
- Key Mergers and Acquisitions- Information on recent mergers and acquisitions in the market is covered in the report. This section gives key financial details of mergers and acquisitions which have shaped the market in recent years.
- Market Opportunities And Strategies- Describes market opportunities and strategies based on findings of the research, with information on growth opportunities across countries, segments and strategies to be followed in those markets.
- Conclusions And Recommendations- This section includes recommendations for military power solutions providers in terms of product/service offerings geographic expansion, marketing strategies and target groups.
- Appendix- This section includes details on the NAICS codes covered, abbreviations and currencies codes used in this report.
Markets Covered:
- 1) By Type: Portable; Non-Portable
- 2) By Source: Batteries; Generators; Fuel Cells; Energy Harvesters; Other Sources
- 3) By Wattage: Low Power; Medium Power; High-Power
- 4) By Platform: Air; Land; Sea
- Companies Mentioned: Raytheon Technologies Corporation; Cummins Inc; EnerSys Inc; L3Harris Technologies Inc; Inventus Power Inc
- Countries: China; Australia; India; Indonesia; Japan; South Korea; USA; Canada; Brazil; France; Germany; UK; Italy; Spain; Russia
- Regions: Asia-Pacific; Western Europe; Eastern Europe; North America; South America; Middle East; Africa
- Time-series: Five years historic and ten years forecast.
- Data: Ratios of market size and growth to related markets; GDP proportions; expenditure per capita; military power solutions warranty indicators comparison.
- Data segmentations: country and regional historic and forecast data; market share of competitors; market segments.
- Sourcing and Referencing: Data and analysis throughout the report is sourced using end notes.
Table of Contents
1 Executive Summary
- 1.1 Military Power Solutions - Market Attractiveness And Macro Economic Landscape
2 Table Of Contents
3 List Of Tables
4 List Of Figures
5 Report Structure
6 Market Characteristics
- 6.1 General Market Definition
- 6.2 Summary
- 6.3 Military Power Solutions Market Definition And Segmentations
- 6.4 Market Segmentation By Type
- 6.4.1 Portable
- 6.4.2 Non-Portable
- 6.5 Market Segmentation By Source
- 6.5.1 Batteries
- 6.5.2 Generators
- 6.5.3 Fuel Cells
- 6.5.4 Energy Harvesters
- 6.5.5 Other Sources
- 6.6 Market Segmentation By Wattage
- 6.6.1 Low Power
- 6.6.2 Medium Power
- 6.6.3 High Power
- 6.7 Market Segmentation By Platform
- 6.7.1 Air
- 6.7.2 Land
- 6.7.3 Sea
7 Major Market Trends
- 7.1 High-Efficiency Battery Development for Tactical and Surveillance Use
- 7.2 Defense Contract Awarded For Tactical Power Systems
- 7.3 Durable Power Solution for Military and Industrial Use
- 7.4 High-Performance Power Units Drive Tactical Vehicle Upgrades
8 Military Power Solutions Growth Analysis And Strategic Analysis Framework
- 8.1 Global Military Power Solutions PESTEL Analysis (Political, Social, Technological, Environmental and Legal Factors)
- 8.1.1 Political
- 8.1.2 Economic
- 8.1.3 Social
- 8.1.4 Technological
- 8.1.5 Environmental
- 8.1.6 Legal
- 8.2 Analysis Of End User (B2B)
- 8.2.1 Armed Forces
- 8.2.2 Special Operations Forces (SOF)
- 8.2.3 Defense Contractors
- 8.2.4 Unmanned Systems Operators
- 8.2.5 Other End Users
- 8.3 Military Power Solutions Market Growth Rate Analysis
- 8.4 Historic Market Growth, 2019 - 2024, Value ($ Million)
- 8.4.1 Market Drivers 2019 - 2024
- 8.4.2 Market Restraints 2019- 2024
- 8.5 Forecast Market Growth, 2024 - 2029, 2034F Value ($ Million)
- 8.5.1 Market Drivers 2024 - 2029
- 8.5.2 Market Restraints 2024 - 2029
- 8.6 Forecast Growth Contributors/Factors
- 8.6.4 Quantitative Growth Contributors
- 8.6.5 Drivers
- 8.6.6 Restraints
- 8.7 Military Power Solutions Total Addressable Market (TAM)
9 Military Power Solutions Market Segmentation
- 9.1 Military Power Solutions Market, Segmentation By Type, Historic And Forecast, 2019 - 2024, 2029F, 2034F, Value ($ Million)
- 9.2 Military Power Solutions Market, Segmentation By Source, Historic And Forecast, 2019 - 2024, 2029F, 2034F, Value ($ Million)
- 9.3 Military Power Solutions Market, Segmentation By Wattage, Historic And Forecast, 2019 - 2024, 2029F, 2034F, Value ($ Million)
- 9.4 Military Power Solutions Market, Segmentation By Platform, Historic And Forecast, 2019 - 2024, 2029F, 2034F, Value ($ Million)
- 9.5 Military Power Solutions Market, Sub-Segmentation Of Portable, By Type, Historic And Forecast, 2019 - 2024, 2029F, 2034F, Value ($ Million)
- 9.6 Military Power Solutions Market, Sub-Segmentation By Non-Portable, By Type, Historic And Forecast, 2019 - 2024, 2029F, 2034F, Value ($ Million)
10 Military Power Solutions Market, Regional and Country Analysis
- 10.1 Military Power Solutions Market, By Region, Historic and Forecast, 2019 - 2024, 2029F, 2034F, Value ($ Million)
- 10.2 Military Power Solutions Market, By Country, Historic and Forecast, 2019 - 2024, 2029F, 2034F, Value ($ Million)
11 Asia-Pacific Market
- 11.1 Summary
- 11.2 Market Overview
- 11.2.1 Region Information
- 11.2.2 Market Information
- 11.2.3 Background Information
- 11.2.4 Government Initiatives
- 11.2.5 Regulations
- 11.2.6 Regulatory Bodies
- 11.2.7 Major Associations
- 11.2.8 Taxes Levied
- 11.2.9 Corporate Tax Structure
- 11.2.10 Investments
- 11.2.11 Major Companies
- 11.3 Asia-Pacific Military Power Solutions Market, Segmentation By Type, Historic And Forecast, 2019 - 2024, 2029F, 2034F, Value ($ Million)
- 11.4 Asia-Pacific Military Power Solutions Market, Segmentation By Source, Historic And Forecast, 2019 - 2024, 2029F, 2034F, Value ($ Million)
- 11.5 Asia-Pacific Military Power Solutions Market, Segmentation By Wattage, Historic And Forecast, 2019 - 2024, 2029F, 2034F, Value ($ Million)
- 11.6 China Market
- 11.7 Summary
- 11.8 Market Overview
- 11.8.1 Country Information
- 11.8.2 Market Information
- 11.8.3 Background Information
- 11.8.4 Government Initiatives
- 11.8.5 Regulations
- 11.8.6 Regulatory Bodies
- 11.8.7 Major Associations
- 11.8.8 Taxes Levied
- 11.8.9 Corporate Tax Structure
- 11.8.10 Major Companies
- 11.9 China Military Power Solutions Market, Segmentation By Type, Historic And Forecast, 2019 - 2024, 2029F, 2034F, Value ($ Million)
- 11.10 China Military Power Solutions Market, Segmentation By Source, Historic And Forecast, 2019 - 2024, 2029F, 2034F, Value ($ Million)
- 11.11 China Military Power Solutions Market, Segmentation By Wattage, Historic And Forecast, 2019 - 2024, 2029F, 2034F, Value ($ Million)
- 11.12 India Market
- 11.13 India Military Power Solutions Market, Segmentation By Type, Historic And Forecast, 2019 - 2024, 2029F, 2034F, Value ($ Million)
- 11.14 India Military Power Solutions Market, Segmentation By Source, Historic And Forecast, 2019 - 2024, 2029F, 2034F, Value ($ Million)
- 11.15 India Military Power Solutions Market, Segmentation By Wattage, Historic And Forecast, 2019 - 2024, 2029F, 2034F, Value ($ Million)
- 11.16 Japan Market
- 11.17 Summary
- 11.18 Market Overview
- 11.18.1 Country Information
- 11.18.2 Market Information
- 11.18.3 Background Information
- 11.18.4 Government Initiatives
- 11.18.5 Regulations
- 11.18.6 Regulatory Bodies
- 11.18.7 Major Associations
- 11.18.8 Taxes Levied
- 11.18.9 Corporate Tax Structure
- 11.18.10 Major Companies
- 11.19 Japan Military Power Solutions Market, Segmentation By Type, Historic And Forecast, 2019 - 2024, 2029F, 2034F, Value ($ Million)
- 11.20 Japan Military Power Solutions Market, Segmentation By Source, Historic And Forecast, 2019 - 2024, 2029F, 2034F, Value ($ Million)
- 11.21 Japan Military Power Solutions Market, Segmentation By Wattage, Historic And Forecast, 2019 - 2024, 2029F, 2034F, Value ($ Million)
- 11.22 Australia Market
- 11.23 Australia Military Power Solutions Market, Segmentation By Type, Historic And Forecast, 2019 - 2024, 2029F, 2034F, Value ($ Million)
- 11.24 Australia Military Power Solutions Market, Segmentation By Source, Historic And Forecast, 2019 - 2024, 2029F, 2034F, Value ($ Million)
- 11.25 Australia Military Power Solutions Market, Segmentation By Wattage, Historic And Forecast, 2019 - 2024, 2029F, 2034F, Value ($ Million)
- 11.26 Indonesia Market
- 11.27 Indonesia Military Power Solutions Market, Segmentation By Type, Historic And Forecast, 2019 - 2024, 2029F, 2034F, Value ($ Million)
- 11.28 Indonesia Military Power Solutions Market, Segmentation By Source, Historic And Forecast, 2019 - 2024, 2029F, 2034F, Value ($ Million)
- 11.29 Indonesia Military Power Solutions Market, Segmentation By Wattage, Historic And Forecast, 2019 - 2024, 2029F, 2034F, Value ($ Million)
- 11.30 South Korea Market
- 11.31 Summary
- 11.32 Market Overview
- 11.32.1 Country Information
- 11.32.2 Market Information
- 11.32.3 Background Information
- 11.32.4 Government Initiatives
- 11.32.5 Regulations
- 11.32.6 Regulatory Bodies
- 11.32.7 Major Associations
- 11.32.8 Taxes Levied
- 11.32.9 Corporate Tax Structure
- 11.32.10 Investments
- 11.32.11 Major Companies
- 11.33 South Korea Military Power Solutions Market, Segmentation By Type, Historic And Forecast, 2019 - 2024, 2029F, 2034F, Value ($ Million)
- 11.34 South Korea Military Power Solutions Market, Segmentation By Source, Historic And Forecast, 2019 - 2024, 2029F, 2034F, Value ($ Million)
- 11.35 South Korea Military Power Solutions Market, Segmentation By Wattage, Historic And Forecast, 2019 - 2024, 2029F, 2034F, Value ($ Million)
12 Western Europe Market
- 12.1 Summary
- 12.2 Market Overview
- 12.2.1 Region Information
- 12.2.2 Market Information
- 12.2.3 Background Information
- 12.2.4 Government Initiatives
- 12.2.5 Regulations
- 12.2.6 Regulatory Bodies
- 12.2.7 Major Associations
- 12.2.8 Taxes Levied
- 12.2.9 Corporate tax structure
- 12.2.10 Investments
- 12.2.11 Major Companies
- 12.3 Western Europe Military Power Solutions Market, Segmentation By Type, Historic And Forecast, 2019 - 2024, 2029F, 2034F, Value ($ Million)
- 12.4 Western Europe Military Power Solutions Market, Segmentation By Source, Historic And Forecast, 2019 - 2024, 2029F, 2034F, Value ($ Million)
- 12.5 Western Europe Military Power Solutions Market, Segmentation By Wattage, Historic And Forecast, 2019 - 2024, 2029F, 2034F, Value ($ Million)
- 12.6 Western Europe Military Power Solutions Market: Country Analysis
- 12.7 UK Market
- 12.8 UK Military Power Solutions Market, Segmentation By Type, Historic And Forecast, 2019 - 2024, 2029F, 2034F, Value ($ Million)
- 12.9 UK Military Power Solutions Market, Segmentation By Source, Historic And Forecast, 2019 - 2024, 2029F, 2034F, Value ($ Million)
- 12.10 UK Military Power Solutions Market, Segmentation By Wattage, Historic And Forecast, 2019 - 2024, 2029F, 2034F, Value ($ Million)
- 12.11 Germany Market
- 12.12 Germany Military Power Solutions Market, Segmentation By Type, Historic And Forecast, 2019 - 2024, 2029F, 2034F, Value ($ Million)
- 12.13 Germany Military Power Solutions Market, Segmentation By Source, Historic And Forecast, 2019 - 2024, 2029F, 2034F, Value ($ Million)
- 12.14 Germany Military Power Solutions Market, Segmentation By Wattage, Historic And Forecast, 2019 - 2024, 2029F, 2034F, Value ($ Million)
- 12.15 France Market
- 12.16 France Military Power Solutions Market, Segmentation By Type, Historic And Forecast, 2019 - 2024, 2029F, 2034F, Value ($ Million)
- 12.17 France Military Power Solutions Market, Segmentation By Source, Historic And Forecast, 2019 - 2024, 2029F, 2034F, Value ($ Million)
- 12.18 France Military Power Solutions Market, Segmentation By Wattage, Historic And Forecast, 2019 - 2024, 2029F, 2034F, Value ($ Million)
- 12.19 Italy Market
- 12.20 Italy Military Power Solutions Market, Segmentation By Type, Historic And Forecast, 2019 - 2024, 2029F, 2034F, Value ($ Million)
- 12.21 Italy Military Power Solutions Market, Segmentation By Source, Historic And Forecast, 2019 - 2024, 2029F, 2034F, Value ($ Million)
- 12.22 Italy Military Power Solutions Market, Segmentation By Wattage, Historic And Forecast, 2019 - 2024, 2029F, 2034F, Value ($ Million)
- 12.23 Spain Market
- 12.24 Spain Military Power Solutions Market, Segmentation By Type, Historic And Forecast, 2019 - 2024, 2029F, 2034F, Value ($ Million)
- 12.25 Spain Military Power Solutions Market, Segmentation By Source, Historic And Forecast, 2019 - 2024, 2029F, 2034F, Value ($ Million)
- 12.26 Spain Military Power Solutions Market, Segmentation By Wattage, Historic And Forecast, 2019 - 2024, 2029F, 2034F, Value ($ Million)
13 Eastern Europe Market
- 13.1 Summary
- 13.2 Market Overview
- 13.2.1 Region Information
- 13.2.2 Market Information
- 13.2.3 Background Information
- 13.2.4 Government Initiatives
- 13.2.5 Regulations
- 13.2.6 Regulatory Bodies
- 13.2.7 Major Associations
- 13.2.8 Taxes Levied
- 13.2.9 Corporate Tax Structure
- 13.2.10 Investments
- 13.2.11 Major companies
- 13.3 Eastern Europe Military Power Solutions Market, Segmentation By Type, Historic And Forecast, 2019 - 2024, 2029F, 2034F, Value ($ Million)
- 13.4 Eastern Europe Military Power Solutions Market, Segmentation By Source, Historic And Forecast, 2019 - 2024, 2029F, 2034F, Value ($ Million)
- 13.5 Eastern Europe Military Power Solutions Market, Segmentation By Wattage, Historic And Forecast, 2019 - 2024, 2029F, 2034F, Value ($ Million)
- 13.6 Russia Market
- 13.7 Russia Military Power Solutions Market, Segmentation By Type, Historic And Forecast, 2019 - 2024, 2029F, 2034F, Value ($ Million)
- 13.8 Russia Military Power Solutions Market, Segmentation By Source, Historic And Forecast, 2019 - 2024, 2029F, 2034F, Value ($ Million)
- 13.9 Russia Military Power Solutions Market, Segmentation By Wattage, Historic And Forecast, 2019 - 2024, 2029F, 2034F, Value ($ Million)
14 North America Market
- 14.1 Summary
- 14.2 Market Overview
- 14.2.1 Region Information
- 14.2.2 Market Information
- 14.2.3 Background Information
- 14.2.4 Government Initiatives
- 14.2.5 Regulations
- 14.2.6 Regulatory Bodies
- 14.2.7 Major Associations
- 14.2.8 Taxes Levied
- 14.2.9 Corporate Tax Structure
- 14.2.10 Investments
- 14.2.11 Major Companies
- 14.3 North America Military Power Solutions Market, Segmentation By Type, Historic And Forecast, 2019 - 2024, 2029F, 2034F, Value ($ Million)
- 14.4 North America Military Power Solutions Market, Segmentation By Source, Historic And Forecast, 2019 - 2024, 2029F, 2034F, Value ($ Million)
- 14.5 North America Military Power Solutions Market, Segmentation By Wattage, Historic And Forecast, 2019 - 2024, 2029F, 2034F, Value ($ Million)
- 14.6 North America Military Power Solutions Market: Country Analysis
- 14.7 USA Market
- 14.8 Summary
- 14.9 Market Overview
- 14.9.1 Country Information
- 14.9.2 Market Information
- 14.9.3 Background Information
- 14.9.4 Government Initiatives
- 14.9.5 Regulations
- 14.9.6 Regulatory Bodies
- 14.9.7 Major Associations
- 14.9.8 Taxes Levied
- 14.9.9 Corporate Tax Structure
- 14.9.10 Investments
- 14.9.11 Major Companies
- 14.10 USA Military Power Solutions Market, Segmentation By Type, Historic And Forecast, 2019 - 2024, 2029F, 2034F, Value ($ Million)
- 14.11 USA Military Power Solutions Market, Segmentation By Source, Historic And Forecast, 2019 - 2024, 2029F, 2034F, Value ($ Million)
- 14.12 USA Military Power Solutions Market, Segmentation By Wattage, Historic And Forecast, 2019 - 2024, 2029F, 2034F, Value ($ Million)
- 14.13 Canada Market
- 14.14 Summary
- 14.15 Market Overview
- 14.15.1 Country Information
- 14.15.2 Market Information
- 14.15.3 Background Information
- 14.15.4 Government Initiatives
- 14.15.5 Regulations
- 14.15.6 Regulatory Bodies
- 14.15.7 Major Associations
- 14.15.8 Taxes Levied
- 14.15.9 Corporate Tax Structure
- 14.15.10 Investments
- 14.15.11 Major Companies
- 14.16 Canada Military Power Solutions Market, Segmentation By Type, Historic And Forecast, 2019 - 2024, 2029F, 2034F, Value ($ Million)
- 14.17 Canada Military Power Solutions Market, Segmentation By Source, Historic And Forecast, 2019 - 2024, 2029F, 2034F, Value ($ Million)
- 14.18 Canada Military Power Solutions Market, Segmentation By Wattage, Historic And Forecast, 2019 - 2024, 2029F, 2034F, Value ($ Million)
15 South America Market
- 15.1 Summary
- 15.2 Market Overview
- 15.2.4 Region Information
- 15.2.5 Market Information
- 15.2.6 Background Information
- 15.2.7 Government Initiatives
- 15.2.8 Regulations
- 15.2.9 Regulatory Bodies
- 15.2.10 Major Associations
- 15.2.11 Taxes Levied
- 15.2.12 Corporate Tax Structure
- 15.2.13 Major Companies
- 15.3 South America Military Power Solutions Market, Segmentation By Type, Historic And Forecast, 2019 - 2024, 2029F, 2034F, Value ($ Million)
- 15.4 South America Military Power Solutions Market, Segmentation By Source, Historic And Forecast, 2019 - 2024, 2029F, 2034F, Value ($ Million)
- 15.5 South America Military Power Solutions Market, Segmentation By Wattage, Historic And Forecast, 2019 - 2024, 2029F, 2034F, Value ($ Million)
- 15.6 South America Military Power Solutions Market: Country Analysis
- 15.7 Brazil Market
- 15.8 Brazil Military Power Solutions Market, Segmentation By Type, Historic And Forecast, 2019 - 2024, 2029F, 2034F, Value ($ Million)
- 15.9 Brazil Military Power Solutions Market, Segmentation By Source, Historic And Forecast, 2019 - 2024, 2029F, 2034F, Value ($ Million)
- 15.10 Brazil Military Power Solutions Market, Segmentation By Wattage, Historic And Forecast, 2019 - 2024, 2029F, 2034F, Value ($ Million)
16 Middle East Market
- 16.1 Summary
- 16.2 Market Overview
- 16.2.1 Region Information
- 16.2.2 Market Information
- 16.2.3 Background Information
- 16.2.4 Government Initiatives
- 16.2.5 Regulations
- 16.2.6 Regulatory Bodies
- 16.2.7 Major Associations
- 16.2.8 Taxes Levied
- 16.2.9 Corporate Tax Structure
- 16.2.10 Investments
- 16.2.11 Major Companies
- 16.3 Middle East Military Power Solutions Market, Segmentation By Type, Historic And Forecast, 2019 - 2024, 2029F, 2034F, Value ($ Million)
- 16.4 Middle East Military Power Solutions Market, Segmentation By Source, Historic And Forecast, 2019 - 2024, 2029F, 2034F, Value ($ Million)
- 16.5 Middle East Military Power Solutions Market, Segmentation By Wattage, Historic And Forecast, 2019 - 2024, 2029F, 2034F, Value ($ Million)
17 Africa Market
- 17.1 Summary
- 17.2 Market Overview
- 17.2.1 Region Information
- 17.2.2 Market Information
- 17.2.3 Background Information
- 17.2.4 Government Initiatives
- 17.2.5 Regulations
- 17.2.6 Regulatory Bodies
- 17.2.7 Major Associations
- 17.2.8 Taxes Levied
- 17.2.9 Corporate Tax Structure
- 17.2.10 Major Companies
- 17.3 Africa Military Power Solutions Market, Segmentation By Type, Historic And Forecast, 2019 - 2024, 2029F, 2034F, Value ($ Million)
- 17.4 Africa Military Power Solutions Market, Segmentation By Source, Historic And Forecast, 2019 - 2024, 2029F, 2034F, Value ($ Million)
- 17.5 Africa Military Power Solutions Market, Segmentation By Wattage, Historic And Forecast, 2019 - 2024, 2029F, 2034F, Value ($ Million)
18 Competitive Landscape And Company Profiles
- 18.1 Company Profiles
- 18.2 Raytheon Technologies Corporation
- 18.2.1 Company Overview
- 18.2.2 Products And Services
- 18.2.3 Business Strategy
- 18.2.4 Financial Overview
- 18.3 Cummins Inc.
- 18.3.1 Company Overview
- 18.3.2 Products And Services
- 18.3.3 Business Strategy
- 18.3.4 Financial Overview
- 18.4 EnerSys Inc.
- 18.4.1 Company Overview
- 18.4.2 Products And Services
- 18.4.3 Financial Overview
- 18.5 L3Harris Technologies Inc.
- 18.5.1 Company Overview
- 18.5.2 Products And Services
- 18.5.3 Financial Overview
- 18.6 Inventus Power Inc.
- 18.6.1 Company Overview
- 18.6.2 Products And Services
- 18.6.3 Financial Overview
19 Other Major And Innovative Companies
- 19.1 Eaglepicher Technologies LLC
- 19.1.1 Company Overview
- 19.1.2 Products And Services
- 19.2 Saft Group S.A.
- 19.2.1 Company Overview
- 19.2.2 Products And Services
- 19.3 Northrop Grumman Corporation
- 19.3.1 Company Overview
- 19.3.2 Products And Services
- 19.4 Oshkosh Defense LLC
- 19.4.1 Company Overview
- 19.4.2 Products And Services
- 19.5 GS Yuasa Corporation
- 19.5.1 Company Overview
- 19.5.2 Products And Services
- 19.6 Arotech Corporation
- 19.6.1 Company Overview
- 19.6.2 Products And Services
- 19.7 Ultralife Corporation
- 19.7.1 Company Overview
- 19.7.2 products And Services
- 19.8 Rheinmetall AG
- 19.8.1 Company Overview
- 19.8.2 Products And Services
- 19.9 HIMOINSA S.A.
- 19.9.1 Company Overview
- 19.9.2 Products And Services
- 19.10 Digital Power Corporation
- 19.10.1 Company Overview
- 19.10.2 Products And Services
- 19.11 Concorde Battery Corporation
- 19.11.1 Company Overview
- 19.11.2 Products And Services
- 19.12 Advanced Conversion Technology Inc.
- 19.12.1 Company Overview
- 19.12.2 Products And Services
- 19.13 SFC Energy AG.
- 19.13.1 Company Overview
- 19.13.2 Products And Services
- 19.14 Denchi Power Ltd.
- 19.14.1 Company Overview
- 19.14.2 Products And Services
- 19.15 Hyundai Rotem Company
- 19.15.1 Company Overview
- 19.15.2 Products And Services
20 Competitive Benchmarking
21 Competitive Dashboard
22 Key Mergers And Acquisitions
- 22.1 Atlas Energy Solutions Inc. Acquired Moser Energy Systems
- 22.2 EnerSys Acquired Bren-Tronics
- 22.3 HEICO Corporation Acquired Marway Power Solutions Inc.
23 Recent Developments in Military Power Solutions
- 23.1 High-Performance Batteries Strengthen Defense Capabilities
- 23.2 Advanced Surface Treatment Technology Improves Battery Lifespan for Military Applications
- 23.3 Portable Hydrogen Generator Trials for Military Operations
- 23.4 New Solar Facilities to Deliver Clean Energy to Military Sites
- 23.5 High-Performance Battery Designed for Extreme Military Conditions
24 Opportunities And Strategies
- 24.1 Military Power Solutions Market In 2029 - Countries Offering Most New Opportunities
- 24.2 Military Power Solutions Market In 2029 - Segments Offering Most New Opportunities
- 24.3 Military Power Solutions Market In 2029 - Growth Strategies
- 24.3.1 Market Trend Based Strategies
- 24.3.2 Competitor Strategies
25 Military Power Solution Market, Conclusions And Recommendations
- 25.1 Conclusions
- 25.2 Recommendations
- 25.2.1 Product
- 25.2.2 Place
- 25.2.3 Price
- 25.2.4 Promotion
- 25.2.5 People
26 Appendix
- 26.1 Geographies Covered
- 26.2 Market Data Sources
- 26.3 Research Methodology
- 26.4 Currencies
- 26.5 The Business Research Company
- 26.6 Copyright and Disclaimer
