|
|
市場調査レポート
商品コード
1563195
ワイヤーおよびケーブル市場(2024年):第6版Wire and Cable Report Ed 6 2024 |
||||||
|
|||||||
|
|||||||


| ワイヤーおよびケーブル市場(2024年):第6版 |
|
出版日: 2024年09月23日
発行: StatPlan Energy Limited
ページ情報: 英文 232 Pages, 32 Figures, 138 Tables
納期: 即納可能
|

全表示
- 概要
- 目次
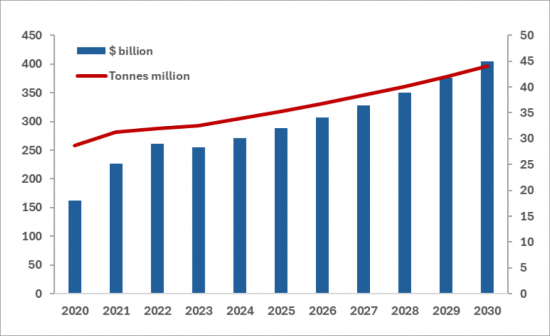
世界のケーブルと導体のトン数はほぼ直線的な伸びをたどってきましたが、需要額は2021年と2022年に35%以上急増しました。一部はCOVID-19パンデミックからの回復と金属価格が50%上昇したためです。銅価格は安定し、2022年にはわずかに下落しました。2023年には2,540億米ドルの需要が6.4%のCAGRで成長を再開し、2028年には3,460億米ドルに達すると予測されています。
ワイヤおよびケーブル市場(2024年):第6版
2023年の市場規模は中国が610億米ドルで最大、米国の340億米ドル、インドの200億米ドルがこれに続きました。これらの合計額は2023年の1,150億米ドルから2028年には1,340億米ドルに増加します。
陸上地下ケーブルは最大のカテゴリーで、2023年には620億米ドルになります。絶縁海底ケーブルは220億米ドルで4位でしたが、CAGRは15.7%で、ケーブルの中では最も高い成長率を示しています。
当レポートでは、世界のワイヤーおよびケーブル市場について調査し、ユーティリティネットワークや産業、自動車、OEMメーカーで使用される絶縁電力ケーブル、裸電力導体、金属通信ケーブル、低電圧ケーブルの需要を予測しています。また、カテゴリー別の動向、2023年~2028年の地域別市場を分析しています。
目次
第1章 エグゼクティブサマリー
第2章 エネルギーおよび通信ケーブル、エネルギー導体および機械用ロープ
- ケーブルと導体の定義
第3章 世界のワイヤーおよびケーブルの生産と需要
- 材料費と販売価格
- 絶縁エネルギーケーブル、裸導体、その他すべてのケーブル、2020年~2028年
- 生産、輸入、輸出、消費
第4章 ワイヤーおよびケーブルの消費、最終用途別
第5章 欧州のワイヤーおよびケーブル市場
- 欧州の電力部門
- 欧州における再生可能エネルギー発電能力の拡大
- 欧州におけるケーブルの産業消費
- オーストリア
- ベルギー
- デンマーク
- フィンランド
- フランス
- ドイツ
- ギリシャ
- アイルランド
- イタリア
- オランダ
- ノルウェー
- ポーランド
- スペイン
- スウェーデン
- トルコ
- 英国
- 南東欧のワイヤーおよびケーブル製造業者
第6章 北米のワイヤーおよびケーブル市場
- 米国
- カナダ
第7章 南米のワイヤーおよびケーブル市場
- アルゼンチン
- ブラジル
- チリ
- コロンビア
第8章 中米のワイヤーおよびケーブル市場
- メキシコ
第9章 中東のワイヤーおよびケーブル市場
- ケーブルメーカー
- サウジアラビア
- イラン
- アラブ首長国連邦
第10章 北アフリカのワイヤーおよびケーブル市場
- エジプト
第11章 サハラ以南アフリカのワイヤーおよびケーブル市場
第12章 中国のワイヤーおよびケーブル市場
第13章 アジア太平洋(中国を除く)のワイヤーおよびケーブル市場
- インド
- インドネシア
- 韓国
- 日本
- マレーシア
- 台湾
- タイ
- ベトナム
第14章 CISのワイヤーおよびケーブル市場
第15章 世界のワイヤーおよびケーブルの生産、輸入、輸出、消費
第16章 ワイヤーおよびケーブル消費量、国別
第17章 銅とアルミニウムの供給と需要
- アルミニウムの需要と供給
- 銅の需要と供給
- 銅とアルミニウムの価格
第18章 金属線とケーブルの応用と技術
第19章 エネルギーおよび通信ケーブル製造業者
第20章 ワイヤーおよびケーブルメーカーの概要
- 欧州
- Prysmian
- General Cable (Prysmian)
- Nexans
- Nexans Amercable
- NKT High Voltage Cables
- Cablel-R Hellenic Cables
- JDR
- TF Kable
- Leoni
- 欧州のHV市場に参入する企業
- 欧州市場で事業を展開するアジア企業
- 米国
- Southwire
- Parker Scanrope
- Belden Inc
- 日本のメーカー
- Sumitomo Electric
- Fujikura
- Furakawa
- Hitachi
- J-Power Systems (JPS)
- J-Power Systems Saudi Co, (JPS Saudi),
- Yazaki
- 韓国
- LS Cables
- Taihan Electric Wire Co Ltd
- Iljin Cable
- インド
- Finolex J-Power Systems Private Ltd (FJPS)
- Birla Cable Ltd
- Polycab
- Sterlite
- 中国のメーカー
- Zhongtian Technology [ZTT]
- Ningbao Orient Cable
- TBEA Co., Ltd
- Far East Cable Co Ltd
- Wanda Group Holdings Co., Ltd,
- Baosheng High Voltage Cable Co. Ltd., BHVC
- Jiangsu Shangshang Cable Group
- 絶縁ケーブルの生産能力と利用率
- 中国
- インド
- 海底ケーブルメーカー
第21章 陸上地下ケーブル
第22章 海底電力ケーブル
第23章 産業用ケーブル市場
第24章 電化鉄道
第25章 先端技術、超伝導体
第26章 金属の盗難
第27章 ケーブルの特性
調査手法
Demand for cables surges in 2021 and 2022
While global tonnage of cable and conductors has followed a roughly linear growth, the value of demand surged over 35% in 2021 and again in 2022 partly due to recovery from the Covid pandemic and because of a 50% rise in metals prices. The copper price stabilised and fell slightly in 2022. In 2023 demand of $254 billion resumed a growth with cagr of 6.4% and is predicted to reach $346 billion by 2028.
Wire and Cable Report Ed 6 2024
China is the largest market worth $61 billion in 2023, followed by the United States with $34 billion and India with $20 billion. Their combined value will increase from $115 billion in 2023 to $134 billion in 2028.
Land-based underground cable was the largest category, worth $62 billion in 2023. Insulated subsea cable is in fourth place with $22 billion but has the highest growth of any cable with a cagr of 15.7%.
Cable and conductor product categories
This report surveys the metallic wire and cable market, sizing and forecasting demand for insulated power cable, bare power conductors, metallic communications cable and low voltage cable used in utility networks and industry, auto and OEM producers.
- Comprehensive analysis - data analysed by twelve cable and conductor categories, classified by type, application and material - copper, aluminium and steel.
- Market analysis - the markets in 37 countries and 7 regions are analysed by the twelve product groups from 2023 to 2028.
Production, imports, exports, consumption
Each country and region analysed by production imports, exports and demand.
Competitive landscape and share analysis
A comprehensive outline of the 34 leading cable companies, ranking of companies in each market, global market shares of top 50 companies.
232 pages, 32 figures, 138 tables.
New methodology
A new methodology has been developed for this market report, which is more rigorous and sensitive to individual categories of wire and cable. The markets for each of the twelve cable products measured in this report was sized and forecast individually in each country. Tonnage for every product was established in the base year, forecast on a trend analysis basis from industry reports and the value of demand based on forecasts of materials cost in each year.
Product analysis
The market in each country is analysed by twelve cable & conductor product groups.
- 1. Power cable network LV, MV, HV - copper- underground
- 2. Power cable network LV, MV, HV - copper- subsea
- 3. Power cable network LV, MV, HV - aluminium - underground
- 4. Bare conductor - copper - LV - overhead
- 5. Bare conductor AAAC - aluminium - LV, MV - overhead
- 6. Bare ACSR - aluminium and steel - HV, MV - overhead
- 7. Telecom cable (external) - copper
- 8. Other comms cable - (internal) - copper
- 9. Building wire < 600 V - copper
- 10. Magnet wire - copper
- 11. Auto wire & cable - copper
- 12. Other LV energy - copper
Outline and analysis of subsea markets for cable
Outlines of the three subsea sectors; interconnectors, offshore wind and OGP (oil & gas production) and listing of subsea cale producers.
Land based underground cable
Country analysis of underground cable penetration and technical descriptions.
Applications and technology of cables and conductors
The different types of conductor and cable, applications, technology of insulation.
Superconductors
Outline of the superconductor industry and state of commercialisation.
Railway lines
National penetration of railway electrification, cable markets and technology.
PDF and Excel reports
The PDF report contains statistics of the markets and descriptive marketing and industry analysis. The Excel database contains expanded statistical analysis of tonnage and $ value demand, and detailed product analysis of imports and exports.
TABLE OF CONTENTS
1. EXECUTIVE SUMMARY
- Tonnage of production and consumption
- Consumption of metallic wire and cable
- Materials cost
- Regional market shares
- End users and trade
- Manufacturers
- Land-based cable
- Subsea cable
- Interconnections and offshore wind power
- Oil & gas exploration and production
- Superconductors
2. ENERGY AND COMMUNICATIONS CABLES, ENERGY CONDUCTORS AND MECHNICAL ROPE
- Cables and conductor definitions
3. GLOBAL PRODUCTION AND DEMAND OF WIRE AND CABLE
- The cost of materials and sales value
- Insulated energy cable, bare conductors, and all other cables, 2020-2028
- Production, imports, exports and consumption
4. CONSUMPTION OF WIRE AND CABLE BY END USE
5. THE EUROPEAN WIRE AND CABLE MARKET
- The power sector in Europe
- The expansion of renewable generating capacity in Europe
- Industrial consumption of cables in Europe
- Austria
- Cable manufacturers
- Belgium
- Cable manufacturers
- Denmark
- Cable manufacturers
- Finland
- Cable manufacturers
- France
- End users
- Power sector
- Telecoms sector
- Building wire
- Auto sector
- Cable manufacturers
- Germany
- The German manufacturing industry
- End users
- Power sector
- Telecoms sector
- Building wire
- Auto sector
- Cable manufacturers
- Greece
- Cable manufacturers
- Ireland
- Cable manufacturers
- Italy
- End users
- Power sector
- Telecoms sector
- Building wire
- Auto sector
- Cable manufacturers
- Netherlands
- Cable manufacturers
- Norway
- Cable manufacturers
- Poland
- Cable manufacturers
- Spain
- End users
- Power sector
- Telecoms sector
- Building wire
- Auto sector
- Cable manufacturers
- Sweden
- Cable manufacturers
- Turkey
- Cable manufacturers
- United Kingdom
- End users
- Power sector
- Telecoms sector
- Building wire
- Auto sector
- Cable manufacturers
- Wire and cable manufacturers in South Eastern Europe
- BOSNIA-HERZEGOVINA
- BULGARIA
- CROATIA
- MACEDONIA
- ROMANIA
- SERBIA
- SLOVENIA
6. THE NORTH AMERICAN WIRE AND CABLE MARKET
- United States
- The industrial sector
- Electricity transmission and distribution
- Automobile and motor vehicle market
- Construction market
- Cable manufacturers
- Canada
- Cable manufacturers
7. THE SOUTH AMERICAN WIRE AND CABLE MARKET
- Argentina
- Cable manufacturers
- Brazil
- Cable manufacturers
- Chile
- Columbia
- Cable manufacturers
8. THE CENTRAL AMERICAN WIRE AND CABLE MARKET
- Mexico
- Cable manufacturers
9. THE MIDDLE EASTERN WIRE AND CABLE MARKET
- Cable manufacturers
- Saudi Arabia
- Cable Manufacturers
- Iran
- Cable manufacturers
- United Arab Emirates
- Cable manufacturers
10. THE NORTH AFRICAN WIRE AND CABLE MARKET
- Egypt
- Cable Manufacturers
11. THE SUB-SAHARAN AFRICAN WIRE AND CABLE MARKET
- Cable manufacturers
12. THE CHINESE WIRE AND CABLE MARKET
- The Chinese wire and cable market by product group
- Power cable
- Industrial market for wire and cable
- Building wire
- Auto wire and cable and harnesses
- Magnet wire and LV energy wire
- Cable Manufacturers
- Japanese wire and cable companies operating in China
- The two-tier market in China
- Counterfeits and imitations
13. THE ASIA PACIFIC (EXC CHINA) WIRE AND CABLE MARKET
- India
- End users
- Power cable
- Telecom sector
- Automotive sector
- Building wire
- Cable Manufacturers
- The leaders in the market
- Informal sector
- Counterfeit cables
- Indonesia
- End users
- Indonesia is a fast-growing economy, expected to become the 4th largest in the world by 2050
- Power sector
- Telecoms sector
- Building sector
- Auto sector
- Cable Manufacturers
- Korea
- End users
- Power sector
- Telecoms
- Building wire
- Auto sector
- Cable Manufacturers
- Japan
- End users
- Power sector
- Telecoms sector
- Building wire
- Auto sector
- Japanese wire and cable manufacturing industry
- Malaysia
- Cable Manufacturers
- Taiwan
- Cable Manufacturers
- Thailand
- Cable Manufacturers
- Vietnam
- Cable Manufacturers
14. THE CIS WIRE AND CABLE MARKET
- Cable Manufacturers
- Russia
- Cable Manufacturers
- Russian wire and cable manufacturers
15. GLOBAL WIRE AND CABLE PRODUCTION, IMPORTS, EXPORTS AND CONSUMPTION
16. CONSUMPTION OF WIRE AND CABLE BY COUNTRY
17. COPPER AND ALUMINIUM SUPPLY AND DEMAND
- Supply and demand of aluminium
- Supply and demand of copper
- Prices of copper and aluminium
18. THE APPLICATIONS AND TECHNOLOGIES OF METALLIC WIRE AND CABLE
- Power conductors and cable
- OHL Bare conductors
- Insulated cable
- Underground land-based cable (UGC)
- Subsea or submarine cables
- Telecoms cable
- Industrial wire and cable
- Winding or magnet wire
- Automotive cable
- Low Voltage cable
19. ENERGY AND COMMUNICATIONS CABLE MANUFACTURERS
20. PROFILES OF WIRE AND CABLE MANUFACTURERS
- Europe
- Prysmian
- General Cable (Prysmian)
- Nexans
- Nexans Amercable
- NKT High Voltage Cables
- Cablel-R Hellenic Cables
- JDR
- TF Kable
- Leoni
- Companies serving the HV market in Europe
- Asian companies operating in the European market
- United States
- Southwire
- Parker Scanrope
- Belden Inc
- Japanese manufacturers
- Sumitomo Electric
- Fujikura
- Furakawa
- Hitachi
- J-Power Systems (JPS)
- J-Power Systems Saudi Co, (JPS Saudi),
- Yazaki
- Korea
- LS Cables
- Taihan Electric Wire Co Ltd
- Iljin Cable
- India
- Finolex J-Power Systems Private Ltd (FJPS)
- Birla Cable Ltd
- Polycab
- Sterlite
- Chinese manufacturers
- Zhongtian Technology [ZTT]
- Ningbao Orient Cable
- TBEA Co., Ltd
- Far East Cable Co Ltd
- Wanda Group Holdings Co., Ltd,
- Baosheng High Voltage Cable Co. Ltd., BHVC
- Jiangsu Shangshang Cable Group
- Production capacity and utilisation for insulated cable
- China
- India
- Subsea cable manufacturers
21. LAND BASED UNDERGROUND CABLE
- Drivers for underground cables
- High costs
- Impact of urbanisation
- Insulated land cable in the industrial sector
22. SUBSEA ENERGY CABLES
- Interconnections and offshore wind power
- Oil & gas exploration and production
- Subsea interconnections between land areas
- Offshore wind power
- Offshore wind power market
KEY COUNTRY MARKETS FOR OFFSHORE WIND
- UK offshore wind power
- China offshore wind power
- German offshore wind power
- Netherlands offshore wind power
- Denmark offshore wind power
- Belgium offshore wind power
- Indian offshore wind power
- United States offshore wind power
- The North Sea Grid - HVDC Hubs- Grid Connection Systems
- Floating wind farms
- Offshore oil and gas, power from shore cables
- Traditional power supply for offshore oil and gas platforms
- Norwegian initiative in power supply for oil and gas platforms
- Oil and gas offshore market
- Topside cables
- Subsea communications cable networks
23. INDUSTRIAL CABLE MARKETS
- Transport - cable, wires and wiring harnesses
- Aircraft
- Shipping
- Automobiles
- Mining
- Construction
- Manufacturing and process industry
24. ELECTRIFIED RAILWAYS
- History and development
- Power delivery
- Electrified railway lengths by country
- Traction systems
- The scale of the challenge for rail transport
25. ADVANCED TECHNOLOGY, SUPERCONDUCTORS
- What is a superconductor?
- Critical Temperature
- HTS vs LTS
- Conditions required for a material to exhibit superconducting behaviour
- Current state of development of the SC market
- The discovery of superconductivity - Technical development
- Advantages of superconductor cable
- Higher current-carrying capacity
- Low impedance
- Rights-of-way
- Very low Electro Magnetic Field (EMF)
- Lower life-costs for the system
- Challenges to be overcome
- High initial cost
- Cryogenic Refrigeration System (CRS)
- Splicing of the HTS cable
- Promoters
- Future market for HTS superconductors in utilities
26. METAL THEFT
27. CABLE PROPERTIES
- Tensile strength
- Flexibility or flex ratio
- Conductivity
- Weight
- Cost
METHODOLOGY
- Definitions of conductor and cable
- Derivation of product definitions
- Report definitions
- Sizing the markets
- Forecasting demand
- Tonnage - annual volume by country
- Forecasting demand in value
- Materials - copper, aluminium, steel
- The cable market forecast model
Figures
- Figure 1: Categories of energy and communications cable, energy conductor and mechanical rope
- Figure 2: Global production of wire and cable in tonnage and demand in M$, 2000-2028
- Figure 3: Cable consumption in $ value and production in tons, compared with the copper and aluminium prices, 2000-2028
- Figure 4: The split in consumption between insulated energy cable, bare conductors, telecoms cable and industrial cable, $ million, 2000-2028
- Figure 5: Wire and cable consumption by region, $ million, 2000-2028
- Figure 6: Wire and cable production, imports, exports and consumption, $ billion, 2022
- Figure 7: Cable and conductor end-use applications, 2023
- Figure 8: Global consumption of wire and cable by product type/end use, $ billion, 2023-2028
- Figure 9: Comparison of country shares in Europe, 2020 & 2023
- Figure 10: Growth of central and distributed, in Europe, GW, 2000-2030
- Figure 11: The United States market historically, $ million, 2000-2028
- Figure 12: Annual revenue in the United States for automobiles and light duty motor vehicles, 2012-2024
- Figure 13: Construction expenditure in the United States, 1993-2024
- Figure 14: US wire and cable companies market shares, 2023
- Figure 15: Chinese consumption of wire and cable, $ billion, 2000-2028
- Figure 16: Major international trade flows of refined copper
- Figure 17: Copper and aluminium price trends, 1960 to 2028
- Figure 18: Tonnage and $ value of consumption of copper and aluminium cable and conductors, 2020-2028
- Figure 19: Cost of manufacture of cable
- Figure 20: An ACSR cable and its application
- Figure 21: The top cable manufacturers by share (52% of global production), 2023
- Figure 22: Chinese centrally planned balancing procedure for electricity
- Figure 23: Percentage of underground cable by region, 2024
- Figure 24: Percentage of underground cable in the Middle East, 2024
- Figure 25: Percentage of underground cable in Europe, 2024
- Figure 26: Percentage of underground cable in Asia Pacific, 2024
- Figure 27: Market shares of different offshore segments
- Figure 28: Value chain of subsea interconnections
- Figure 29: Cable system of a wind farm
- Figure 30: Belgium's first zone for offshore wind power
- Figure 31: Overhead line for rail traction
- Figure 32: The differences in behaviour between LTS and HTS materials
Tables
- Table 1: Types and end users of wire, cable and rope
- Table 2: Wire and cable production, imports, exports and consumption, by region, $ billion, 2022
- Table 3: Global consumption of wire and cable by product type/end use, $ billion, 2023-2008
- Table 4: European production, imports, exports and consumption of wire and cable by country, $ billion, 2022
- Table 5: European production, imports, exports and consumption shares of the wire and cable market, 2022
- Table 6: European consumption of wire and cable by country, $ billion, 2022-2028
- Table 7: European consumption of wire and cable by country, tonnage, 2022-2028
- Table 8: European consumption of wire and cable by type, $ billion, 2023-2028
- Table 9: European consumption of wire and cable by type, tonnage, 2023-2028
- Table 10: Austrian production, imports, exports and consumption of wire and cable by country, $ million, 2022
- Table 11: Austrian consumption of wire and cable by type, $ million, 2023-2028
- Table 12: Belgian production, imports, exports and consumption of wire and cable country, $ million, 2022
- Table 13: Belgium consumption of wire and cable by type, $ million, 2023-2028
- Table 14: Danish production, imports, exports and consumption of wire and cable by country, $ million, 2022
- Table 15: Danish consumption of wire and cable by type, $ million, 2023-2028
- Table 16: Finnish production, imports, exports and consumption of wire and cable by country, $ million, 2022
- Table 17: Finnish consumption of wire and cable by type, $ million, 2023-2028
- Table 18: French production, imports, exports and consumption of wire and cable by country, $ million, 2022
- Table 19: French consumption of wire and cable by type, $ million, 2023-2028
- Cable 20: Leading French wire and cable manufacturers
- Table 21: German production, imports, exports and consumption of wire and cable by country, $ million, 2022
- Table 22: German consumption of wire and cable by type, $ million, 2023-2028
- Table 23: Leading German wire and cable manufacturers
- Table 24: Greek production, imports, exports and consumption of wire and cable by country, $ million, 2022
- Table 25: Greek consumption of wire and cable by type, $ million, 2023-2028
- Table 26: Irish production, imports, exports and consumption of wire and cable by country, $ million, 2022
- Table 27: Irish consumption of wire and cable by type, $ million, 2023-2028
- Table 28: Italian production, imports, exports and consumption of wire and cable by country, $ million, 2022
- Table 29: Italian consumption of wire and cable by type, $ million, 2023-2028
- Table 30: Leading Italian wire and cable manufacturers
- Table 31: Dutch production, imports, exports and consumption of wire and cable by country, $ million, 2022
- Table 32: Dutch consumption of wire and cable by type, $ million, 2023-2028
- Table 33: Norwegian production, imports, exports and consumption of wire and cable by country, $ million, 2022
- Table 34: Norwegian consumption of wire and cable by type, $ million, 2023-2028
- Table 35: Polish production, imports, exports and consumption of wire and cable by country, $ million, 2022
- Table 36: Polish consumption of wire and cable by type, $ million, 2023-2028
- Table 37: Leading Polish wire and cable manufacturers
- Table 38: Spanish production, imports, exports and consumption of wire and cable by country, $ million, 2022
- Table 39: Spanish consumption of wire and cable by type, $ million, 2023-2028
- Table 40: Leading Spanish wire and cable manufacturers
- Table 41: Swedish production, imports, exports and consumption of wire and cable by country, $ million, 2022
- Table 42: Swedish consumption of wire and cable by type, $ million, 2023-2028
- Table 43: Leading Swedish wire and cable manufacturers
- Table 44: Turkish production, imports, exports and consumption of wire and cable country, $ million, 2022
- Table 45: Turkish consumption of wire and cable by type, $ million, 2023-2028
- Table 46: Leading Turkish wire and cable manufacturers
- Table 47: British production, imports, exports and consumption of wire and cable by country, $ million, 2022
- Table 48: British consumption of wire and cable by type, $ million, 2023-2028
- Table 49: Leading UK cable manufacturers
- Table 50: North American production, imports, exports and consumption of wire and cable by country, $ million, 2022
- Table 51: North American consumption of wire and cable by type, $ million, 2023-2028
- Table 52: US production, imports, exports and consumption of wire and cable by country, $ million, 2022
- Table 53: US consumption of wire and cable by type, $ million, 2023-2028
- Table 54: Canadian production, imports, exports and consumption of wire and cable by country, $ million, 2022
- Table 55: Canadian consumption of wire and cable by type, $ million, 2023-2028
- Table 56: Leading Canadian wire and cable manufacturers
- Table 57: production, imports, exports and consumption of wire and cable by country, $ billion, 2022
- Table 58: South American consumption of wire and cable by type, $ million, 2023-2028
- Table 59: Argentinian production, imports, exports and consumption of wire and cable by country, $ billion, 2022
- Table 60: Argentinian consumption of wire and cable by type, $ million, 2023-2028
- Table 61: Leading Argentinian wire and cable manufacturers
- Table 62: Brazilian production, imports, exports and consumption of wire and cable by country, $ billion, 2022
- Table 63: Brazilian consumption of wire and cable by type, $ million, 2023-2028
- Table 64: Leading Brazilian wire and cable manufacturers
- Table 65: Chilian production, imports, exports and consumption of wire and cable by country, $ billion, 2022
- Table 66: Chilian consumption of wire and cable by type, $ million, 2023-2028
- Table 67: Columbian production, imports, exports and consumption of wire and cable by country, $ billion, 2022
- Table 68: Columbian consumption of wire and cable by type, $ million, 2023-2028
- Table 69: Leading Columbian wire and cable manufacturers
- Table 70: production, imports, exports and consumption of wire and cable by country, $ billion, 2022
- Table 71: Central American consumption of wire and cable by type, $ million, 2023-2028
- Table 72: Mexican production, imports, exports and consumption of wire and cable by country, $ billion, 2022
- Table 73: Mexican consumption of wire and cable by type, $ million, 2023-2028
- Table 74: Leading Mexican wire and cable manufacturers
- Table 75: Middle Eastern production, imports, exports and consumption of wire and cable by country, $ billion, 2022
- Table 76: Middle Eastern consumption of wire and cable by type, $ million, 2023-2028
- Table 77: Saudi Arabian production, imports, exports and consumption of wire and cable by country, $ billion, 2022
- Table 78: Saudi Arabian consumption of wire and cable by type, $ million, 2023-2028
- Table 79: Leading Saudi Arabian wire and cable companies
- Table 80: Iranian production, imports, exports and consumption of wire and cable country, $ billion, 2022
- Table 81: Iranian consumption of wire and cable by type, $ million, 2023-2028
- Table 82: Leading Iranian wire and cable manufacturers
- Table 83: UAE production, imports, exports and consumption of wire and cable by country, $ billion, 2022
- Table 84: UAE consumption of wire and cable by type, $ million, 2023-2028
- Table 85: Leading UAE wire and cable manufacturers
- Table 86: North African production, imports, exports and consumption of wire and cable by country, $ billion, 2022
- Table 87: North African consumption of wire and cable by type, $ million, 2023-2028
- Table 88: Egyptian production, imports, exports and consumption of wire and cable by country, $ billion, 2022
- Table 89: Egyptian consumption of wire and cable by type, $ million, 2023-2028
- Table 90: Sub-Saharan African production, imports, exports and consumption of wire and cable by country, $ billion, 2022
- Table 91: Sub-Saharan African consumption of wire and cable by type, $ million, 2023-2028
- Table 92: Chinese production, imports, exports and consumption of wire and cable by country, $ billion, 2022
- Table 93: Chinese consumption of wire and cable by type, $ million, 2023-2028
- Table 94: Leading Chinese wire and cable manufacturers
- Table 95: Asia Pacific production, imports, exports and consumption of wire and cable by country, $ billion, 2022
- Table 96: Asia Pacific consumption of wire and cable by type, $ million, 2023-2028
- Table 97: Indian production, imports, exports and consumption of wire and cable by country, $ billion, 2022
- Table 98: Indian consumption of wire and cable, $ billion, 2000-2028
- Table 99: Indian consumption of wire and cable by type, $ million, 2023-2028
- Table 100: Leading Indian wire and cable manufacturers
- Table 101: Indonesian production, imports, exports and consumption of wire and cable by country, $ billion, 2022
- Table 102: Indonesian consumption of wire and cable by type, $ million, 2023-2028
- Table 103: Leading Indonesian wire and cable manufacturers
- Table 104: Korean production, imports, exports and consumption of wire and cable by country, $ billion, 2022
- Table 105: Korean consumption of wire and cable by type, $ million, 2023-2028
- Table 106: Leading Korean wire and cable manufacturers
- Table 107: Japanese production, imports, exports and consumption of wire and cable by country, $ billion, 2022
- Table 108: Japanese consumption of wire and cable by type, $ million, 2023-2028
- Table 109: Japanese wire and cable companies
- Table 110: Malaysian production, imports, exports and consumption of wire and cable by country, $ billion, 2022
- Table 111: Malaysian consumption of wire and cable by type, $ million, 2023-2028
- Table 112: Leading Malaysian wire and cable manufacturers
- Table 113: Taiwanese production, imports, exports and consumption of wire and cable by country, $ billion, 2022
- Table 114: Taiwanese consumption of wire and cable by type, $ million, 2023-2028
- Table 115: Thai production, imports, exports and consumption of wire and cable by country, $ billion, 2022
- Table 116: Thai consumption of wire and cable by type, $ million, 2023-2028
- Table 117: Leading Thai wire and cable manufacturers
- Table 118: Vietnamese production, imports, exports and consumption of wire and cable by country, $ billion, 2022
- Table 119: Vietnamese consumption of wire and cable by type, $ million, 2023-2028
- Table 120: Leading Vietnamese wire and cable manufacturers
- Table 121: CIS production, imports, exports and consumption of wire and cable by country, $ billion, 2022
- Table 122: CIS consumption of wire and cable by type, $ million, 2023-2028
- Table 123: Russian production, imports, exports and consumption of wire and cable by country, $ billion, 2022
- Table 124: Russian consumption of wire and cable by type, $ million, 2023-2028
- Table 125: Summary of insulated wire and cable production, imports, exports and consumption by region and country, $ billion, 2022
- Table 126: Consumption of wire and cable by region by country, in $ value, 2023-2028
- Table 127: The top cable manufacturers by share of global production, 2023
- Table 128: Average global cable production utilisation rates by voltage, 2000-2024
- Table 129: Companies producing subsea cable
- Table 130: List of countries by cumulative installed offshore wind power capacity (MW), 2016-2023
- Table 131: Electrified railways throughout the world, 2023
- Table 132: Installed superconductors
- Table 133: Superconductor manufacturers
- Table 134: Tensile strength of selected materials
- Table 135: Average conductivity of metals
- Table 136: Report production definitions
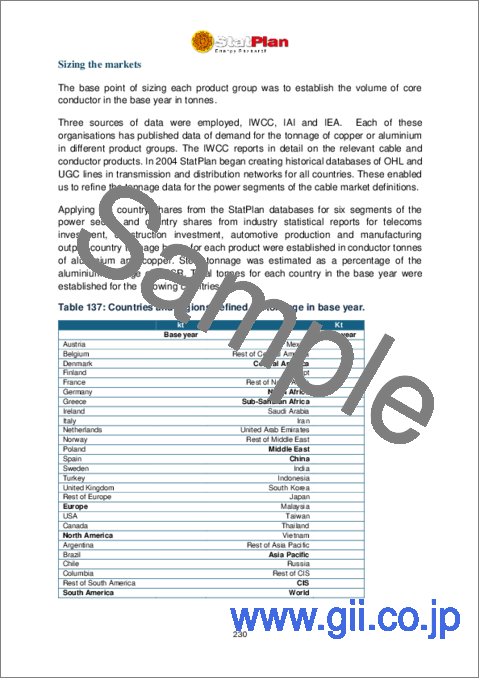
- Table 137: Countries and regions defined for tonnage in base year
- Table 138: Forecast model for each country and region
