|
|
市場調査レポート
商品コード
1679261
自家発電市場の2030年までの予測:燃料タイプ、発電所タイプ、技術、用途、エンドユーザー、地域別の世界分析Captive Power Generation Market Forecasts to 2030 - Global Analysis By Fuel Type (Coal, Natural Gas, Diesel, Oil, Solar, Wind, Biomass and Other Fuel Types), Power Plant Type, Technology, Application, End User and By Geography |
||||||
カスタマイズ可能
|
|||||||
| 自家発電市場の2030年までの予測:燃料タイプ、発電所タイプ、技術、用途、エンドユーザー、地域別の世界分析 |
|
出版日: 2025年03月03日
発行: Stratistics Market Research Consulting
ページ情報: 英文 200+ Pages
納期: 2~3営業日
|
全表示
- 概要
- 図表
- 目次
Stratistics MRCによると、世界の自家発電市場は2024年に6,096億米ドルを占め、2030年までにはCAGR6.2%で成長し、8,746億米ドルに達すると予測されています。
自家発電とは、送電網に売電するのではなく、主に自社で使用するために企業や組織が電力を生産することです。この種の発電は通常、産業運営や製造プロセスなど、企業の内部ニーズを満たすエネルギーを供給する専用発電所の設立を伴う。自家発電には、エネルギー安全保障の向上、コスト削減、外部エネルギー源への依存度の低減といった利点があります。
世界銀行のデータによると、2020年から2022年にかけて、インドの年間電力消費量は前年比5%以上増加しました。国連環境計画によると、2015年から2020年にかけて、あらゆる用途におけるエネルギー貯蔵の導入は毎年25%以上増加しています。
電力需要の増加
市場における電力需要の高まりは、信頼性が高く、費用対効果の高いエネルギー・ソリューションを求める産業界のニーズに後押しされています。エネルギー消費量の増加に伴い、企業は安定した電力供給を確保するため、外部送電網への依存を減らし、停電を最小限に抑えるため、自家発電所を利用する傾向が強まっています。この動向は、製造業、鉱業、化学などのエネルギー多消費セクターで特に顕著であり、エネルギーコストを抑制しながら操業を維持し、全体的な生産性を向上させるためには、中断のない電力が不可欠です。
送電網の接続性と規制
市場における送電網の接続性と規制は、事業の柔軟性と収益性を制限することによって悪影響を及ぼす可能性があります。厳しい規制はしばしば高いコンプライアンス・コストを課し、キャプティブ・プラントの規模を制限するため、産業が最適な効率で操業することを困難にします。さらに、系統連系は、バックアップを外部系統に依存する可能性があるため、独立発電に投資する企業のインセンティブを低下させ、キャプティブ発電システムによって提供される潜在的なコスト削減とエネルギー安全性を低下させる可能性があります。
無停電電源の必要性
市場における中断のない電力供給の必要性は、継続的な操業に依存する産業にとって不可欠です。製造業、鉱業、化学などの分野では、生産の遅れ、機器の故障、経済的損失を避けるために安定した電力が必要です。自家発電は、専用の安定したエネルギー源を確保し、送電網の故障やエネルギーコストの変動に対する脆弱性を軽減します。この信頼性により、操業効率が向上し、エネルギー依存度が高まる世界で競合優位性を維持できるようになります。
高い初期投資コスト
市場の初期投資コストの高さは、多くの企業、特に中小企業にとって大きな障壁となる可能性があります。専用発電所の設置、機器の購入、システムの統合に必要な資本は、法外に高額な場合があります。この経済的負担は、企業がキャプティブ・パワー・ソリューションを採用する意欲を削ぎ、長期的なコスト削減とエネルギー自立を達成する能力を制限する可能性があります。さらに、投資回収が実現するまでに数年かかる可能性があり、潜在的な投資家の意欲をさらにそぐことになります。
COVID-19の影響:
COVID-19の大流行は、サプライチェーンの混乱、プロジェクトの遅延、工場の操業停止や景気減速による産業需要の減少によって、市場に大きな影響を与えました。多くの企業が財務上の不安に直面し、キャプティブ・パワー・システムへの投資の延期や中止を余儀なくされました。その一方で、一部の産業、特に基幹産業は、信頼性の高い自給自足の電力供給の重要性を認識し、将来の事業の継続性を確保するために、独立したエネルギー・ソリューションへの投資へと長期的なシフトを促しました。
予測期間中、天然ガス・セグメントが最大の市場シェアを占める見込み
予測期間中、最大の市場シェアを占めると予想されるのは天然ガス・セグメントです。天然ガスは、環境負荷を低減しながら電力需要を満たそうとする産業界に、信頼性と柔軟性に優れたエネルギー源を提供します。また、天然ガス焚きキャプティブ発電所は起動が早く、製造や化学のようなエネルギー集約型部門に継続的で安定した電力を供給することができます。よりクリーンなエネルギーへの需要が高まる中、天然ガスは引き続きこの市場で重要な役割を果たしています。
予測期間中、商業用セグメントのCAGRが最も高くなる見込み
予測期間中、商業セグメントが最も高い成長率を示すと予測されます。専用の発電所を設置することで、オフィス、小売チェーン、サービスプロバイダーなどの商業企業は、中断のない電力供給を確保し、信頼性の低い送電網への依存を減らし、エネルギーコストの上昇を抑制することができます。自家発電は、エネルギー安全保障の強化、ニーズに合わせたエネルギー使用、光熱費の節約の可能性を可能にし、業務効率と持続可能性の向上を目指す企業にとって魅力的な選択肢となります。
最大のシェアを占める地域:
予測期間中、北米地域が最大の市場シェアを占めると予想されます。エネルギーコストの削減と持続可能性の向上に重点を置く製造業、鉱業、化学などの分野では、キャプティブ・パワー・システムへの投資が増加しています。同地域では、よりクリーンな代替エネルギーの推進も、キャプティブ発電所における天然ガスや太陽光・風力などの再生可能エネルギー源の採用を促進しています。規制の枠組みや技術の進歩は、市場の拡大にさらに拍車をかけています。
CAGRが最も高い地域:
予測期間中、アジア太平洋地域が最も高いCAGRを示すと予想されます。中国やインドのような国々の急速な産業成長はエネルギー需要を大幅に増加させ、産業界は信頼性が高く中断のない電力供給を確保するために自家発電への投資を促しています。さらに、この地域の政府は、有利な政策やインセンティブを通じて自家発電プロジェクトを推進し、産業界に自家発電ソリューションの採用を促しています。
無料のカスタマイズサービス
本レポートをご購読のお客様には、以下の無料カスタマイズオプションのいずれかをご利用いただけます:
- 企業プロファイル
- 追加市場企業の包括的プロファイリング(3社まで)
- 主要企業のSWOT分析(3社まで)
- 地域セグメンテーション
- 顧客の関心に応じた主要国の市場推計・予測・CAGR(注:フィージビリティチェックによる)
- 競合ベンチマーキング
- 製品ポートフォリオ、地理的プレゼンス、戦略的提携に基づく主要企業のベンチマーキング
目次
第1章 エグゼクティブサマリー
第2章 序文
- 概要
- ステークホルダー
- 調査範囲
- 調査手法
- データマイニング
- データ分析
- データ検証
- 調査アプローチ
- 調査情報源
- 1次調査情報源
- 2次調査情報源
- 前提条件
第3章 市場動向分析
- 促進要因
- 抑制要因
- 機会
- 脅威
- 技術分析
- 用途分析
- エンドユーザー分析
- 新興市場
- COVID-19の影響
第4章 ポーターのファイブフォース分析
- 供給企業の交渉力
- 買い手の交渉力
- 代替品の脅威
- 新規参入業者の脅威
- 競争企業間の敵対関係
第5章 世界の自家発電市場:燃料タイプ別
- 石炭
- 天然ガス
- ディーゼル
- オイル
- 太陽
- 風
- バイオマス
- その他の燃料タイプ
第6章 世界の自家発電市場:発電所タイプ別
- 熱電併給(CHP)システム
- 独立発電所
- ガスタービンおよび複合サイクル発電所
第7章 世界の自家発電市場:技術別
- 火力発電
- 再生可能エネルギー
- 廃棄物エネルギー(WTE)
- 燃料電池
- バッテリーエネルギー貯蔵システム(BESS)
第8章 世界の自家発電市場:用途別
- セメント産業
- 発電所
- データセンター
- 石油化学製品
- 大型ショッピングモール
- その他の用途
第9章 世界の自家発電市場:エンドユーザー別
- 農業
- コマーシャル
- 交通機関
- 住宅
- 鉱業
- 製造業
- その他のエンドユーザー
第10章 世界の自家発電市場:地域別
- 北米
- 米国
- カナダ
- メキシコ
- 欧州
- ドイツ
- 英国
- イタリア
- フランス
- スペイン
- その他の欧州
- アジア太平洋
- 日本
- 中国
- インド
- オーストラリア
- ニュージーランド
- 韓国
- その他のアジア太平洋
- 南米
- アルゼンチン
- ブラジル
- チリ
- その他の南米
- 中東・アフリカ
- サウジアラビア
- アラブ首長国連邦
- カタール
- 南アフリカ
- その他の中東・アフリカ
第11章 主な発展
- 契約、パートナーシップ、コラボレーション、合弁事業
- 買収と合併
- 新製品発売
- 事業拡大
- その他の主要戦略
第12章 企業プロファイリング
- GE Power
- Siemens Energy
- Caterpillar Inc.
- Cummins Inc.
- Schneider Electric
- Wartsila Corporation
- Rolls-Royce Power Systems
- Mitsubishi Power
- Doosan Heavy Industries & Construction
- Bharat Heavy Electricals Limited(BHEL)
- ABB Ltd.
- Adani Power
- MAN Energy Solutions
- China National Petroleum Corporation(CNPC)
- Enel Green Power
List of Tables
- Table 1 Global Captive Power Generation Market Outlook, By Region (2022-2030) ($MN)
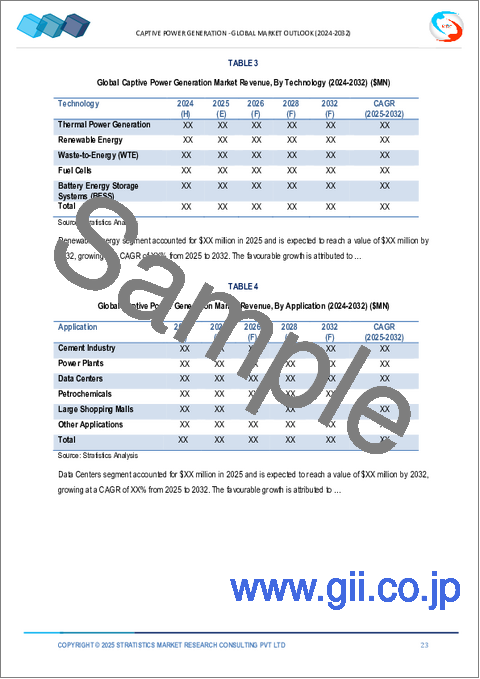
- Table 2 Global Captive Power Generation Market Outlook, By Fuel Type (2022-2030) ($MN)
- Table 3 Global Captive Power Generation Market Outlook, By Coal (2022-2030) ($MN)
- Table 4 Global Captive Power Generation Market Outlook, By Natural Gas (2022-2030) ($MN)
- Table 5 Global Captive Power Generation Market Outlook, By Diesel (2022-2030) ($MN)
- Table 6 Global Captive Power Generation Market Outlook, By Oil (2022-2030) ($MN)
- Table 7 Global Captive Power Generation Market Outlook, By Solar (2022-2030) ($MN)
- Table 8 Global Captive Power Generation Market Outlook, By Wind (2022-2030) ($MN)
- Table 9 Global Captive Power Generation Market Outlook, By Biomass (2022-2030) ($MN)
- Table 10 Global Captive Power Generation Market Outlook, By Other Fuel Types (2022-2030) ($MN)
- Table 11 Global Captive Power Generation Market Outlook, By Power Plant Type (2022-2030) ($MN)
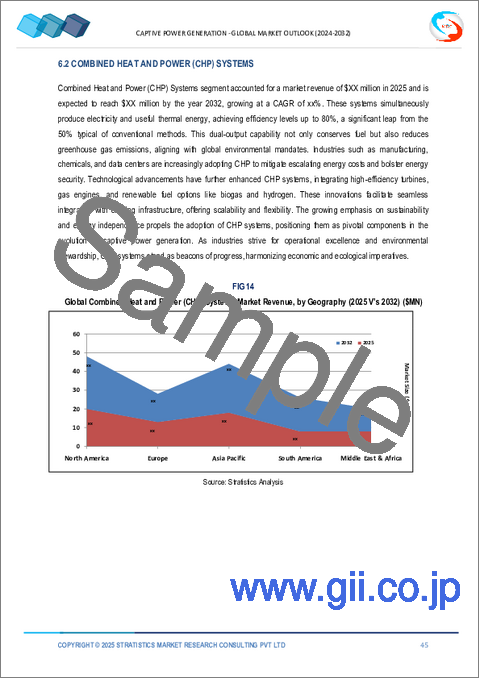
- Table 12 Global Captive Power Generation Market Outlook, By Combined Heat and Power (CHP) Systems (2022-2030) ($MN)
- Table 13 Global Captive Power Generation Market Outlook, By Standalone Power Plants (2022-2030) ($MN)
- Table 14 Global Captive Power Generation Market Outlook, By Gas Turbine and Combined Cycle Plants (2022-2030) ($MN)
- Table 15 Global Captive Power Generation Market Outlook, By Technology (2022-2030) ($MN)
- Table 16 Global Captive Power Generation Market Outlook, By Thermal Power Generation (2022-2030) ($MN)
- Table 17 Global Captive Power Generation Market Outlook, By Renewable Energy (2022-2030) ($MN)
- Table 18 Global Captive Power Generation Market Outlook, By Waste-to-Energy (WTE) (2022-2030) ($MN)
- Table 19 Global Captive Power Generation Market Outlook, By Fuel Cells (2022-2030) ($MN)
- Table 20 Global Captive Power Generation Market Outlook, By Battery Energy Storage Systems (BESS) (2022-2030) ($MN)
- Table 21 Global Captive Power Generation Market Outlook, By Application (2022-2030) ($MN)
- Table 22 Global Captive Power Generation Market Outlook, By Cement Industry (2022-2030) ($MN)
- Table 23 Global Captive Power Generation Market Outlook, By Power Plants (2022-2030) ($MN)
- Table 24 Global Captive Power Generation Market Outlook, By Data Centers (2022-2030) ($MN)
- Table 25 Global Captive Power Generation Market Outlook, By Petrochemicals (2022-2030) ($MN)
- Table 26 Global Captive Power Generation Market Outlook, By Large Shopping Malls (2022-2030) ($MN)
- Table 27 Global Captive Power Generation Market Outlook, By Other Applications (2022-2030) ($MN)
- Table 28 Global Captive Power Generation Market Outlook, By End User (2022-2030) ($MN)
- Table 29 Global Captive Power Generation Market Outlook, By Agriculture (2022-2030) ($MN)
- Table 30 Global Captive Power Generation Market Outlook, By Commercial (2022-2030) ($MN)
- Table 31 Global Captive Power Generation Market Outlook, By Transportation (2022-2030) ($MN)
- Table 32 Global Captive Power Generation Market Outlook, By Residential (2022-2030) ($MN)
- Table 33 Global Captive Power Generation Market Outlook, By Mining (2022-2030) ($MN)
- Table 34 Global Captive Power Generation Market Outlook, By Manufacturing (2022-2030) ($MN)
- Table 35 Global Captive Power Generation Market Outlook, By Other End Users (2022-2030) ($MN)
Note: Tables for North America, Europe, APAC, South America, and Middle East & Africa Regions are also represented in the same manner as above.
According to Stratistics MRC, the Global Captive Power Generation Market is accounted for $609.6 billion in 2024 and is expected to reach $874.6 billion by 2030 growing at a CAGR of 6.2% during the forecast period. Captive power generation is the production of electricity by a company or organization primarily for its own use, rather than for sale to the grid. This type of generation typically involves the establishment of dedicated power plants that supply energy to meet the internal needs of the company, such as for industrial operations or manufacturing processes. Captive power generation offers advantages like improved energy security, cost savings, and reduced dependence on external energy sources, especially in regions with unreliable or expensive power supply.
According to data by World Bank, between 2020-2022, India's annual electricity consumption grew by over 5% year-on-year. According to the United Nations Environment Programme, energy storage deployments across all applications grew by over 25% annually between 2015 and 2020.
Market Dynamics:
Driver:
Increasing demand for electricity
The growing demand for electricity in the market is fueled by industries' need for reliable, cost-effective energy solutions. As energy consumption rises, businesses increasingly turn to captive power plants to ensure a consistent electricity supply, reducing dependence on external grids and minimizing power outages. This trend is particularly noticeable in energy-intensive sectors such as manufacturing, mining, and chemicals, where uninterrupted power is crucial for maintaining operations and improving overall productivity while controlling energy costs.
Restraint:
Grid connectivity and regulations
Grid connectivity and regulations in the market can have negative effects by limiting the flexibility and profitability of businesses. Stringent regulations often impose high compliance costs and restrict the scale of captive plants, making it difficult for industries to operate at optimal efficiency. Additionally, grid connectivity can reduce the incentive for companies to invest in independent power generation, as they might rely on the external grid for backup, diminishing the potential cost savings and energy security offered by captive power systems.
Opportunity:
Need for uninterrupted power supply
The need for an uninterrupted power supply in the market is essential for industries that rely on continuous operations. Sectors like manufacturing, mining, and chemicals require stable electricity to avoid production delays, equipment malfunctions, and financial losses. Captive power generation ensures a dedicated, consistent energy source, reducing vulnerability to grid failures or fluctuating energy costs. This reliability boosts operational efficiencyand supports businesses in maintaining their competitive edge in an increasingly energy-dependent world.
Threat:
High initial investment costs
High initial investment costs in the market can be a significant barrier for many companies, especially small and medium-sized enterprises. The capital required to set up dedicated power plants, purchase equipment, and integrate systems can be prohibitively expensive. This financial burden may discourage businesses from adopting captive power solutions, limiting their ability to achieve long-term cost savings and energy independence. Additionally, the return on investment may take years to materialize, further deterring potential investors.
Covid-19 Impact:
The COVID-19 pandemic significantly impacted the market by disrupting supply chains, delaying projects, and reducing industrial demand due to factory shutdowns and economic slowdowns. Many businesses faced financial uncertainty, leading to postponed or canceled investments in captive power systems. On the other hand, some industries, particularly those in essential sectors, realized the importance of reliable, self-sufficient power supply, prompting a long-term shift towards investing in independent energy solutions to ensure continuity in future operations.
The natural gas segment is expected to be the largest market share during the forecast period
The natural gas segment is expected to account for the largest market share during the forecast period. It offers a reliable, flexible energy source for industries seeking to meet their power needs while reducing environmental impact. Natural gas-fired captive power plants are also quicker to start up and can provide continuous, stable electricity for energy-intensive sectors like manufacturing and chemicals. As demand for cleaner energy grows, natural gas continues to play a crucial role in this market.
The commercial segment is expected to have the highest CAGR during the forecast period
Over the forecast period, the commercial segment is predicted to witness the highest growth rate. By setting up dedicated power plants, commercial enterprises, including offices, retail chains, and service providers, can ensure uninterrupted electricity supply, reduce dependency on unreliable grids, and control rising energy costs. Captive power generation allows for greater energy security, tailored energy use, and potential savings on utility bills, making it an attractive option for businesses looking to enhance operational efficiency and sustainability.
Region with largest share:
During the forecast period, the North America region is expected to hold the largest market share. With a focus on reducing energy costs and improving sustainability, sectors such as manufacturing, mining, and chemicals are increasingly investing in captive power systems. The region's push for cleaner energy alternatives also promotes the adoption of natural gas and renewable sources like solar and wind in captive plants. Regulatory frameworks and technological advancements further fuel market expansion.
Region with highest CAGR:
Over the forecast period, the Asia Pacific region is anticipated to exhibit the highest CAGR. The rapid industrial growth in countries like China and India has significantly increased energy demand, prompting industries to invest in captive power generation to ensure a reliable and uninterrupted power supply. Futhermore, governments across the region are promoting captive power projects through favorable policies and incentives, encouraging industries to adopt self-generation solutions.
Key players in the market
Some of the key players in Captive Power Generation market include GE Power, Siemens Energy, Caterpillar Inc., Cummins Inc., Schneider Electric, Wartsila Corporation, Rolls-Royce Power Systems, Mitsubishi Power, Doosan Heavy Industries & Construction, Bharat Heavy Electricals Limited (BHEL), ABB Ltd., Adani Power, MAN Energy Solutions, China National Petroleum Corporation (CNPC) and Enel Green Power.
Key Developments:
In July 2024, Siemens AG and Boson Energy have signed a Memorandum of Understanding (MoU) to facilitate collaboration on technology that converts non-recyclable waste into clean energy. The collaboration aims to advance sustainable, local energy security, enabling hydrogen-powered electric vehicle charging infrastructure without compromising grid stability or impacting consumer prices. .
In January 2024, GE Vernova and IHI announce next phase of the technology roadmap aiming to develop a 100% ammonia capable gas turbine combustion system by 2030. This agreement is a development on the heels of earlier MOUs between the companies.
Fuel Types Covered:
- Coal
- Natural Gas
- Diesel
- Oil
- Solar
- Wind
- Biomass
- Other Fuel Types
Power Plant Types Covered:
- Combined Heat and Power (CHP) Systems
- Standalone Power Plants
- Gas Turbine and Combined Cycle Plants
Technologies Covered:
- Thermal Power Generation
- Renewable Energy
- Waste-to-Energy (WTE)
- Fuel Cells
- Battery Energy Storage Systems (BESS)
Applications Covered:
- Cement Industry
- Power Plants
- Data Centers
- Petrochemicals
- Large Shopping Malls
- Other Applications
End Users Covered:
- Agriculture
- Commercial
- Transportation
- Residential
- Mining
- Manufacturing
- Other End Users
Regions Covered:
- North America
- US
- Canada
- Mexico
- Europe
- Germany
- UK
- Italy
- France
- Spain
- Rest of Europe
- Asia Pacific
- Japan
- China
- India
- Australia
- New Zealand
- South Korea
- Rest of Asia Pacific
- South America
- Argentina
- Brazil
- Chile
- Rest of South America
- Middle East & Africa
- Saudi Arabia
- UAE
- Qatar
- South Africa
- Rest of Middle East & Africa
What our report offers:
- Market share assessments for the regional and country-level segments
- Strategic recommendations for the new entrants
- Covers Market data for the years 2022, 2023, 2024, 2026, and 2030
- Market Trends (Drivers, Constraints, Opportunities, Threats, Challenges, Investment Opportunities, and recommendations)
- Strategic recommendations in key business segments based on the market estimations
- Competitive landscaping mapping the key common trends
- Company profiling with detailed strategies, financials, and recent developments
- Supply chain trends mapping the latest technological advancements
Free Customization Offerings:
All the customers of this report will be entitled to receive one of the following free customization options:
- Company Profiling
- Comprehensive profiling of additional market players (up to 3)
- SWOT Analysis of key players (up to 3)
- Regional Segmentation
- Market estimations, Forecasts and CAGR of any prominent country as per the client's interest (Note: Depends on feasibility check)
- Competitive Benchmarking
- Benchmarking of key players based on product portfolio, geographical presence, and strategic alliances
Table of Contents
1 Executive Summary
2 Preface
- 2.1 Abstract
- 2.2 Stake Holders
- 2.3 Research Scope
- 2.4 Research Methodology
- 2.4.1 Data Mining
- 2.4.2 Data Analysis
- 2.4.3 Data Validation
- 2.4.4 Research Approach
- 2.5 Research Sources
- 2.5.1 Primary Research Sources
- 2.5.2 Secondary Research Sources
- 2.5.3 Assumptions
3 Market Trend Analysis
- 3.1 Introduction
- 3.2 Drivers
- 3.3 Restraints
- 3.4 Opportunities
- 3.5 Threats
- 3.6 Technology Analysis
- 3.7 Application Analysis
- 3.8 End User Analysis
- 3.9 Emerging Markets
- 3.10 Impact of Covid-19
4 Porters Five Force Analysis
- 4.1 Bargaining power of suppliers
- 4.2 Bargaining power of buyers
- 4.3 Threat of substitutes
- 4.4 Threat of new entrants
- 4.5 Competitive rivalry
5 Global Captive Power Generation Market, By Fuel Type
- 5.1 Introduction
- 5.2 Coal
- 5.3 Natural Gas
- 5.4 Diesel
- 5.5 Oil
- 5.6 Solar
- 5.7 Wind
- 5.8 Biomass
- 5.9 Other Fuel Types
6 Global Captive Power Generation Market, By Power Plant Type
- 6.1 Introduction
- 6.2 Combined Heat and Power (CHP) Systems
- 6.3 Standalone Power Plants
- 6.4 Gas Turbine and Combined Cycle Plants
7 Global Captive Power Generation Market, By Technology
- 7.1 Introduction
- 7.2 Thermal Power Generation
- 7.3 Renewable Energy
- 7.4 Waste-to-Energy (WTE)
- 7.5 Fuel Cells
- 7.6 Battery Energy Storage Systems (BESS)
8 Global Captive Power Generation Market, By Application
- 8.1 Introduction
- 8.2 Cement Industry
- 8.3 Power Plants
- 8.4 Data Centers
- 8.5 Petrochemicals
- 8.6 Large Shopping Malls
- 8.7 Other Applications
9 Global Captive Power Generation Market, By End User
- 9.1 Introduction
- 9.2 Agriculture
- 9.3 Commercial
- 9.4 Transportation
- 9.5 Residential
- 9.6 Mining
- 9.7 Manufacturing
- 9.9 Other End Users
10 Global Captive Power Generation Market, By Geography
- 10.1 Introduction
- 10.2 North America
- 10.2.1 US
- 10.2.2 Canada
- 10.2.3 Mexico
- 10.3 Europe
- 10.3.1 Germany
- 10.3.2 UK
- 10.3.3 Italy
- 10.3.4 France
- 10.3.5 Spain
- 10.3.6 Rest of Europe
- 10.4 Asia Pacific
- 10.4.1 Japan
- 10.4.2 China
- 10.4.3 India
- 10.4.4 Australia
- 10.4.5 New Zealand
- 10.4.6 South Korea
- 10.4.7 Rest of Asia Pacific
- 10.5 South America
- 10.5.1 Argentina
- 10.5.2 Brazil
- 10.5.3 Chile
- 10.5.4 Rest of South America
- 10.6 Middle East & Africa
- 10.6.1 Saudi Arabia
- 10.6.2 UAE
- 10.6.3 Qatar
- 10.6.4 South Africa
- 10.6.5 Rest of Middle East & Africa
11 Key Developments
- 11.1 Agreements, Partnerships, Collaborations and Joint Ventures
- 11.2 Acquisitions & Mergers
- 11.3 New Product Launch
- 11.4 Expansions
- 11.5 Other Key Strategies
12 Company Profiling
- 12.1 GE Power
- 12.2 Siemens Energy
- 12.3 Caterpillar Inc.
- 12.4 Cummins Inc.
- 12.5 Schneider Electric
- 12.6 Wartsila Corporation
- 12.7 Rolls-Royce Power Systems
- 12.8 Mitsubishi Power
- 12.9 Doosan Heavy Industries & Construction
- 12.10 Bharat Heavy Electricals Limited (BHEL)
- 12.11 ABB Ltd.
- 12.12 Adani Power
- 12.13 MAN Energy Solutions
- 12.14 China National Petroleum Corporation (CNPC)
- 12.15 Enel Green Power


