|
|
市場調査レポート
商品コード
1587693
発電用CCS(炭素回収・貯留)市場の2030年までの予測: 技術別、用途別、地域別の世界分析Power Generation Carbon Capture and Storage Market Forecasts to 2030 - Global Analysis By Technology, Application and By Geography |
||||||
|
|||||||
カスタマイズ可能
|
|||||||

| 発電用CCS(炭素回収・貯留)市場の2030年までの予測: 技術別、用途別、地域別の世界分析 |
|
出版日: 2024年11月11日
発行: Stratistics Market Research Consulting
ページ情報: 英文 200+ Pages
納期: 2~3営業日
|

全表示
- 概要
- 図表
- 目次
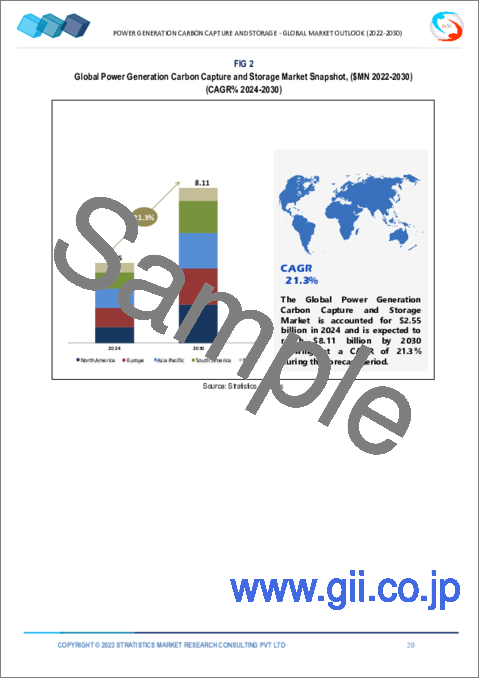
Stratistics MRCによると、世界の発電用CCS(炭素回収・貯留)市場は2024年に25億5,000万米ドルを占め、2030年には81億1,000万米ドルに達すると予測され、予測期間中のCAGRは21.3%で成長する見込みです。
発電用CCS(炭素回収・貯留)(CCS)は、発電所、特に化石燃料を燃焼する発電所からの温室効果ガス排出を削減することを目的とした技術です。このプロセスには、発電時に発生する二酸化炭素(CO2)を回収し、回収したCO2を貯蔵場所に運び、大気中への放出を防ぐために地下に安全に貯蔵するという3つの主要ステップが含まれます。CCSは、石炭や天然ガス発電所の環境への影響を大幅に緩和し、低炭素エネルギーの未来への移行を支援することができます。二酸化炭素排出量を最小限に抑えながら化石燃料の継続利用を可能にするCCSは、気候変動と闘う取り組みにおいて重要な役割を果たしています。
気候変動に対する国民の関心の高まり
気候変動に対する社会的関心の高まりは、発電用CCS(炭素回収・貯留)技術の進歩を大きく後押ししています。温室効果ガスの排出削減が急務であるとの認識が高まるにつれ、化石燃料によるエネルギー生産が環境に与える影響を緩和する有効な解決策として、政府や産業界はCCSへの投資を増やしています。CCS技術は、発電所から排出される二酸化炭素を大気中に放出する前に回収するもので、既存のインフラを活用しながら、よりクリーンなエネルギー源への転換を可能にします。この転換は、世界の気候変動目標に沿うだけでなく、化石燃料を完全に廃止することに伴う経済的・エネルギー安全保障上の懸念にも対処するものです。
市場変動
市場の変動は、投資や運用の意思決定に不確実性をもたらすことで、発電炭素貯留(CCS)セクターに大きな影響を与えます。地政学的緊張、サプライチェーンの途絶、需要のシフトによって変動するエネルギー価格は、企業にとってCCS技術に関連する高額な初期費用を正当化することを困難にします。投資家は、リターンが不透明なプロジェクトに資本を投下することを躊躇しがちであり、特に従来のエネルギー源が不安定な市場において安価なままである場合はなおさらです。規制状況の変化や、グリーン・イニシアティブに対する政府の支援のばらつきは、情勢をさらに複雑にし、一貫性のない資金調達やプロジェクトの遅れにつながる可能性があります。こうした不安定さは、CCSインフラの成長を妨げるだけでなく、炭素排出を効率的に回収・貯留する技術革新の妨げにもなります。
インフラ開発
よりクリーンなエネルギー源への需要が高まるにつれ、パイプライン、貯蔵施設、高度な分離回収システムといったインフラへの投資が不可欠となります。これらの開発により、発電所から排出される二酸化炭素を効率的に回収し、大気中への流入を防ぐことができます。輸送網が強化されたことで、回収された二酸化炭素を地中貯留場所まで効率的に移動させ、地下に安全に隔離することができます。さらに、研究施設の改善と技術の進歩は、CCS手法の革新を促進し、その効率を高め、コストを削減します。より持続可能なエネルギー源への移行期において、化石燃料を利用した発電に依存し続ける一方で、強固なインフラの枠組みを構築することで、温室効果ガスの排出を大幅に削減することができます。
運転の複雑さ
運用の複雑さは、発電におけるCCS(炭素回収・貯留)の効率と実施の妨げとなります。CCS技術は、発電所から排出される二酸化炭素を回収する複雑なプロセスを含み、高度なシステムと大規模なインフラを必要とします。化学プロセス、エネルギー消費、回収された二酸化炭素の輸送など、さまざまな要素を注意深く管理する必要があるため、これらの技術を既存の発電フレームワークに統合することは、運用を複雑にする可能性があります。これらのシステムを監督・維持する熟練した人材が必要なことも、運用の負担に拍車をかけています。高い資本コストと長い投資回収期間が、CCSへの投資をさらに抑制し、普及を困難にしています。
COVID-19の影響:
COVID-19の大流行は、特にCCS(炭素回収・貯留)技術の観点から、発電部門に大きな影響を与えました。パンデミックの間、多くの国が経済減速に直面し、CCSを含むエネルギー・インフラや環境プロジェクトに対する投資の減少につながった。焦点は公衆衛生に移り、長期的な気候変動への取り組みから注目と資源がそれることになった。サプライチェーンの混乱はCCS技術の開発と展開を妨げ、重要なプロジェクトを遅らせた。
予測期間中、ポスト燃焼部門が最大となる見込み
予測期間中、ポスト燃焼部門が市場の最大シェアを占めると予想されます。このプロセスでは、発電時に発生する排ガスから二酸化炭素(CO2)を、一般的にアミン系溶剤やその他の先端材料を用いて回収します。この技術により、既存の発電所はインフラを全面的に見直すことなく、二酸化炭素排出量を削減することができます。いったん回収されたCO2は、圧縮して地下に永久貯蔵するために輸送することもできるし、さまざまな産業プロセスで利用することもできます。世界のエネルギー需要の増加と気候変動目標の厳格化に伴い、燃焼後CCS技術の統合は、よりクリーンなエネルギーシステムへの移行に不可欠です。
予測期間中、CAGRが最も高くなると予想されるのはバイオマス発電分野です。
バイオマス発電分野は、予測期間中に急成長すると予測されます。農業残渣、木質ペレット、その他の生物学的物質などの有機物を利用することで、バイオマス発電所はエネルギーを生産すると同時に二酸化炭素を隔離することができます。燃焼中に排出される炭素は、高度なCCS技術を使って回収することができます。CCS技術とは、大気中に放出される前に二酸化炭素を回収し、地下に貯蔵したり、さまざまな用途に利用したりする技術です。このプロセスは、温室効果ガスの排出を緩和するだけでなく、炭素を放出するのではなく、再利用するという循環型炭素経済にも貢献します。さらに、バイオマスは持続可能な慣行によって有機物を補充することができるため、再生可能であると考えられています。
最大のシェアを占める地域
北米地域は、予測期間を通じて市場の最大シェアを維持する見通しです。気候変動の緩和が急務となる中、政府、非公開会社、研究機関を含む利害関係者は、CCSの効率を高めコストを削減する革新的ソリューションを開発するために力を合わせています。こうしたパートナーシップは、知識、リソース、ベストプラクティスの共有を促進し、拡張可能な技術の迅速な展開を可能にします。地域のカーボン・ハブや官民協力のようなイニシアティブは、発電所や産業源から排出されるCO2を回収するために不可欠な投資やインフラ整備を促進します。さらに、こうした提携は、野心的な炭素削減目標の達成を目指す国や州の政策に合致することが多いです。
CAGRが最も高い地域:
予測期間中、CAGRが最も高いのは欧州地域です。政府の規制は、2050年までに温室効果ガス排出量を正味ゼロにすることを目標とする欧州グリーンディールのような、野心的な気候変動目標の達成を目指しています。財政的インセンティブを提供し、厳しい排出制限を設定し、カーボンプライシングの枠組みを確立することで、各国政府はCCSインフラへの投資を奨励しています。これにより、発電所から排出される二酸化炭素を回収して地下に安全に貯蔵し、環境への影響を緩和する革新的な技術のための強固な市場が形成されます。さらに、規制は研究開発を促進し、官民の協力を促進します。その結果、欧州はCCSのリーダーとしての地位を確立し、エネルギー部門の脱炭素化を支援するだけでなく、グリーン雇用と持続可能な慣行を通じて経済成長にも貢献しています。
無料のカスタマイズサービス
本レポートをご購読のお客様には、以下の無料カスタマイズオプションのいずれかをご利用いただけます:
- 企業プロファイル
- 追加市場プレーヤーの包括的プロファイリング(3社まで)
- 主要企業のSWOT分析(3社まで)
- 地域セグメンテーション
- 顧客の関心に応じた主要国の市場推計・予測・CAGR(注:フィージビリティチェックによる)
- 競合ベンチマーキング
- 製品ポートフォリオ、地理的プレゼンス、戦略的提携に基づく主要企業のベンチマーキング
目次
第1章 エグゼクティブサマリー
第2章 序文
- 概要
- ステークホルダー
- 調査範囲
- 調査手法
- データマイニング
- データ分析
- データ検証
- 調査アプローチ
- 調査情報源
- 1次調査情報源
- 2次調査情報源
- 前提条件
第3章 市場動向分析
- 促進要因
- 抑制要因
- 機会
- 脅威
- 技術分析
- 用途分析
- 新興市場
- COVID-19の影響
第4章 ポーターのファイブフォース分析
- 供給企業の交渉力
- 買い手の交渉力
- 代替品の脅威
- 新規参入業者の脅威
- 競争企業間の敵対関係
第5章 世界の発電用CCS(炭素回収・貯留)市場:技術別
- 燃焼後
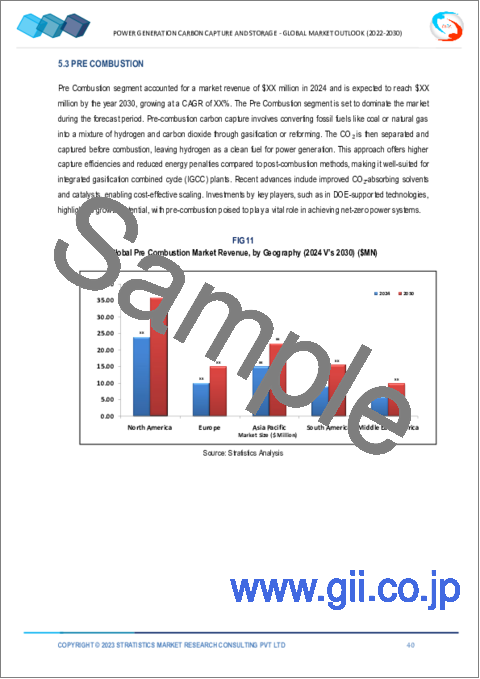
- 燃焼前
- 酸素燃焼
第6章 世界の発電用CCS(炭素回収・貯留)市場:用途別
- 石炭発電
- 天然ガス発電
- バイオマス発電
- 産業用発電
- その他の用途
第7章 世界の発電用CCS(炭素回収・貯留)市場:地域別
- 北米
- 米国
- カナダ
- メキシコ
- 欧州
- ドイツ
- 英国
- イタリア
- フランス
- スペイン
- その他欧州
- アジア太平洋
- 日本
- 中国
- インド
- オーストラリア
- ニュージーランド
- 韓国
- その他アジア太平洋地域
- 南米
- アルゼンチン
- ブラジル
- チリ
- その他南米
- 中東・アフリカ
- サウジアラビア
- アラブ首長国連邦
- カタール
- 南アフリカ
- その他中東とアフリカ
第8章 主な発展
- 契約、パートナーシップ、コラボレーション、合弁事業
- 買収と合併
- 新製品発売
- 事業拡大
- その他の主要戦略
第9章 企業プロファイリング
- Aker Solutions
- Dakota Gasification Company
- Drax Group
- Equinor ASA
- Exxon Mobil Corporation
- Fluor Corporation
- General Electric
- JGC Corporation
- Linde plc
- Mitsubishi Heavy Industries, Ltd
- NRG Energy, Inc
- Siemens AG
- Sulzer Ltd
List of Tables
- Table 1 Global Power Generation Carbon Capture and Storage Market Outlook, By Region (2022-2030) ($MN)
- Table 2 Global Power Generation Carbon Capture and Storage Market Outlook, By Technology (2022-2030) ($MN)
- Table 3 Global Power Generation Carbon Capture and Storage Market Outlook, By Post Combustion (2022-2030) ($MN)
- Table 4 Global Power Generation Carbon Capture and Storage Market Outlook, By Pre Combustion (2022-2030) ($MN)
- Table 5 Global Power Generation Carbon Capture and Storage Market Outlook, By Oxy-fuel Combustion (2022-2030) ($MN)
- Table 6 Global Power Generation Carbon Capture and Storage Market Outlook, By Application (2022-2030) ($MN)
- Table 7 Global Power Generation Carbon Capture and Storage Market Outlook, By Coal Power Generation (2022-2030) ($MN)
- Table 8 Global Power Generation Carbon Capture and Storage Market Outlook, By Natural Gas Power Generation (2022-2030) ($MN)
- Table 9 Global Power Generation Carbon Capture and Storage Market Outlook, By Biomass Power Generation (2022-2030) ($MN)
- Table 10 Global Power Generation Carbon Capture and Storage Market Outlook, By Industrial Power Generation (2022-2030) ($MN)
- Table 11 Global Power Generation Carbon Capture and Storage Market Outlook, By Other Applications (2022-2030) ($MN)
- Table 12 North America Power Generation Carbon Capture and Storage Market Outlook, By Country (2022-2030) ($MN)
- Table 13 North America Power Generation Carbon Capture and Storage Market Outlook, By Technology (2022-2030) ($MN)
- Table 14 North America Power Generation Carbon Capture and Storage Market Outlook, By Post Combustion (2022-2030) ($MN)
- Table 15 North America Power Generation Carbon Capture and Storage Market Outlook, By Pre Combustion (2022-2030) ($MN)
- Table 16 North America Power Generation Carbon Capture and Storage Market Outlook, By Oxy-fuel Combustion (2022-2030) ($MN)
- Table 17 North America Power Generation Carbon Capture and Storage Market Outlook, By Application (2022-2030) ($MN)
- Table 18 North America Power Generation Carbon Capture and Storage Market Outlook, By Coal Power Generation (2022-2030) ($MN)
- Table 19 North America Power Generation Carbon Capture and Storage Market Outlook, By Natural Gas Power Generation (2022-2030) ($MN)
- Table 20 North America Power Generation Carbon Capture and Storage Market Outlook, By Biomass Power Generation (2022-2030) ($MN)
- Table 21 North America Power Generation Carbon Capture and Storage Market Outlook, By Industrial Power Generation (2022-2030) ($MN)
- Table 22 North America Power Generation Carbon Capture and Storage Market Outlook, By Other Applications (2022-2030) ($MN)
- Table 23 Europe Power Generation Carbon Capture and Storage Market Outlook, By Country (2022-2030) ($MN)
- Table 24 Europe Power Generation Carbon Capture and Storage Market Outlook, By Technology (2022-2030) ($MN)
- Table 25 Europe Power Generation Carbon Capture and Storage Market Outlook, By Post Combustion (2022-2030) ($MN)
- Table 26 Europe Power Generation Carbon Capture and Storage Market Outlook, By Pre Combustion (2022-2030) ($MN)
- Table 27 Europe Power Generation Carbon Capture and Storage Market Outlook, By Oxy-fuel Combustion (2022-2030) ($MN)
- Table 28 Europe Power Generation Carbon Capture and Storage Market Outlook, By Application (2022-2030) ($MN)
- Table 29 Europe Power Generation Carbon Capture and Storage Market Outlook, By Coal Power Generation (2022-2030) ($MN)
- Table 30 Europe Power Generation Carbon Capture and Storage Market Outlook, By Natural Gas Power Generation (2022-2030) ($MN)
- Table 31 Europe Power Generation Carbon Capture and Storage Market Outlook, By Biomass Power Generation (2022-2030) ($MN)
- Table 32 Europe Power Generation Carbon Capture and Storage Market Outlook, By Industrial Power Generation (2022-2030) ($MN)
- Table 33 Europe Power Generation Carbon Capture and Storage Market Outlook, By Other Applications (2022-2030) ($MN)
- Table 34 Asia Pacific Power Generation Carbon Capture and Storage Market Outlook, By Country (2022-2030) ($MN)
- Table 35 Asia Pacific Power Generation Carbon Capture and Storage Market Outlook, By Technology (2022-2030) ($MN)
- Table 36 Asia Pacific Power Generation Carbon Capture and Storage Market Outlook, By Post Combustion (2022-2030) ($MN)
- Table 37 Asia Pacific Power Generation Carbon Capture and Storage Market Outlook, By Pre Combustion (2022-2030) ($MN)
- Table 38 Asia Pacific Power Generation Carbon Capture and Storage Market Outlook, By Oxy-fuel Combustion (2022-2030) ($MN)
- Table 39 Asia Pacific Power Generation Carbon Capture and Storage Market Outlook, By Application (2022-2030) ($MN)
- Table 40 Asia Pacific Power Generation Carbon Capture and Storage Market Outlook, By Coal Power Generation (2022-2030) ($MN)
- Table 41 Asia Pacific Power Generation Carbon Capture and Storage Market Outlook, By Natural Gas Power Generation (2022-2030) ($MN)
- Table 42 Asia Pacific Power Generation Carbon Capture and Storage Market Outlook, By Biomass Power Generation (2022-2030) ($MN)
- Table 43 Asia Pacific Power Generation Carbon Capture and Storage Market Outlook, By Industrial Power Generation (2022-2030) ($MN)
- Table 44 Asia Pacific Power Generation Carbon Capture and Storage Market Outlook, By Other Applications (2022-2030) ($MN)
- Table 45 South America Power Generation Carbon Capture and Storage Market Outlook, By Country (2022-2030) ($MN)
- Table 46 South America Power Generation Carbon Capture and Storage Market Outlook, By Technology (2022-2030) ($MN)
- Table 47 South America Power Generation Carbon Capture and Storage Market Outlook, By Post Combustion (2022-2030) ($MN)
- Table 48 South America Power Generation Carbon Capture and Storage Market Outlook, By Pre Combustion (2022-2030) ($MN)
- Table 49 South America Power Generation Carbon Capture and Storage Market Outlook, By Oxy-fuel Combustion (2022-2030) ($MN)
- Table 50 South America Power Generation Carbon Capture and Storage Market Outlook, By Application (2022-2030) ($MN)
- Table 51 South America Power Generation Carbon Capture and Storage Market Outlook, By Coal Power Generation (2022-2030) ($MN)
- Table 52 South America Power Generation Carbon Capture and Storage Market Outlook, By Natural Gas Power Generation (2022-2030) ($MN)
- Table 53 South America Power Generation Carbon Capture and Storage Market Outlook, By Biomass Power Generation (2022-2030) ($MN)
- Table 54 South America Power Generation Carbon Capture and Storage Market Outlook, By Industrial Power Generation (2022-2030) ($MN)
- Table 55 South America Power Generation Carbon Capture and Storage Market Outlook, By Other Applications (2022-2030) ($MN)
- Table 56 Middle East & Africa Power Generation Carbon Capture and Storage Market Outlook, By Country (2022-2030) ($MN)
- Table 57 Middle East & Africa Power Generation Carbon Capture and Storage Market Outlook, By Technology (2022-2030) ($MN)
- Table 58 Middle East & Africa Power Generation Carbon Capture and Storage Market Outlook, By Post Combustion (2022-2030) ($MN)
- Table 59 Middle East & Africa Power Generation Carbon Capture and Storage Market Outlook, By Pre Combustion (2022-2030) ($MN)
- Table 60 Middle East & Africa Power Generation Carbon Capture and Storage Market Outlook, By Oxy-fuel Combustion (2022-2030) ($MN)
- Table 61 Middle East & Africa Power Generation Carbon Capture and Storage Market Outlook, By Application (2022-2030) ($MN)
- Table 62 Middle East & Africa Power Generation Carbon Capture and Storage Market Outlook, By Coal Power Generation (2022-2030) ($MN)
- Table 63 Middle East & Africa Power Generation Carbon Capture and Storage Market Outlook, By Natural Gas Power Generation (2022-2030) ($MN)
- Table 64 Middle East & Africa Power Generation Carbon Capture and Storage Market Outlook, By Biomass Power Generation (2022-2030) ($MN)
- Table 65 Middle East & Africa Power Generation Carbon Capture and Storage Market Outlook, By Industrial Power Generation (2022-2030) ($MN)
- Table 66 Middle East & Africa Power Generation Carbon Capture and Storage Market Outlook, By Other Applications (2022-2030) ($MN)
According to Stratistics MRC, the Global Power Generation Carbon Capture and Storage Market is accounted for $2.55 billion in 2024 and is expected to reach $8.11 billion by 2030 growing at a CAGR of 21.3% during the forecast period. Power Generation Carbon Capture and Storage (CCS) is a technology aimed at reducing greenhouse gas emissions from power plants, particularly those that burn fossil fuels. The process involves three main steps, capturing carbon dioxide (CO2) emissions produced during power generation, transporting the captured CO2 to a storage site, and securely storing it underground to prevent its release into the atmosphere. CCS can significantly mitigate the environmental impact of coal and natural gas power plants, helping to transition towards a low-carbon energy future. By enabling the continued use of fossil fuels while minimizing their carbon footprint, CCS plays a critical role in efforts to combat climate change.
Market Dynamics:
Driver:
Rising public concern about climate change
Rising public concern about climate change is substantially driving advancements in Power Generation Carbon Capture and Storage (CCS) technologies. As awareness of the urgent need to reduce greenhouse gas emissions grows, governments and industries are increasingly investing in CCS as a viable solution for mitigating the environmental impact of fossil fuel energy production. CCS technologies capture carbon dioxide emissions produced from power plants before they can enter the atmosphere, enabling a transition toward cleaner energy sources while still utilizing existing infrastructure. This shift not only aligns with global climate goals but also addresses the economic and energy security concerns associated with phasing out fossil fuels entirely.
Restraint:
Market volatility
Market volatility significantly impacts the Power Generation Carbon Capture and Storage (CCS) sector by creating uncertainty in investment and operational decisions. Fluctuating energy prices, driven by geopolitical tensions, supply chain disruptions, and shifts in demand, can make it challenging for companies to justify the high upfront costs associated with CCS technologies. Investors often hesitate to commit capital to projects with uncertain returns, especially when traditional energy sources remain cheaper in volatile markets. Regulatory changes and varying government support for green initiatives can further complicate the landscape, leading to inconsistent funding and project delays. This instability not only hampers the growth of CCS infrastructure but also discourages innovation in capturing and storing carbon emissions effectively.
Opportunity:
Infrastructure development
As the demand for cleaner energy sources grows, investments in infrastructure such as pipelines, storage facilities, and advanced capture systems are essential. These developments enable the efficient capture of carbon dioxide emissions from power plants, preventing them from entering the atmosphere. Enhanced transportation networks allow for the effective movement of captured CO2 to geological storage sites, where it can be securely sequestered underground. Moreover, improved research facilities and technological advancements foster innovation in CCS methods, increasing their efficiency and reducing costs. By creating a robust infrastructure framework, we can significantly mitigate greenhouse gas emissions while continuing to rely on fossil fuel-based power generation during the transition to more sustainable energy sources.
Threat:
Operational complexity
Operational complexity significantly hinders the efficiency and implementation of Carbon Capture and Storage (CCS) in power generation. CCS technologies involve intricate processes that capture carbon dioxide emissions from power plants, requiring advanced systems and extensive infrastructure. The integration of these technologies into existing power generation frameworks can complicate operations, as they demand careful management of various components, including chemical processes, energy consumption, and transportation of captured CO2. The need for skilled personnel to oversee and maintain these systems adds to operational burdens. High capital costs and long payback periods further deter investment in CCS, making it challenging to achieve widespread adoption.
Covid-19 Impact:
The COVID-19 pandemic significantly impacted the power generation sector, particularly in the context of carbon capture and storage (CCS) technologies. During the pandemic, many countries faced economic slowdowns, leading to reduced investments in energy infrastructure and environmental projects, including CCS. The focus shifted to immediate public health concerns, diverting attention and resources away from long-term climate initiatives. Disruptions in supply chains hindered the development and deployment of CCS technologies, delaying critical projects.
The Post Combustion segment is expected to be the largest during the forecast period
Post Combustion segment is expected to dominate the largest share of the market over the estimated period. In this process, carbon dioxide (CO2) is captured from the flue gases produced during electricity generation, typically using amine-based solvents or other advanced materials. This technology allows existing power plants to reduce their carbon footprint without requiring a complete overhaul of infrastructure. Once captured, the CO2 can be compressed and transported for permanent storage underground, or it can be utilized in various industrial processes, thus preventing it from entering the atmosphere. As global energy demands rise and climate goals become more stringent, the integration of post-combustion CCS technologies is vital for transitioning to cleaner energy systems.
The Biomass Power Generation segment is expected to have the highest CAGR during the forecast period
Biomass Power Generation segment is estimated to grow at a rapid pace during the forecast period. By utilizing organic materials such as agricultural residues, wood pellets, and other biological matter, biomass power plants can produce energy while simultaneously sequestering carbon dioxide. During combustion, the carbon emitted can be captured using advanced CCS techniques, which involve trapping CO2 before it enters the atmosphere and storing it underground or utilizing it in various applications. This process not only mitigates greenhouse gas emissions but also contributes to a circular carbon economy, where carbon is recycled rather than released. Additionally, biomass is considered renewable, as the organic materials can be replenished through sustainable practices.
Region with largest share:
North America region is poised to hold the largest share of the market throughout the extrapolated period. As the urgency to mitigate climate change intensifies, stakeholders-including governments, private companies, and research institutions-are joining forces to develop innovative solutions that enhance CCS efficiency and reduce costs. These partnerships foster the sharing of knowledge, resources, and best practices, enabling the rapid deployment of scalable technologies. Initiatives like regional carbon hubs and public-private collaborations facilitate investment and infrastructure development, essential for capturing CO2 emissions from power plants and industrial sources. Moreover, these alliances often align with national and state policies aimed at achieving ambitious carbon reduction targets.
Region with highest CAGR:
Europe region is estimated to witness the highest CAGR during the projected time frame. Government regulations aims to meet ambitious climate goals, such as the European Green Deal, which targets net-zero greenhouse gas emissions by 2050. By providing financial incentives, setting strict emissions limits, and establishing frameworks for carbon pricing, governments are encouraging investment in CCS infrastructure. This creates a robust market for innovative technologies that capture carbon dioxide from power plants and store it safely underground, mitigating environmental impact. Additionally, regulations promote research and development, fostering collaboration between public and private sectors. As a result, Europe is positioning itself as a leader in CCS, supporting not only the decarbonization of the energy sector but also contributing to economic growth through green jobs and sustainable practices.
Key players in the market
Some of the key players in Power Generation Carbon Capture and Storage market include Aker Solutions, Dakota Gasification Company, Drax Group, Equinor ASA, Exxon Mobil Corporation, Fluor Corporation, General Electric, JGC Corporation, Linde plc, Mitsubishi Heavy Industries, Ltd, NRG Energy, Inc, Siemens AG and Sulzer Ltd.
Key Developments:
In July 2023, The European Commission has announced that it will invest over USD 3.6 billion to scale up innovative clean technologies. The incorporation of Carbon Capture and Storage (CCS) in power generation is frequently shaped by government policies and regulations.
In February 2023, the U.S. launched a USD 2.5 billion funding program for large-scale pilot and demonstration projects aimed at decarbonizing power generation and hard-to-abate industries. Financed under the Bipartisan Infrastructure Law, this funding will be distributed through two channels, the Carbon Capture Large-Scale Pilots Program and the Carbon Capture Demonstration Projects Program.
In November 2022, General Electric entered into an agreement with DL E&C Co. Ltd., a South Korean-based EPC company, and its subsidiary, CARBONCO, to build potential carbon capture projects for the new or existing combined-cycle power plants. In addition, the collaborative companies will conduct feasibility and Front-End Engineering Design (FEED) studies. The collaboration will pave the way for customers to adopt CCUS technologies, thereby addressing carbon emissions across Asia.
Technologies Covered:
- Post Combustion
- Pre Combustion
- Oxy-fuel Combustion
Applications Covered:
- Coal Power Generation
- Natural Gas Power Generation
- Biomass Power Generation
- Industrial Power Generation
- Other Applications
Regions Covered:
- North America
- US
- Canada
- Mexico
- Europe
- Germany
- UK
- Italy
- France
- Spain
- Rest of Europe
- Asia Pacific
- Japan
- China
- India
- Australia
- New Zealand
- South Korea
- Rest of Asia Pacific
- South America
- Argentina
- Brazil
- Chile
- Rest of South America
- Middle East & Africa
- Saudi Arabia
- UAE
- Qatar
- South Africa
- Rest of Middle East & Africa
What our report offers:
- Market share assessments for the regional and country-level segments
- Strategic recommendations for the new entrants
- Covers Market data for the years 2022, 2023, 2024, 2026, and 2030
- Market Trends (Drivers, Constraints, Opportunities, Threats, Challenges, Investment Opportunities, and recommendations)
- Strategic recommendations in key business segments based on the market estimations
- Competitive landscaping mapping the key common trends
- Company profiling with detailed strategies, financials, and recent developments
- Supply chain trends mapping the latest technological advancements
Free Customization Offerings:
All the customers of this report will be entitled to receive one of the following free customization options:
- Company Profiling
- Comprehensive profiling of additional market players (up to 3)
- SWOT Analysis of key players (up to 3)
- Regional Segmentation
- Market estimations, Forecasts and CAGR of any prominent country as per the client's interest (Note: Depends on feasibility check)
- Competitive Benchmarking
- Benchmarking of key players based on product portfolio, geographical presence, and strategic alliances
Table of Contents
1 Executive Summary
2 Preface
- 2.1 Abstract
- 2.2 Stake Holders
- 2.3 Research Scope
- 2.4 Research Methodology
- 2.4.1 Data Mining
- 2.4.2 Data Analysis
- 2.4.3 Data Validation
- 2.4.4 Research Approach
- 2.5 Research Sources
- 2.5.1 Primary Research Sources
- 2.5.2 Secondary Research Sources
- 2.5.3 Assumptions
3 Market Trend Analysis
- 3.1 Introduction
- 3.2 Drivers
- 3.3 Restraints
- 3.4 Opportunities
- 3.5 Threats
- 3.6 Technology Analysis
- 3.7 Application Analysis
- 3.8 Emerging Markets
- 3.9 Impact of Covid-19
4 Porters Five Force Analysis
- 4.1 Bargaining power of suppliers
- 4.2 Bargaining power of buyers
- 4.3 Threat of substitutes
- 4.4 Threat of new entrants
- 4.5 Competitive rivalry
5 Global Power Generation Carbon Capture and Storage Market, By Technology
- 5.1 Introduction
- 5.2 Post Combustion
- 5.3 Pre Combustion
- 5.4 Oxy-fuel Combustion
6 Global Power Generation Carbon Capture and Storage Market, By Application
- 6.1 Introduction
- 6.2 Coal Power Generation
- 6.3 Natural Gas Power Generation
- 6.4 Biomass Power Generation
- 6.5 Industrial Power Generation
- 6.6 Other Applications
7 Global Power Generation Carbon Capture and Storage Market, By Geography
- 7.1 Introduction
- 7.2 North America
- 7.2.1 US
- 7.2.2 Canada
- 7.2.3 Mexico
- 7.3 Europe
- 7.3.1 Germany
- 7.3.2 UK
- 7.3.3 Italy
- 7.3.4 France
- 7.3.5 Spain
- 7.3.6 Rest of Europe
- 7.4 Asia Pacific
- 7.4.1 Japan
- 7.4.2 China
- 7.4.3 India
- 7.4.4 Australia
- 7.4.5 New Zealand
- 7.4.6 South Korea
- 7.4.7 Rest of Asia Pacific
- 7.5 South America
- 7.5.1 Argentina
- 7.5.2 Brazil
- 7.5.3 Chile
- 7.5.4 Rest of South America
- 7.6 Middle East & Africa
- 7.6.1 Saudi Arabia
- 7.6.2 UAE
- 7.6.3 Qatar
- 7.6.4 South Africa
- 7.6.5 Rest of Middle East & Africa
8 Key Developments
- 8.1 Agreements, Partnerships, Collaborations and Joint Ventures
- 8.2 Acquisitions & Mergers
- 8.3 New Product Launch
- 8.4 Expansions
- 8.5 Other Key Strategies
9 Company Profiling
- 9.1 Aker Solutions
- 9.2 Dakota Gasification Company
- 9.3 Drax Group
- 9.4 Equinor ASA
- 9.5 Exxon Mobil Corporation
- 9.6 Fluor Corporation
- 9.7 General Electric
- 9.8 JGC Corporation
- 9.9 Linde plc
- 9.10 Mitsubishi Heavy Industries, Ltd
- 9.11 NRG Energy, Inc
- 9.12 Siemens AG
- 9.13 Sulzer Ltd
