|
|
市場調査レポート
商品コード
1453931
仮想発電所(バーチャルパワープラント、VPP)の2030年までの市場予測: コンポーネントタイプ、展開タイプ、ソース、技術、用途、エンドユーザー、地域別の世界分析Virtual Power Plant Market Forecasts to 2030 - Global Analysis By Component Type (Hardware, Software, Services and Other Component Types), Deployment Type, Source, Technology, Application, End User, and By Geography |
||||||
カスタマイズ可能
|
|||||||
| 仮想発電所(バーチャルパワープラント、VPP)の2030年までの市場予測: コンポーネントタイプ、展開タイプ、ソース、技術、用途、エンドユーザー、地域別の世界分析 |
|
出版日: 2024年03月03日
発行: Stratistics Market Research Consulting
ページ情報: 英文 200+ Pages
納期: 2~3営業日
|
全表示
- 概要
- 図表
- 目次
Stratistics MRCによると、世界の仮想発電所(バーチャルパワープラント、VPP)市場は2023年に41億米ドルを占め、予測期間中にCAGR 20.0%で成長し、2030年には147億1,000万米ドルに達すると予測されています。
仮想発電所(バーチャルパワープラント、VPP)(VPP)とは、太陽光パネル、風力タービン、蓄電池システムなどの分散型発電源をクラウドベースで集約し、単一の統合発電所として機能するように調整したものです。高度なソフトウェアと制御システムを通じて、VPPは分散型エネルギー資源の運用を最適化し、系統安定性、柔軟性、エネルギー取引サービスを提供します。再生可能エネルギーの効率的な利用を可能にし、従来の化石燃料発電所への依存を減らし、より持続可能で強靭なエネルギーシステムへの移行をサポートします。VPPは、再生可能エネルギーの送電網への統合を可能にする上で重要な役割を果たしています。
国際エネルギー機関(IEA)の報告書によると、2020年の世界の電力需要は4%増の900TWhとなり、他のあらゆる形態のエネルギー需要の約2倍の速さで拡大します。
再生可能エネルギーの統合
VPPは、分散型エネルギー資源(DER)のグリッドへのシームレスな統合と最適化を可能にすることで、この移行において重要な役割を果たしています。より持続可能で低炭素なエネルギーシステムへの移行には、太陽光発電や風力発電のような断続的な再生可能エネルギーの効率的な管理が必要です。さらに、高度なソフトウェアと制御システムは、再生可能エネルギーの効率的な利用を保証し、抑制を最小限に抑え、グリッドの柔軟性と回復力を強化します。
高いイニシャルコスト
VPPの導入には、ハードウェア、ソフトウェア、インフラへの多額の先行投資が必要です。特に、小規模な組織や資金力の乏しい組織にとっては、初期コストが高いことが参入障壁となり、潜在的な投資家の意欲をそぎ、VPPの導入が制限される可能性があります。さらに、VPPシステムの複雑さや専門的な技術知識の必要性もイニシャルコストの一因となり、市場規模を徐々に押し下げる要因となっています。
技術の進歩
クラウドベースのプラットフォームと高度なソフトウェア・ソリューションは、多様なDERポートフォリオのシームレスな統合と集約を可能にし、グリッドの柔軟性と回復力を高める。デジタル化、通信、制御技術の進歩は、VPPの運用方法に革命をもたらし、DERのリアルタイム監視、制御、最適化を可能にしています。さらに、リチウムイオン電池やフロー電池などの蓄電システムの技術革新も、VPP市場の成長に重要な役割を果たしています。
認識と教育の不足
VPPはエネルギー業界では比較的新しい概念であり、潜在的な利害関係者の多くは、VPPのメリットや機能性に関する知識や理解が限られている可能性があります。政策立案者や規制当局は、規制の枠組みや市場構造に対する理解が乏しく、その結果、支援的な政策、規制、インセンティブが欠如している可能性があります。さらに、このような認識不足は、VPPプログラムへの投資や参加への消極的な姿勢につながり、この市場の妨げとなります。
COVID-19の影響
COVID-19パンデミックは、主にサプライチェーンの混乱、プロジェクトの遅延、経済の不確実性により、仮想発電所(バーチャルパワープラント、VPP)市場にいくつかの悪影響を与えました。渡航制限、ロックダウン措置、社会的距離の要求が、立地調査、許認可プロセス、建設活動に支障をきたしています。さらに、パンデミックはエネルギー市場にも影響を与え、産業活動の低下や消費者行動の変化がエネルギー需要と価格の変動につながっています。
予測期間中はソフトウェア・セグメントが最大になる見込み
ソフトウェア・セグメントは、VPPを構成する多様な分散型エネルギー資源(DER)の編成と最適化において極めて重要な役割を果たすため、最大のシェアを占めると推定されます。これらのソフトウェア・プラットフォームは、高度なアルゴリズム、人工知能(AI)、機械学習(ML)技術を活用して、エネルギー発電、消費パターン、市場状況を予測します。さらに、これらのソフトウェア・プラットフォームは、利害関係者に力を与えるユーザーフレンドリーなインターフェースやダッシュボードを備えていることが多く、これがこのセグメントの拡大を後押ししています。
予測期間中、クラウドベースのセグメントが最も高いCAGRが見込まれる
分散型エネルギー資源(DER)を管理・調整するためにインターネット上にホストされたリモートサーバーが使用されるため、クラウドベースのセグメントは予測期間中にCAGRが最も高くなると予想されます。クラウドベースのプラットフォームには、拡張性、アクセス性、リアルタイムデータ処理機能など、いくつかの利点があります。さらに、これらのソリューションはDERの制御と管理を一元化し、グリッド需要を満たすためのリソースの効率的な集約、最適化、ディスパッチを可能にするため、このセグメントの成長を後押ししています。
最大のシェアを占める地域
欧州は、再生可能エネルギー源の導入拡大、デジタル化技術の進歩、エネルギー市場規制の進化により、予測期間中最大の市場シェアを占めました。ドイツ、オランダ、デンマーク、英国などの国々は、成熟した再生可能エネルギー部門と支援的な規制枠組みを活用しています。さらに、この地域の野心的な再生可能エネルギー目標は、グリッドの柔軟性と回復力を強化する必要性とともに、VPPソリューションの需要を促進しています。
CAGRが最も高い地域:
北米は、多様なエネルギー情勢、支持的な規制環境、市場改革により、予測期間中に最も高いCAGRを記録すると予想されます。北米のVPP市場は、データ分析と通信技術の進歩により、リアルタイムの監視、制御、最適化が可能になっています。さらに、連邦、州、地方レベルでの政策イニシアチブが投資を引き上げ、クリーンエネルギー技術の採用にインセンティブを与え、この地域の成長を促進しています。
無料のカスタマイズサービス:
本レポートをご購読のお客様には、以下の無料カスタマイズオプションのいずれかをご利用いただけます:
- 企業プロファイル
- 追加市場プレーヤーの包括的プロファイリング(3社まで)
- 主要企業のSWOT分析(3社まで)
- 地域セグメンテーション
- 顧客の関心に応じた主要国の市場推計・予測・CAGR(注:フィージビリティチェックによる)
- 競合ベンチマーキング
- 製品ポートフォリオ、地理的プレゼンス、戦略的提携に基づく主要企業のベンチマーキング
目次
第1章 エグゼクティブサマリー
第2章 序文
- 概要
- ステークホルダー
- 調査範囲
- 調査手法
- データマイニング
- データ分析
- データ検証
- 調査アプローチ
- 調査ソース
- 1次調査ソース
- 2次調査ソース
- 前提条件
第3章 市場動向分析
- 促進要因
- 抑制要因
- 機会
- 脅威
- 技術分析
- アプリケーション分析
- エンドユーザー分析
- 新興市場
- 新型コロナウイルス感染症(COVID-19)の影響
第4章 ポーターのファイブフォース分析
- 供給企業の交渉力
- 買い手の交渉力
- 代替品の脅威
- 新規参入業者の脅威
- 競争企業間の敵対関係
第5章 世界の仮想発電所(バーチャルパワープラント、VPP)市場:コンポーネントタイプ別
- ハードウェア
- ソフトウェア
- サービス
- その他
第6章 世界の仮想発電所(バーチャルパワープラント、VPP)市場:展開タイプ別
- オンプレミス
- クラウドベース
第7章 世界の仮想発電所(バーチャルパワープラント、VPP)市場:ソース別
- ストレージ
- 再生可能エネルギー
- コージェネレーション
- その他
第8章 世界の仮想発電所(バーチャルパワープラント、VPP)市場:技術別
- エネルギー貯蔵
- デマンドレスポンス
- 熱電併給(CHP)
- 分散型エネルギー発電
- その他の技術
第9章 世界の仮想発電所(バーチャルパワープラント、VPP)市場:用途別
- 周波数調整
- エネルギー取引
- ピーク負荷管理
- グリッドバランシング
- その他の用途
第10章 世界の仮想発電所(バーチャルパワープラント、VPP)市場:エンドユーザー別
- 商業
- 産業
- 公共事業
- 住宅
- その他のエンドユーザー
第11章 世界の仮想発電所(バーチャルパワープラント、VPP)市場:地域別
- 北米
- 米国
- カナダ
- メキシコ
- 欧州
- ドイツ
- 英国
- イタリア
- フランス
- スペイン
- その他欧州
- アジア太平洋地域
- 日本
- 中国
- インド
- オーストラリア
- ニュージーランド
- 韓国
- その他アジア太平洋地域
- 南米
- アルゼンチン
- ブラジル
- チリ
- その他南米
- 中東とアフリカ
- サウジアラビア
- アラブ首長国連邦
- カタール
- 南アフリカ
- その他中東とアフリカ
第12章 主な発展
- 契約、パートナーシップ、コラボレーション、合弁事業
- 買収と合併
- 新製品の発売
- 事業拡大
- その他の主要戦略
第13章 企業プロファイル
- Next Kraftwerke
- Siemens
- Centrica
- Tesla
- Toshiba Energy Systems & Solutions
- ABB
- Sunverge Energy, Inc.
- Hitachi, Ltd.
- Limejump Limited
- AutoGrid Systems, Inc.
- General Electric
- Sonnen
- Lumenaza GmbH
- Schneider Electric
- Shell
List of Tables
- Table 1 Global Virtual Power Plant Market Outlook, By Region (2021-2030) ($MN)
- Table 2 Global Virtual Power Plant Market Outlook, By Component Type (2021-2030) ($MN)
- Table 3 Global Virtual Power Plant Market Outlook, By Introduction (2021-2030) ($MN)
- Table 4 Global Virtual Power Plant Market Outlook, By Hardware (2021-2030) ($MN)
- Table 5 Global Virtual Power Plant Market Outlook, By Software (2021-2030) ($MN)
- Table 6 Global Virtual Power Plant Market Outlook, By Services (2021-2030) ($MN)
- Table 7 Global Virtual Power Plant Market Outlook, By Other Component Types (2021-2030) ($MN)
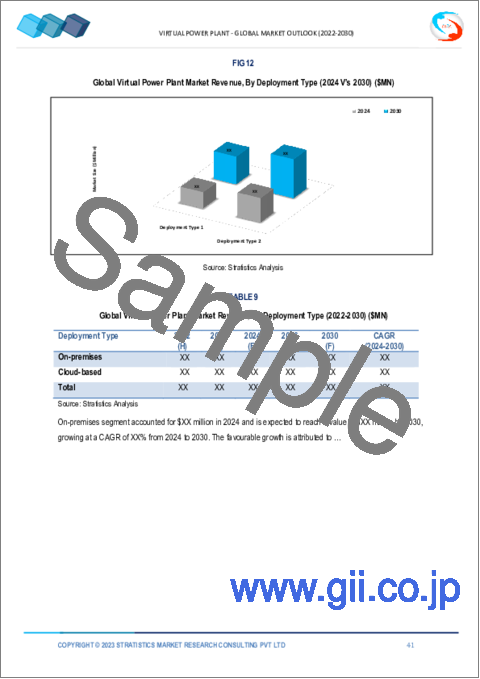
- Table 8 Global Virtual Power Plant Market Outlook, By Deployment Type (2021-2030) ($MN)
- Table 9 Global Virtual Power Plant Market Outlook, By On-premises (2021-2030) ($MN)
- Table 10 Global Virtual Power Plant Market Outlook, By Cloud-based (2021-2030) ($MN)
- Table 11 Global Virtual Power Plant Market Outlook, By Source (2021-2030) ($MN)
- Table 12 Global Virtual Power Plant Market Outlook, By Storage (2021-2030) ($MN)
- Table 13 Global Virtual Power Plant Market Outlook, By Renewable Energy (2021-2030) ($MN)
- Table 14 Global Virtual Power Plant Market Outlook, By Cogeneration (2021-2030) ($MN)
- Table 15 Global Virtual Power Plant Market Outlook, By Other Sources (2021-2030) ($MN)
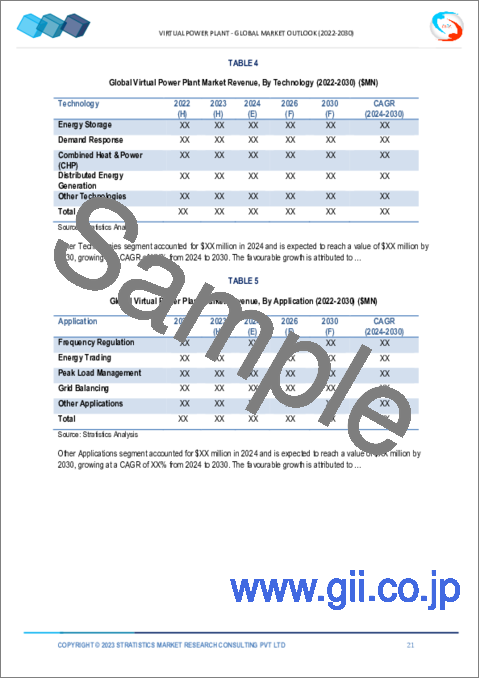
- Table 16 Global Virtual Power Plant Market Outlook, By Technology (2021-2030) ($MN)
- Table 17 Global Virtual Power Plant Market Outlook, By Energy Storage (2021-2030) ($MN)
- Table 18 Global Virtual Power Plant Market Outlook, By Demand Response (2021-2030) ($MN)
- Table 19 Global Virtual Power Plant Market Outlook, By Combined Heat & Power (CHP) (2021-2030) ($MN)
- Table 20 Global Virtual Power Plant Market Outlook, By Distributed Energy Generation (2021-2030) ($MN)
- Table 21 Global Virtual Power Plant Market Outlook, By Other Technologies (2021-2030) ($MN)
- Table 22 Global Virtual Power Plant Market Outlook, By Application (2021-2030) ($MN)
- Table 23 Global Virtual Power Plant Market Outlook, By Frequency Regulation (2021-2030) ($MN)
- Table 24 Global Virtual Power Plant Market Outlook, By Energy Trading (2021-2030) ($MN)
- Table 25 Global Virtual Power Plant Market Outlook, By Peak Load Management (2021-2030) ($MN)
- Table 26 Global Virtual Power Plant Market Outlook, By Grid Balancing (2021-2030) ($MN)
- Table 27 Global Virtual Power Plant Market Outlook, By Other Applications (2021-2030) ($MN)
- Table 28 Global Virtual Power Plant Market Outlook, By End User (2021-2030) ($MN)
- Table 29 Global Virtual Power Plant Market Outlook, By Commercial (2021-2030) ($MN)
- Table 30 Global Virtual Power Plant Market Outlook, By Industrial (2021-2030) ($MN)
- Table 31 Global Virtual Power Plant Market Outlook, By Utilities (2021-2030) ($MN)
- Table 32 Global Virtual Power Plant Market Outlook, By Residential (2021-2030) ($MN)
- Table 33 Global Virtual Power Plant Market Outlook, By Other End Users (2021-2030) ($MN)
Table Note: Tables for North America, Europe, APAC, South America, and Middle East & Africa Regions are also represented in the same manner as above.
According to Stratistics MRC, the Global Virtual Power Plant Market is accounted for $4.10 billion in 2023 and is expected to reach $14.71 billion by 2030 growing at a CAGR of 20.0% during the forecast period. A virtual power plant (VPP) is a cloud-based aggregation of decentralized power generation sources, such as solar panels, wind turbines, and battery storage systems, coordinated to function as a single integrated power plant. Through advanced software and control systems, a VPP optimizes the operation of distributed energy resources to provide grid stability, flexibility, and energy trading services. It allows for the efficient utilization of renewable energy sources, reduces reliance on traditional fossil fuel power plants, and supports the transition to a more sustainable and resilient energy system. VPPs play a crucial role in enabling the integration of renewable energy into the grid.
According to the International Energy Agency (IEA) report, the global demand for electricity climbed by 4%, or 900 TWh, in 2020, expanding almost twice as quickly as the demand for all other forms of energy.
Market Dynamics:
Driver:
Renewable energy integration
VPPs play a crucial role in this transition by enabling the seamless integration and optimization of distributed energy resources (DERs) into the grid. The transition towards a more sustainable and low-carbon energy system necessitates efficient management of intermittent renewable energy sources such as solar and wind power. Moreover, advanced software and control systems ensure efficient utilization of renewable energy, minimize curtailment, and enhance grid flexibility and resilience.
Restraint:
High initial costs
Implementing a VPP requires substantial upfront investments in hardware, software, and infrastructure. The high initial costs can deter potential investors and limit the adoption of VPPs, particularly for smaller organizations or those with limited financial resources, creating a barrier to entry. Furthermore, the complexity of VPP systems and the need for specialized technical expertise also contribute to the initial costs, which gradually impede this market size.
Opportunity:
Technological advancements
Cloud-based platforms and advanced software solutions enable seamless integration and aggregation of diverse DER portfolios, enhancing grid flexibility and resilience. Advances in digitalization, communication, and control technologies have revolutionized the way VPPs operate, allowing for real-time monitoring, control, and optimization of DERs. In addition, technological innovations in energy storage systems, such as lithium-ion batteries and flow batteries, have also played a crucial role in the growth of the VPP market.
Threat:
Lack of awareness and education
VPPs are a relatively new concept in the energy industry, and many potential stakeholders may have limited knowledge or understanding of their benefits and functionalities. Policymakers and regulators may have a limited understanding of the regulatory frameworks and market structures, resulting in a lack of supportive policies, regulations, and incentives. Moreover, this lack of awareness can lead to a reluctance to invest in or participate in VPP programs, hindering this market.
Covid-19 Impact
The COVID-19 pandemic has had several negative impacts on the virtual power plant (VPP) market, primarily due to disruptions in supply chains, project delays, and economic uncertainty. Travel restrictions, lockdown measures, and social distancing requirements have hindered site inspections, permitting processes, and construction activities. Furthermore, the pandemic has impacted energy markets, with reduced industrial activity and changes in consumer behavior leading to fluctuations in energy demand and pricing.
The software segment is expected to be the largest during the forecast period
The software segment is estimated to hold the largest share due to its pivotal role in orchestrating and optimizing the diverse array of distributed energy resources (DERs) that make up the VPP. These software platforms leverage advanced algorithms, artificial intelligence (AI), and machine learning (ML) techniques to forecast energy generation, consumption patterns, and market conditions. Moreover, these often feature user-friendly interfaces and dashboards that empower stakeholders, which are driving this segment's expansion.
The cloud-based segment is expected to have the highest CAGR during the forecast period
The cloud-based segment is anticipated to have highest CAGR during the forecast period, due to the use of remote servers hosted on the internet to manage and coordinate distributed energy resources (DERs). Cloud-based platforms offer several advantages, including scalability, accessibility, and real-time data processing capabilities. Furthermore, these solutions centralize the control and management of DERs, allowing efficient aggregation, optimization, and dispatch of resources to meet grid demand, thereby boosting this segment's growth.
Region with largest share:
Europe commanded the largest market share during the extrapolated period owing to the increasing deployment of renewable energy sources, advancements in digitalization technologies, and evolving energy market regulations. Countries such as Germany, the Netherlands, Denmark, and the United Kingdom are leveraging their mature renewable energy sectors and supportive regulatory frameworks. In addition, the region's ambitious renewable energy targets, along with the need to enhance grid flexibility and resilience, are driving demand for VPP solutions.
Region with highest CAGR:
North America is expected to witness highest CAGR over the projection period, owing to the region's diverse energy landscape, supportive regulatory environment, and market reforms. North America's VPP market is benefiting from advancements in data analytics and communication technologies, enabling real-time monitoring, control, and optimization. Furthermore, policy initiatives at the federal, state, and provincial levels are raising investments, incentivizing the adoption of clean energy technologies, and propelling the growth of this region.
Key players in the market
Some of the key players in the Virtual Power Plant Market include Next Kraftwerke, Siemens, Centrica, Tesla, Toshiba Energy Systems & Solutions, ABB, Sunverge Energy, Inc., Hitachi, Ltd., Limejump Limited, AutoGrid Systems, Inc., General Electric, Sonnen, Lumenaza GmbH, Schneider Electric and Shell.
Key Developments:
In March 2024, Hitachi Rail has announced the launch of Train Maintenance DX as a Service, the industry's first "as a Service" solution to improve the work environment and the quality of train maintenance for railway operators, using the digital expertise in train manufacturing.
In February 2024, Sysmex Corporation and Hitachi High-Tech Corporation, announce that both companies have agreed to collaborate in the development of genetic testing systems based on capillary electrophoresis sequencers.
In October 2023, SAP SE announced that Siemens Healthineers AG, a leading global medical technology company, has selected the RISE with SAP solution to support the company's digital transformation journey.
In September 2023, The International Atomic Energy Agency (IAEA) has joined forces with Siemens Healthineers to strengthen cancer diagnosis and treatment capacity in low- and middle-income countries, harnessing each other's technical expertise in new ways to combat the rising global burden of this disease that kills millions of people every year.
Component Types Covered:
- Hardware
- Software
- Services
- Other Component Types
Deployment Types Covered:
- On-premises
- Cloud-based
Sources Covered:
- Storage
- Renewable Energy
- Cogeneration
- Other Sources
Technologies Covered:
- Energy Storage
- Demand Response
- Combined Heat & Power (CHP)
- Distributed Energy Generation
- Other Technologies
Applications Covered:
- Frequency Regulation
- Energy Trading
- Peak Load Management
- Grid Balancing
- Other Applications
End Users Covered:
- Commercial
- Industrial
- Utilities
- Residential
- Other End Users
Regions Covered:
- North America
- US
- Canada
- Mexico
- Europe
- Germany
- UK
- Italy
- France
- Spain
- Rest of Europe
- Asia Pacific
- Japan
- China
- India
- Australia
- New Zealand
- South Korea
- Rest of Asia Pacific
- South America
- Argentina
- Brazil
- Chile
- Rest of South America
- Middle East & Africa
- Saudi Arabia
- UAE
- Qatar
- South Africa
- Rest of Middle East & Africa
What our report offers:
- Market share assessments for the regional and country-level segments
- Strategic recommendations for the new entrants
- Covers Market data for the years 2021, 2022, 2023, 2026, and 2030
- Market Trends (Drivers, Constraints, Opportunities, Threats, Challenges, Investment Opportunities, and recommendations)
- Strategic recommendations in key business segments based on the market estimations
- Competitive landscaping mapping the key common trends
- Company profiling with detailed strategies, financials, and recent developments
- Supply chain trends mapping the latest technological advancements
Free Customization Offerings:
All the customers of this report will be entitled to receive one of the following free customization options:
- Company Profiling
- Comprehensive profiling of additional market players (up to 3)
- SWOT Analysis of key players (up to 3)
- Regional Segmentation
- Market estimations, Forecasts and CAGR of any prominent country as per the client's interest (Note: Depends on feasibility check)
- Competitive Benchmarking
- Benchmarking of key players based on product portfolio, geographical presence, and strategic alliances
Table of Contents
1 Executive Summary
2 Preface
- 2.1 Abstract
- 2.2 Stake Holders
- 2.3 Research Scope
- 2.4 Research Methodology
- 2.4.1 Data Mining
- 2.4.2 Data Analysis
- 2.4.3 Data Validation
- 2.4.4 Research Approach
- 2.5 Research Sources
- 2.5.1 Primary Research Sources
- 2.5.2 Secondary Research Sources
- 2.5.3 Assumptions
3 Market Trend Analysis
- 3.1 Introduction
- 3.2 Drivers
- 3.3 Restraints
- 3.4 Opportunities
- 3.5 Threats
- 3.6 Technology Analysis
- 3.7 Application Analysis
- 3.8 End User Analysis
- 3.9 Emerging Markets
- 3.10 Impact of Covid-19
4 Porters Five Force Analysis
- 4.1 Bargaining power of suppliers
- 4.2 Bargaining power of buyers
- 4.3 Threat of substitutes
- 4.4 Threat of new entrants
- 4.5 Competitive rivalry
5 Global Virtual Power Plant Market, By Component Type
- 5.1 Introduction
- 5.2 Hardware
- 5.3 Software
- 5.4 Services
- 5.5 Other Component Types
6 Global Virtual Power Plant Market, By Deployment Type
- 6.1 Introduction
- 6.2 On-premises
- 6.3 Cloud-based
7 Global Virtual Power Plant Market, By Source
- 7.1 Introduction
- 7.2 Storage
- 7.3 Renewable Energy
- 7.4 Cogeneration
- 7.5 Other Sources
8 Global Virtual Power Plant Market, By Technology
- 8.1 Introduction
- 8.2 Energy Storage
- 8.3 Demand Response
- 8.4 Combined Heat & Power (CHP)
- 8.5 Distributed Energy Generation
- 8.6 Other Technologies
9 Global Virtual Power Plant Market, By Application
- 9.1 Introduction
- 9.2 Frequency Regulation
- 9.3 Energy Trading
- 9.4 Peak Load Management
- 9.5 Grid Balancing
- 9.6 Other Applications
10 Global Virtual Power Plant Market, By End User
- 10.1 Introduction
- 10.2 Commercial
- 10.3 Industrial
- 10.4 Utilities
- 10.5 Residential
- 10.6 Other End Users
11 Global Virtual Power Plant Market, By Geography
- 11.1 Introduction
- 11.2 North America
- 11.2.1 US
- 11.2.2 Canada
- 11.2.3 Mexico
- 11.3 Europe
- 11.3.1 Germany
- 11.3.2 UK
- 11.3.3 Italy
- 11.3.4 France
- 11.3.5 Spain
- 11.3.6 Rest of Europe
- 11.4 Asia Pacific
- 11.4.1 Japan
- 11.4.2 China
- 11.4.3 India
- 11.4.4 Australia
- 11.4.5 New Zealand
- 11.4.6 South Korea
- 11.4.7 Rest of Asia Pacific
- 11.5 South America
- 11.5.1 Argentina
- 11.5.2 Brazil
- 11.5.3 Chile
- 11.5.4 Rest of South America
- 11.6 Middle East & Africa
- 11.6.1 Saudi Arabia
- 11.6.2 UAE
- 11.6.3 Qatar
- 11.6.4 South Africa
- 11.6.5 Rest of Middle East & Africa
12 Key Developments
- 12.1 Agreements, Partnerships, Collaborations and Joint Ventures
- 12.2 Acquisitions & Mergers
- 12.3 New Product Launch
- 12.4 Expansions
- 12.5 Other Key Strategies
13 Company Profiling
- 13.1 Next Kraftwerke
- 13.2 Siemens
- 13.3 Centrica
- 13.4 Tesla
- 13.5 Toshiba Energy Systems & Solutions
- 13.6 ABB
- 13.7 Sunverge Energy, Inc.
- 13.8 Hitachi, Ltd.
- 13.9 Limejump Limited
- 13.10 AutoGrid Systems, Inc.
- 13.11 General Electric
- 13.12 Sonnen
- 13.13 Lumenaza GmbH
- 13.14 Schneider Electric
- 13.15 Shell


