|
|
市場調査レポート
商品コード
1438010
ホログラム市場の2030年までの予測: タイプ別、構成別、ホログラフィックイメージ別、用途別、技術別、エンドユーザー別、地域別の世界分析Hologram Market Forecasts to 2030 - Global Analysis By Type (Touchable Holograms, Electro Holographic, Photopolymer Holograms, Volume Holograms and Other Types), Component, Holographic Image, Usage, Technology, End User and By Geography |
||||||
|
|||||||
カスタマイズ可能
|
|||||||

| ホログラム市場の2030年までの予測: タイプ別、構成別、ホログラフィックイメージ別、用途別、技術別、エンドユーザー別、地域別の世界分析 |
|
出版日: 2024年02月02日
発行: Stratistics Market Research Consulting
ページ情報: 英文 200+ Pages
納期: 2~3営業日
|

全表示
- 概要
- 図表
- 目次
Stratistics MRCによると、世界のホログラム市場は2023年に23億米ドルを占め、予測期間中にCAGR 27.1%で成長し、2030年には124億米ドルに達すると予測されています。
ホログラム市場とは、ホログラフィック技術とソリューションの生産、市場開拓、商業化に関わる世界の産業を指します。ホログラムは、光線の干渉によって作られる3次元画像であり、リアルで没入感のある視覚体験を提供します。ホログラムは様々な産業で多様な用途があり、ビジュアル・コミュニケーションやセキュリティ対策に革命をもたらしています。
Integrated Micro-Electronics, Inc,社によると、韓国の研究者は人工知能(AI)を活用して2D医療用画像を没入型3Dホログラムに変換し、専用メガネなしで見ることができるようにしています。
強化された視覚体験への需要の高まり
消費者がますます没入的で魅力的なコンテンツを優先するようになるにつれ、ホログラフィック・ディスプレイはエンターテインメント、広告、小売などの分野で変革をもたらすソリューションとして浮上しています。ホログラムの3次元的でインタラクティブな性質は、従来のビジュアル・コミュニケーションに革命をもたらし、注目を集め、記憶に残るブランド・インタラクションを実現します。エンターテインメントでは、ホログラフィック技術が実物そっくりのパフォーマンスやイベントの作成に活用され、観客に前例のない視覚的スペクタクルを提供しています。さらに、より豊かで没入感のある視覚体験への嗜好が高まっているため、さまざまな用途でホログラムの採用が進んでいるだけでなく、消費者や企業の高まる期待に応えるため、ホログラフィック・ディスプレイ技術の絶え間ない革新も刺激しています。
高い初期コスト
ホログラフィック・ディスプレイの作成と展開に必要な洗練されたハードウェア、特殊なソフトウェア、熟練した人材は、多額の初期費用につながります。この経済的障壁は、中小企業にとって特に困難であり、ホログラフィック・ソリューションへの投資能力を制限します。ホログラフィック・コンテンツ制作のコストと高度な機器の必要性は、潜在的な採用企業が直面する経済的課題をさらに助長します。しかし、企業は初期投資と潜在的な利益を比較検討するため、コストが高いと認識されることがホログラフィック技術の普及を妨げ、様々な産業での採用率を鈍らせる可能性があります。
技術の進歩
ホログラフィック投影技術、拡張現実(AR)、仮想現実(VR)における継続的な技術革新は、ホログラフィック・アプリケーションと機能の拡大に貢献しています。空間光変調器やレーザーシステムなどの改良されたディスプレイ技術は、ホログラフィック画像の品質とリアリズムを向上させる。ホログラフィと人工知能(AI)や機械学習(ML)のような新技術との統合は、より洗練されたインタラクティブなホログラフィック体験を可能にします。さらに、このような技術的進歩は、ホログラムの視覚的魅力を高めるだけでなく、ヘルスケア、エンターテインメント、教育などの業界全体にわたってその有用性を広げています。
標準化の欠如
ホログラフィック・ディスプレイには普遍的に受け入れられたフォーマット、プロトコル、技術がないため、互換性の課題があります。この標準化の欠如は、データ交換、コンテンツ作成、ハードウェアの互換性に関連する問題に直面する可能性があるため、ホログラフィック・ソリューションの採用を求めるユーザーにとって困難な結果を招く可能性があります。標準化されたフレームワークの欠如は、多様なホログラフィック・プラットフォームでシームレスに動作するアプリケーションや製品を開発しようとする業界関係者にとっても障害となります。この制約に対処するには、業界内の協力的な取り組みによって共通の標準を確立し、よりまとまりのあるユーザーフレンドリーなホログラフィック・エコシステムを確保する必要があります。
COVID-19の影響
パンデミックは様々な産業でデジタル化の動向を加速させ、先端技術への関心を高めることにつながったが、同時に課題ももたらしました。世界経済の不確実性とサプライチェーンの混乱は、ホログラフィック機器の生産と流通に影響を与え、遅延とコスト増を引き起こす可能性があります。しかし、公共の集会やイベントに対する規制は、エンターテイメントなどの分野に影響を与え、コンサートやライブ・パフォーマンスへのホログラフィック・ディスプレイの展開を制限しています。
予測期間中、タッチ式ホログラム分野が最大になる見込み
タッチ可能なホログラム分野は、ホログラフィック・ディスプレイの没入的でインタラクティブな次元により、予測期間を通じて市場の最大シェアを占めると見られています。この最先端技術は、ユーザーがホログラフィック・プロジェクションと物理的に相互作用することを可能にし、より魅力的でリアルな体験を生み出します。ホログラフィック画像に触れたり操作したりする能力は、教育、ヘルスケア、エンターテイメントなどの分野でユーザーの関与を高める。企業は、インタラクティブな製品デモンストレーション、トレーニングシミュレーション、魅力的なプレゼンテーションにこの技術革新を活用しています。
予測期間中、デジタルホログラフィックディスプレイ分野のCAGRが最も高くなる見込み
デジタル・ホログラフィック・ディスプレイ分野は、予測期間中に収益性の高い成長を遂げると予測されています。この技術は、高度なデジタルアルゴリズムを利用して高解像度のフルカラーホログラフィックディスプレイを作成し、前例のない鮮明さとリアリズムを提供します。視野角や空間的制約など、ホログラフィックイメージングに関連する従来の制約を克服することで、デジタルホログラフィックディスプレイは、医療イメージングや自動車設計を含む多様な産業を変革しています。さらに、より鮮やかでインタラクティブなビジュアル・コンテンツへの需要が、このセグメントの急成長に拍車をかけています。企業も消費者も同様に、情報を提示し消費する革新的な方法を求めているからです。
最大のシェアを占める地域
アジア太平洋地域が、実現可能な期間で最大の市場シェアを占めています。急速な技術進歩と堅調な経済発展が相まって、様々な産業でホログラフィック・ソリューションの需要に拍車をかけています。中国、日本、韓国のような国々は、広告、エンターテインメント、ヘルスケアにまたがるホログラフィック・ディスプレイ・アプリケーションの急増を目の当たりにしています。この地域の強力な製造基盤と研究開発への投資は、費用対効果の高いホログラフィック・ディスプレイ・デバイスの製造に貢献し、普及を促進しています。
CAGRが最も高い地域
北米地域は、予測期間中に大幅な成長を維持すると予想されています。規制機関によって義務付けられた厳しい知的財産権保護と偽造防止対策が、業界全体におけるホログラフィックソリューションの広範な導入に寄与しています。さらに、政府のイニシアティブによる製品認証やセキュリティ機能の重視が、パッケージングや偽造防止アプリケーションにおけるホログラフィック技術の需要を促進しています。これらの要素が、この地域の成長を高めています。
無料のカスタマイズ提供
本レポートをご購読のお客様には、以下の無料カスタマイズオプションのいずれかをご利用いただけます:
- 企業プロファイル
- 追加市場プレーヤーの包括的プロファイリング(3社まで)
- 主要企業のSWOT分析(3社まで)
- 地域セグメンテーション
- 顧客の関心に応じた主要国の市場推計・予測・CAGR(注:フィージビリティチェックによる)
- 競合ベンチマーキング
- 製品ポートフォリオ、地理的プレゼンス、戦略的提携に基づく主要企業のベンチマーキング
目次
第1章 エグゼクティブサマリー
第2章 序文
- 概要
- ステークホルダー
- 調査範囲
- 調査手法
- データマイニング
- データ分析
- データ検証
- 調査アプローチ
- 調査ソース
- 1次調査ソース
- 2次調査ソース
- 前提条件
第3章 市場動向分析
- 促進要因
- 抑制要因
- 機会
- 脅威
- 技術分析
- エンドユーザー分析
- 新興市場
- 新型コロナウイルス感染症(COVID-19)の影響
第4章 ポーターのファイブフォース分析
- 供給企業の交渉力
- 買い手の交渉力
- 代替品の脅威
- 新規参入業者の脅威
- 競争企業間の敵対関係
第5章 世界のホログラム市場:種類別
- タッチできるホログラム
- 電子ホログラフィック
- フォトポリマーホログラム
- 体積ホログラム
- その他のタイプ
第6章 世界のホログラム市場:構成別
- ソフトウェア
- ハードウェア
- サービス
- その他の構成
第7章 世界のホログラム市場:ホログラフィック画像別
- ステレオグラム
- 3Dモデル
- 2Dモデル
- ドットマトリックス
- その他のホログラフィック画像
第8章 世界のホログラム市場:用途別
- デジタルホログラフィックディスプレイ
- デジタルホログラフィック顕微鏡
- その他の用途
第9章 世界のホログラム市場:技術別
- 半透明
- レーザ
- 反射型ホログラフィー
- 透過型ホログラフィー
- その他の技術
第10章 世界のホログラム市場:エンドユーザー別
- 病院と診療所
- 製薬会社およびバイオテクノロジー会社
- 自動車
- 家電
- 航空宇宙と防衛
- その他のエンドユーザー
第11章 世界のホログラム市場:地域別
- 北米
- 米国
- カナダ
- メキシコ
- 欧州
- ドイツ
- 英国
- イタリア
- フランス
- スペイン
- その他欧州
- アジア太平洋地域
- 日本
- 中国
- インド
- オーストラリア
- ニュージーランド
- 韓国
- その他アジア太平洋地域
- 南米
- アルゼンチン
- ブラジル
- チリ
- その他南米
- 中東とアフリカ
- サウジアラビア
- アラブ首長国連邦
- カタール
- 南アフリカ
- その他中東とアフリカ
第12章 主な発展
- 契約、パートナーシップ、コラボレーション、合弁事業
- 買収と合併
- 新製品の発売
- 事業拡大
- その他の主要戦略
第13章 企業プロファイル
- EchoPixel Inc
- Eon Reality Inc
- Holoxica Ltd
- Intel Corporation
- Jasper Display Corporation
- Looking Glass Factory Inc
- Lyncee Tec SA
- Lynx Laboratories
- Mach7 Technologies Ltd.
- Microsoft Corporation
- Ovizio Imaging Systems NV/SA
- Phase Holographic Imaging PHI AB
- Provision Interactive Technologies
- Qualcomm Technologies. Inc
- RealView Imaging Ltd
- Vision Optics GmbH
- zSpace. Inc
List of Tables
- Table 1 Global Hologram Market Outlook, By Region (2021-2030) ($MN)
- Table 2 Global Hologram Market Outlook, By Type (2021-2030) ($MN)
- Table 3 Global Hologram Market Outlook, By Touchable Holograms (2021-2030) ($MN)
- Table 4 Global Hologram Market Outlook, By Electro Holographic (2021-2030) ($MN)
- Table 5 Global Hologram Market Outlook, By Photopolymer Holograms (2021-2030) ($MN)
- Table 6 Global Hologram Market Outlook, By Volume Holograms (2021-2030) ($MN)
- Table 7 Global Hologram Market Outlook, By Other Types (2021-2030) ($MN)
- Table 8 Global Hologram Market Outlook, By Component (2021-2030) ($MN)
- Table 9 Global Hologram Market Outlook, By Software (2021-2030) ($MN)
- Table 10 Global Hologram Market Outlook, By Hardware (2021-2030) ($MN)
- Table 11 Global Hologram Market Outlook, By Service (2021-2030) ($MN)
- Table 12 Global Hologram Market Outlook, By Other Components (2021-2030) ($MN)
- Table 13 Global Hologram Market Outlook, By Holographic Image (2021-2030) ($MN)
- Table 14 Global Hologram Market Outlook, By Stereograms (2021-2030) ($MN)
- Table 15 Global Hologram Market Outlook, By 3D Models (2021-2030) ($MN)
- Table 16 Global Hologram Market Outlook, By 2D Models (2021-2030) ($MN)
- Table 17 Global Hologram Market Outlook, By Dot Matrix (2021-2030) ($MN)
- Table 18 Global Hologram Market Outlook, By Other Holographic Images (2021-2030) ($MN)
- Table 19 Global Hologram Market Outlook, By Usage (2021-2030) ($MN)
- Table 20 Global Hologram Market Outlook, By Digital Holographic Display (2021-2030) ($MN)
- Table 21 Global Hologram Market Outlook, By Digital Holographic Microscopy (2021-2030) ($MN)
- Table 22 Global Hologram Market Outlook, By Other Usages (2021-2030) ($MN)
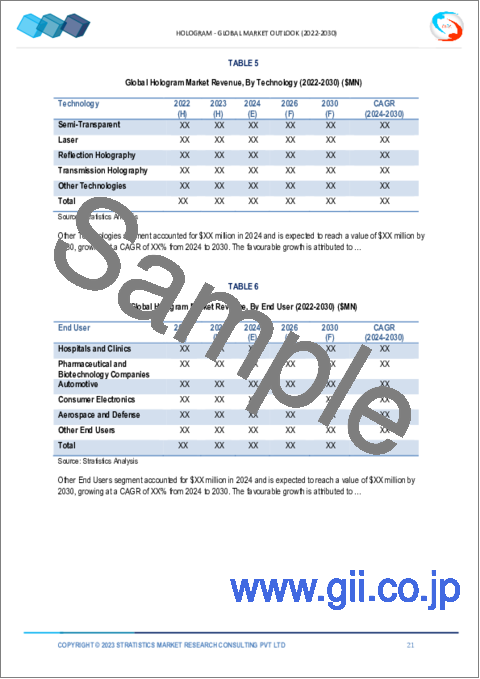
- Table 23 Global Hologram Market Outlook, By Technology (2021-2030) ($MN)
- Table 24 Global Hologram Market Outlook, By Semi-Transparent (2021-2030) ($MN)
- Table 25 Global Hologram Market Outlook, By Laser (2021-2030) ($MN)
- Table 26 Global Hologram Market Outlook, By Reflection Holography (2021-2030) ($MN)
- Table 27 Global Hologram Market Outlook, By Transmission Holography (2021-2030) ($MN)
- Table 28 Global Hologram Market Outlook, By Other Technologies (2021-2030) ($MN)
- Table 29 Global Hologram Market Outlook, By End User (2021-2030) ($MN)
- Table 30 Global Hologram Market Outlook, By Hospitals and Clinics (2021-2030) ($MN)
- Table 31 Global Hologram Market Outlook, By Pharmaceutical and Biotechnology Companies (2021-2030) ($MN)
- Table 32 Global Hologram Market Outlook, By Automotive (2021-2030) ($MN)
- Table 33 Global Hologram Market Outlook, By Consumer Electronics (2021-2030) ($MN)
- Table 34 Global Hologram Market Outlook, By Aerospace and Defense (2021-2030) ($MN)
- Table 35 Global Hologram Market Outlook, By Other End Users (2021-2030) ($MN)
Note: Tables for North America, Europe, APAC, South America, and Middle East & Africa Regions are also represented in the same manner as above.
According to Stratistics MRC, the Global Hologram Market is accounted for $2.3 billion in 2023 and is expected to reach $12.4 billion by 2030 growing at a CAGR of 27.1% during the forecast period. The hologram market refers to the global industry involved in the production, development, and commercialization of holographic technology and solutions. Holograms are three-dimensional images created through the interference of light beams, providing a realistic and immersive visual experience. The hologram has diversified applications across various industries, revolutionizing visual communication and security measures.
According to Integrated Micro-Electronics, Inc, researchers in South Korea are leveraging artificial intelligence (AI) to convert 2D medical imaging into immersive 3D holograms that can be viewed without the need for specialized glasses.
Market Dynamics:
Driver:
Increasing demand for enhanced visual experiences
As consumers increasingly prioritize immersive and captivating content, holographic displays emerge as a transformative solution in sectors such as entertainment, advertising, and retail. The three-dimensional and interactive nature of holograms revolutionizes traditional visual communication, capturing attention and delivering memorable brand interactions. In entertainment, holographic technology is leveraged for creating lifelike performances and events, providing audiences with unprecedented visual spectacles. Moreover, due to the growing preference for richer, more immersive visual experiences not only drives the adoption of holograms in various applications but also stimulates continuous innovation in holographic display technologies to meet the escalating expectations of consumers and businesses alike.
Restraint:
High initial costs
The sophisticated hardware, specialized software, and skilled personnel required for creating and deploying holographic displays contribute to substantial upfront expenses. This financial barrier can be particularly daunting for small and medium-sized enterprises, limiting their ability to invest in holographic solutions. The cost of holographic content creation and the need for advanced equipment further contribute to the economic challenges faced by potential adopters. However, as businesses weigh the potential benefits against the initial investment, the perceived high costs may impede the widespread integration of holographic technology, slowing down its adoption rate across various industries.
Opportunity:
Advancements in technology
Ongoing innovations in holographic projection techniques, augmented reality (AR), and virtual reality (VR) contribute to the expansion of holographic applications and capabilities. Improved display technologies, such as spatial light modulators and laser systems, enhance the quality and realism of holographic images. The integration of holography with emerging technologies like artificial intelligence (AI) and machine learning (ML) enables more sophisticated and interactive holographic experiences. Furthermore, these technological strides not only enhance the visual appeal of holograms but also broaden their utility across industries, including healthcare, entertainment, and education.
Threat:
Lack of standardization
The absence of universally accepted formats, protocols, and technologies in holographic displays leads to compatibility challenges. This lack of standardization can result in difficulties for users seeking to adopt holographic solutions, as they may face issues related to data exchange, content creation, and hardware compatibility. The absence of a standardized framework also poses obstacles for industry players looking to develop applications and products that can work seamlessly across diverse holographic platforms. Addressing this constraint requires collaborative efforts within the industry to establish common standards, ensuring a more cohesive and user-friendly holographic ecosystem.
Covid-19 Impact:
While the pandemic has accelerated the digitization trends across various industries, leading to increased interest in advanced technologies, it has also posed challenges. The global economic uncertainties and disruptions in supply chains have affected the production and distribution of holographic equipment, potentially causing delays and increased costs. However, the restrictions on public gatherings and events have impacted sectors like entertainment, limiting the deployment of holographic displays for concerts and live performances.
The touchable holograms segment is expected to be the largest during the forecast period
Touchable Holograms segment is poised to hold the largest share of the market throughout the extrapolated period due to an immersive and interactive dimension to holographic displays. This cutting-edge technology allows users to physically interact with holographic projections, creating a more engaging and realistic experience. The ability to touch and manipulate holographic images enhances user involvement in sectors such as education, healthcare, and entertainment. Businesses are leveraging this innovation for interactive product demonstrations, training simulations, and engaging presentations.
The digital holographic display segment is expected to have the highest CAGR during the forecast period
Digital Holographic Display segment is estimated to witness profitable growth during the projection period. This technology utilizes advanced digital algorithms to create high-resolution, full-color holographic displays that offer unprecedented clarity and realism. By overcoming traditional limitations associated with holographic imaging, such as viewing angles and spatial restrictions, digital holographic displays are transforming diverse industries, including medical imaging and automotive design. Additionally, the demand for more vibrant and interactive visual content has fueled the rapid growth of this segment, as businesses and consumers alike seek innovative ways to present and consume information.
Region with largest share:
Asia Pacific region commanded the largest market share over the feasible time frame. Rapid technological advancements, coupled with robust economic development, have spurred the demand for holographic solutions across various industries. Countries like China, Japan, and South Korea are witnessing a surge in holographic display applications, spanning advertising, entertainment, and healthcare. The region's strong manufacturing base and investment in research and development contribute to the production of cost-effective holographic display devices, fostering widespread accessibility.
Region with highest CAGR:
North America region is expected to hold the substantial growth during the forecasted period. Stringent intellectual property protection and anti-counterfeiting measures mandated by regulatory bodies contribute to the widespread implementation of holographic solutions across industries. Additionally, the emphasis on product authentication and security features, driven by government initiatives, fuels the demand for holographic technologies in packaging and anti-counterfeiting applications. These elements are enhancing the regional growth.
Key players in the market
Some of the key players in Hologram market include EchoPixel Inc, Eon Reality Inc, Google, Holoxica Ltd, Intel Corporation, Jasper Display Corporation, Looking Glass Factory Inc, Lyncee Tec SA, Lynx Laboratories, Mach7 Technologies Ltd., Microsoft Corporation, Ovizio Imaging Systems NV/SA, Phase Holographic Imaging PHI AB, Provision Interactive Technologies, Qualcomm Technologies. Inc, RealView Imaging Ltd, Vision Optics GmbH and zSpace. Inc.
Key Developments:
In December 2023, Looking Glass Factory kickstarts first portable holographic display. The Looking Glass Factory brought personal holographic imagery to the desktop back in 2020 with the launch of the Portrait.
In February 2023, Accenture has made a strategic investment through Accenture Ventures in Looking Glass Factory, a leading hologram company. Growing consumer and business interest in the metaverse as a creator economy and tool to enhance day-to-day tasks is expected to fuel a $1 trillion revenue opportunity by the end of 2025, according to Accenture findings released in January 2023. Technology like Looking Glass offers the opportunity to connect 3D digital experiences in the metaverse to the physical world.
Types Covered:
- Touchable Holograms
- Electro Holographic
- Photopolymer Holograms
- Volume Holograms
- Other Types
Components Covered:
- Software
- Hardware
- Service
- Other Components
Holographic Images Covered:
- Stereograms
- 3D Models
- 2D Models
- Dot Matrix
- Other Holographic Images
Usages Covered:
- Digital Holographic Display
- Digital Holographic Microscopy
- Other Usages
Technologies Covered:
- Semi-Transparent
- Laser
- Reflection Holography
- Transmission Holography
- Other Technologies
End Users Covered:
- Hospitals and Clinics
- Pharmaceutical and Biotechnology Companies
- Automotive
- Consumer Electronics
- Aerospace and Defense
- Other End Users
Regions Covered:
- North America
- US
- Canada
- Mexico
- Europe
- Germany
- UK
- Italy
- France
- Spain
- Rest of Europe
- Asia Pacific
- Japan
- China
- India
- Australia
- New Zealand
- South Korea
- Rest of Asia Pacific
- South America
- Argentina
- Brazil
- Chile
- Rest of South America
- Middle East & Africa
- Saudi Arabia
- UAE
- Qatar
- South Africa
- Rest of Middle East & Africa
What our report offers:
- Market share assessments for the regional and country-level segments
- Strategic recommendations for the new entrants
- Covers Market data for the years 2021, 2022, 2023, 2026, and 2030
- Market Trends (Drivers, Constraints, Opportunities, Threats, Challenges, Investment Opportunities, and recommendations)
- Strategic recommendations in key business segments based on the market estimations
- Competitive landscaping mapping the key common trends
- Company profiling with detailed strategies, financials, and recent developments
- Supply chain trends mapping the latest technological advancements
Free Customization Offerings:
All the customers of this report will be entitled to receive one of the following free customization options:
- Company Profiling
- Comprehensive profiling of additional market players (up to 3)
- SWOT Analysis of key players (up to 3)
- Regional Segmentation
- Market estimations, Forecasts and CAGR of any prominent country as per the client's interest (Note: Depends on feasibility check)
- Competitive Benchmarking
- Benchmarking of key players based on product portfolio, geographical presence, and strategic alliances
Table of Contents
1 Executive Summary
2 Preface
- 2.1 Abstract
- 2.2 Stake Holders
- 2.3 Research Scope
- 2.4 Research Methodology
- 2.4.1 Data Mining
- 2.4.2 Data Analysis
- 2.4.3 Data Validation
- 2.4.4 Research Approach
- 2.5 Research Sources
- 2.5.1 Primary Research Sources
- 2.5.2 Secondary Research Sources
- 2.5.3 Assumptions
3 Market Trend Analysis
- 3.1 Introduction
- 3.2 Drivers
- 3.3 Restraints
- 3.4 Opportunities
- 3.5 Threats
- 3.6 Technology Analysis
- 3.7 End User Analysis
- 3.8 Emerging Markets
- 3.9 Impact of Covid-19
4 Porters Five Force Analysis
- 4.1 Bargaining power of suppliers
- 4.2 Bargaining power of buyers
- 4.3 Threat of substitutes
- 4.4 Threat of new entrants
- 4.5 Competitive rivalry
5 Global Hologram Market, By Type
- 5.1 Introduction
- 5.2 Touchable Holograms
- 5.3 Electro Holographic
- 5.4 Photopolymer Holograms
- 5.5 Volume Holograms
- 5.6 Other Types
6 Global Hologram Market, By Component
- 6.1 Introduction
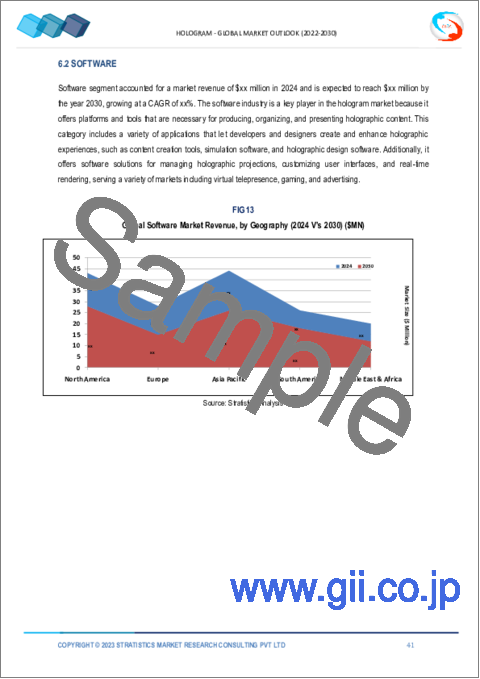
- 6.2 Software
- 6.3 Hardware
- 6.4 Service
- 6.5 Other Components
7 Global Hologram Market, By Holographic Image
- 7.1 Introduction
- 7.2 Stereograms
- 7.3 3D Models
- 7.4 2D Models
- 7.5 Dot Matrix
- 7.6 Other Holographic Images
8 Global Hologram Market, By Usage
- 8.1 Introduction
- 8.2 Digital Holographic Display
- 8.3 Digital Holographic Microscopy
- 8.4 Other Usages
9 Global Hologram Market, By Technology
- 9.1 Introduction
- 9.2 Semi-Transparent
- 9.3 Laser
- 9.4 Reflection Holography
- 9.5 Transmission Holography
- 9.6 Other Technologies
10 Global Hologram Market, By End User
- 10.1 Introduction
- 10.2 Hospitals and Clinics
- 10.3 Pharmaceutical and Biotechnology Companies
- 10.4 Automotive
- 10.5 Consumer Electronics
- 10.6 Aerospace and Defense
- 10.7 Other End Users
11 Global Hologram Market, By Geography
- 11.1 Introduction
- 11.2 North America
- 11.2.1 US
- 11.2.2 Canada
- 11.2.3 Mexico
- 11.3 Europe
- 11.3.1 Germany
- 11.3.2 UK
- 11.3.3 Italy
- 11.3.4 France
- 11.3.5 Spain
- 11.3.6 Rest of Europe
- 11.4 Asia Pacific
- 11.4.1 Japan
- 11.4.2 China
- 11.4.3 India
- 11.4.4 Australia
- 11.4.5 New Zealand
- 11.4.6 South Korea
- 11.4.7 Rest of Asia Pacific
- 11.5 South America
- 11.5.1 Argentina
- 11.5.2 Brazil
- 11.5.3 Chile
- 11.5.4 Rest of South America
- 11.6 Middle East & Africa
- 11.6.1 Saudi Arabia
- 11.6.2 UAE
- 11.6.3 Qatar
- 11.6.4 South Africa
- 11.6.5 Rest of Middle East & Africa
12 Key Developments
- 12.1 Agreements, Partnerships, Collaborations and Joint Ventures
- 12.2 Acquisitions & Mergers
- 12.3 New Product Launch
- 12.4 Expansions
- 12.5 Other Key Strategies
13 Company Profiling
- 13.1 EchoPixel Inc
- 13.2 Eon Reality Inc
- 13.3 Google
- 13.4 Holoxica Ltd
- 13.5 Intel Corporation
- 13.6 Jasper Display Corporation
- 13.7 Looking Glass Factory Inc
- 13.8 Lyncee Tec SA
- 13.9 Lynx Laboratories
- 13.10 Mach7 Technologies Ltd.
- 13.11 Microsoft Corporation
- 13.12 Ovizio Imaging Systems NV/SA
- 13.13 Phase Holographic Imaging PHI AB
- 13.14 Provision Interactive Technologies
- 13.15 Qualcomm Technologies. Inc
- 13.16 RealView Imaging Ltd
- 13.17 Vision Optics GmbH
- 13.18 zSpace. Inc

