|
|
市場調査レポート
商品コード
1403550
化学品市場の2030年までの予測:タイプ別、エンドユーザー別、地域別の世界分析Chemical Market Forecasts to 2030 - Global Analysis By Type (Specialty Chemicals, Fine Chemicals, Consumer Chemicals, Basic Chemicals and Other Types), End User and By Geography |
||||||
|
|||||||
カスタマイズ可能
|
|||||||

| 化学品市場の2030年までの予測:タイプ別、エンドユーザー別、地域別の世界分析 |
|
出版日: 2024年01月01日
発行: Stratistics Market Research Consulting
ページ情報: 英文 200+ Pages
納期: 2~3営業日
|

全表示
- 概要
- 図表
- 目次
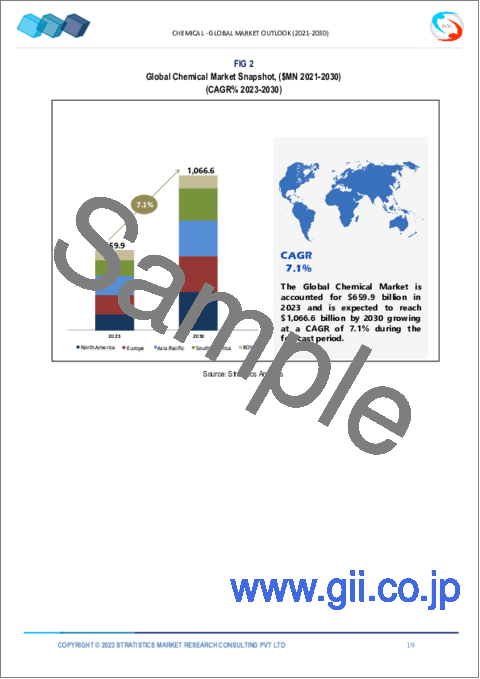
Stratistics MRCによると、世界の化学品市場は2023年に6,599億米ドルを占め、予測期間中のCAGRは7.1%で成長し、2030年には1兆666億米ドルに達すると予想されています。
化学製品は、食品、石油・ガス、繊維、インク添加剤、建築、添加剤用添加剤など、さまざまな分野に役立つものです。これらは、たった1つの成分からなる混合物であったり、顧客の製品がどのように機能するかに影響するものであったりします。これらは機能性や性能に応じて使用されます。
India Brands Equity Foundationが発表した報告書によると、2020年4月から2021年6月までの化学セクターへの直接投資流入額は186億9,000万米ドルに達しました。
特殊化学品へのニーズの高まり
特定の用途に使用される高性能・高価値の物質である特殊化学品には、かなりの需要があります。これらは、バイオテクノロジー、エレクトロニクス、航空宇宙など、特殊で高度な市場に頻繁に供給されています。これらの分野に特化した高度に専門化された化学物質のニーズは、技術向上の結果として高まっています。市場は、最先端材料とカスタマイズされたソリューションに対する需要の高まりによって牽引されています。
環境規制
化学品事業に関連する環境規制は、排出物、廃棄物、公害の削減を目標に、ますます厳しくなっています。これらの法律を遵守するためには、機械、手順、廃棄システムに多額の出費が必要となります。従来の化学製品や化学プロセスもまた、持続可能性への懸念や、より環境に優しい代替品の追求という課題に直面しています。これらが市場拡大を制限する要因となっています。
技術の進歩
革新と技術の進歩は、化学分野に大きな影響を与えてきました。バイオテクノロジーやナノテクノロジーを含む新しい製造技術の結果、新しい商品や用途が開発されてきました。さらに、触媒、プロセスの最適化、化学合成の開発により、生産性が向上し、新規化学製品の創出に新たな道が開かれました。これらが市場拡大の原動力となっています。
原料価格の変動
天然ガス、石油、その他の基礎鉱物は、化学部門の主要な供給源です。化学工場の収益性は、特定の原材料価格の変動によって影響を受ける可能性があります。市場変動、需給力学、地政学的緊張は、価格変動に影響を与える可能性のある変数のいくつかの例です。これは、市場の拡大を妨げている主な側面です。
COVID-19の影響:
COVID-19の流行により、世界の特殊化学品のバリューチェーンは混乱しました。化学品の生産量と需要の減少は、世界各地の化学品生産施設の一時的な閉鎖や、商品の輸送制限に反映されました。特殊化学品を使用するセクターからの需要は、これらの材料の生産と使用の両方に大きな影響を与えます。
予測期間中、特殊化学品分野が最大となる見込み
予測期間中、特殊化学品分野が最大となる見込みです。これは、プロセス技術の発展、貿易の自由化、エレクトロニクス、水処理、建築に使用される化学薬品に対する需要の高まりによるものです。嗜好品や香水、食品・飼料添加物、医薬品などのニーズが高まっていることも、この発展に寄与しています。加工食品や飲料が先進工業国で一般的になるにつれ、香料に対するニーズも高まっています。
予測期間中、飲食品分野のCAGRが最も高くなると予想されます。
この地域の飲食品産業は、食品貿易への依存、世界の嗜好、消費者の嗜好とライフスタイルの変化、戦略的な地理的位置、湾岸諸国の食品プログラムなど、多くの要因に大きく起因しています。また、今後数年間は、こうした要因が特殊化学品の需要を押し上げると予想されます。
最大のシェアを占める地域:
北米は、注力と投資の増加により、予測期間中最大の市場シェアを占めると予測されます。温室効果ガス排出量の削減、循環型経済原則の推進、従来型化学物質のバイオベース代替品の採用が重視されるようになり、持続可能性と環境プロジェクトの最前線となっています。同市場は、投資の増加、熾烈な競争、複数の化学製造事業の存在などの要因によって牽引されると予想されます。
CAGRが最も高い地域:
アジア太平洋地域は、製造業の増加、一人当たりの可処分所得の増加、自動車、建設、電気・電子などの分野の拡大により、予測期間中最も高いCAGRを維持すると予測されます。経済発展、工業化、重要な最終用途産業の拡大がその原因です。化学産業は、他の主要化学生産国よりも速いペースで拡大しています。
無料カスタマイズサービス:
本レポートをご購読のお客様には、以下の無料カスタマイズオプションのいずれかをご利用いただけます:
- 企業プロファイル
- 追加市場企業の包括的プロファイリング(3社まで)
- 主要企業のSWOT分析(3社まで)
- 地域セグメンテーション
- 顧客の関心に応じた主要国の市場推計・予測・CAGR(注:フィージビリティチェックによる)
- 競合ベンチマーキング
- 製品ポートフォリオ、地理的プレゼンス、戦略的提携に基づく主要企業のベンチマーキング
目次
第1章 エグゼクティブサマリー
第2章 序文
- 概要
- ステークホルダー
- 調査範囲
- 調査手法
- データマイニング
- データ分析
- データ検証
- 調査アプローチ
- 調査ソース
- 1次調査ソース
- 2次調査ソース
- 前提条件
第3章 市場動向分析
- 促進要因
- 抑制要因
- 機会
- 脅威
- エンドユーザー分析
- 新興市場
- 新型コロナウイルス感染症(COVID-19)の影響
第4章 ポーターのファイブフォース分析
- 供給企業の交渉力
- 買い手の交渉力
- 代替品の脅威
- 新規参入業者の脅威
- 競争企業間の敵対関係
第5章 世界の化学品市場:タイプ別
- 特殊化学品
- ファインケミカル
- 消費者向け化学品
- 基礎化学品
- その他のタイプ
第6章 世界の化学品市場:エンドユーザー別
- 消費財
- 医薬品
- 農薬
- 産業用
- パーソナルケア
- 食品・飲料
- 建設
- 塗料・コーティング
- 自動車
- テキスタイル
- その他のエンドユーザー
第7章 世界の化学品市場:地域別
- 北米
- 米国
- カナダ
- メキシコ
- 欧州
- ドイツ
- 英国
- イタリア
- フランス
- スペイン
- その他の欧州
- アジア太平洋
- 日本
- 中国
- インド
- オーストラリア
- ニュージーランド
- 韓国
- その他のアジア太平洋
- 南米
- アルゼンチン
- ブラジル
- チリ
- その他の南米
- 中東・アフリカ
- サウジアラビア
- アラブ首長国連邦
- カタール
- 南アフリカ
- その他の中東・アフリカ
第8章 主な発展
- 契約、パートナーシップ、コラボレーション、合弁事業
- 買収と合併
- 新製品の発売
- 事業拡大
- その他の主要戦略
第9章 企業プロファイル
- BASF SE
- Dow Chemical Company
- EChemicalonMobil
- DuPont de Nemours, Inc.
- Linde plc
- Bayer AG
- Mitsubishi Chemical Corporation
- Eastman Chemical Company
- Evonik Industries
- Clariant
- Lanxess
- Air Products and Chemicals, Inc.
- Borealis AG
- LyondellBasell
- SABIC
- 3M Company
- Ansell Limited
List of Tables
- Table 1 Global Chemical Market Outlook, By Region (2021-2030) ($MN)
- Table 2 Global Chemical Market Outlook, By Type (2021-2030) ($MN)
- Table 3 Global Chemical Market Outlook, By Specialty Chemicals (2021-2030) ($MN)
- Table 4 Global Chemical Market Outlook, By Fine Chemicals (2021-2030) ($MN)
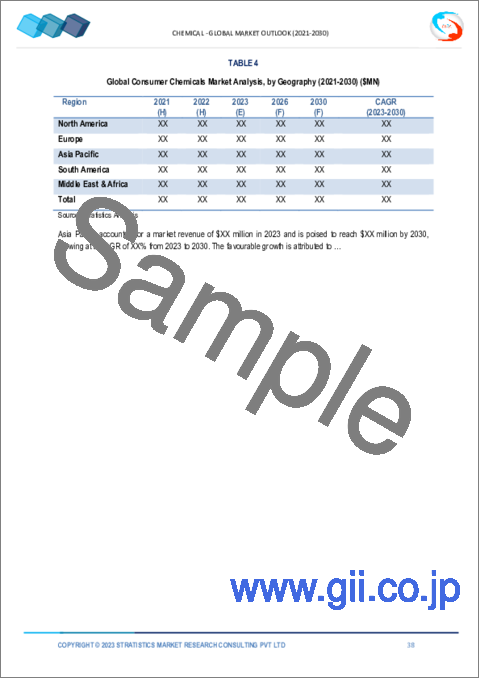
- Table 5 Global Chemical Market Outlook, By Consumer Chemicals (2021-2030) ($MN)
- Table 6 Global Chemical Market Outlook, By Basic Chemicals (2021-2030) ($MN)
- Table 7 Global Chemical Market Outlook, By Other Types (2021-2030) ($MN)
- Table 8 Global Chemical Market Outlook, By End User (2021-2030) ($MN)
- Table 9 Global Chemical Market Outlook, By Consumer Goods (2021-2030) ($MN)
- Table 10 Global Chemical Market Outlook, By Pharmaceuticals (2021-2030) ($MN)
- Table 11 Global Chemical Market Outlook, By Agrochemicals (2021-2030) ($MN)
- Table 12 Global Chemical Market Outlook, By Industrial (2021-2030) ($MN)
- Table 13 Global Chemical Market Outlook, By Personal Care (2021-2030) ($MN)
- Table 14 Global Chemical Market Outlook, By Food & Beverage (2021-2030) ($MN)
- Table 15 Global Chemical Market Outlook, By Construction (2021-2030) ($MN)
- Table 16 Global Chemical Market Outlook, By Paints and Coatings (2021-2030) ($MN)
- Table 17 Global Chemical Market Outlook, By Automotive (2021-2030) ($MN)
- Table 18 Global Chemical Market Outlook, By Textiles (2021-2030) ($MN)
- Table 19 Global Chemical Market Outlook, By Other End Users (2021-2030) ($MN)
- Table 20 North America Chemical Market Outlook, By Country (2021-2030) ($MN)
- Table 21 North America Chemical Market Outlook, By Type (2021-2030) ($MN)
- Table 22 North America Chemical Market Outlook, By Specialty Chemicals (2021-2030) ($MN)
- Table 23 North America Chemical Market Outlook, By Fine Chemicals (2021-2030) ($MN)
- Table 24 North America Chemical Market Outlook, By Consumer Chemicals (2021-2030) ($MN)
- Table 25 North America Chemical Market Outlook, By Basic Chemicals (2021-2030) ($MN)
- Table 26 North America Chemical Market Outlook, By Other Types (2021-2030) ($MN)
- Table 27 North America Chemical Market Outlook, By End User (2021-2030) ($MN)
- Table 28 North America Chemical Market Outlook, By Consumer Goods (2021-2030) ($MN)
- Table 29 North America Chemical Market Outlook, By Pharmaceuticals (2021-2030) ($MN)
- Table 30 North America Chemical Market Outlook, By Agrochemicals (2021-2030) ($MN)
- Table 31 North America Chemical Market Outlook, By Industrial (2021-2030) ($MN)
- Table 32 North America Chemical Market Outlook, By Personal Care (2021-2030) ($MN)
- Table 33 North America Chemical Market Outlook, By Food & Beverage (2021-2030) ($MN)
- Table 34 North America Chemical Market Outlook, By Construction (2021-2030) ($MN)
- Table 35 North America Chemical Market Outlook, By Paints and Coatings (2021-2030) ($MN)
- Table 36 North America Chemical Market Outlook, By Automotive (2021-2030) ($MN)
- Table 37 North America Chemical Market Outlook, By Textiles (2021-2030) ($MN)
- Table 38 North America Chemical Market Outlook, By Other End Users (2021-2030) ($MN)
- Table 39 Europe Chemical Market Outlook, By Country (2021-2030) ($MN)
- Table 40 Europe Chemical Market Outlook, By Type (2021-2030) ($MN)
- Table 41 Europe Chemical Market Outlook, By Specialty Chemicals (2021-2030) ($MN)
- Table 42 Europe Chemical Market Outlook, By Fine Chemicals (2021-2030) ($MN)
- Table 43 Europe Chemical Market Outlook, By Consumer Chemicals (2021-2030) ($MN)
- Table 44 Europe Chemical Market Outlook, By Basic Chemicals (2021-2030) ($MN)
- Table 45 Europe Chemical Market Outlook, By Other Types (2021-2030) ($MN)
- Table 46 Europe Chemical Market Outlook, By End User (2021-2030) ($MN)
- Table 47 Europe Chemical Market Outlook, By Consumer Goods (2021-2030) ($MN)
- Table 48 Europe Chemical Market Outlook, By Pharmaceuticals (2021-2030) ($MN)
- Table 49 Europe Chemical Market Outlook, By Agrochemicals (2021-2030) ($MN)
- Table 50 Europe Chemical Market Outlook, By Industrial (2021-2030) ($MN)
- Table 51 Europe Chemical Market Outlook, By Personal Care (2021-2030) ($MN)
- Table 52 Europe Chemical Market Outlook, By Food & Beverage (2021-2030) ($MN)
- Table 53 Europe Chemical Market Outlook, By Construction (2021-2030) ($MN)
- Table 54 Europe Chemical Market Outlook, By Paints and Coatings (2021-2030) ($MN)
- Table 55 Europe Chemical Market Outlook, By Automotive (2021-2030) ($MN)
- Table 56 Europe Chemical Market Outlook, By Textiles (2021-2030) ($MN)
- Table 57 Europe Chemical Market Outlook, By Other End Users (2021-2030) ($MN)
- Table 58 Asia Pacific Chemical Market Outlook, By Country (2021-2030) ($MN)
- Table 59 Asia Pacific Chemical Market Outlook, By Type (2021-2030) ($MN)
- Table 60 Asia Pacific Chemical Market Outlook, By Specialty Chemicals (2021-2030) ($MN)
- Table 61 Asia Pacific Chemical Market Outlook, By Fine Chemicals (2021-2030) ($MN)
- Table 62 Asia Pacific Chemical Market Outlook, By Consumer Chemicals (2021-2030) ($MN)
- Table 63 Asia Pacific Chemical Market Outlook, By Basic Chemicals (2021-2030) ($MN)
- Table 64 Asia Pacific Chemical Market Outlook, By Other Types (2021-2030) ($MN)
- Table 65 Asia Pacific Chemical Market Outlook, By End User (2021-2030) ($MN)
- Table 66 Asia Pacific Chemical Market Outlook, By Consumer Goods (2021-2030) ($MN)
- Table 67 Asia Pacific Chemical Market Outlook, By Pharmaceuticals (2021-2030) ($MN)
- Table 68 Asia Pacific Chemical Market Outlook, By Agrochemicals (2021-2030) ($MN)
- Table 69 Asia Pacific Chemical Market Outlook, By Industrial (2021-2030) ($MN)
- Table 70 Asia Pacific Chemical Market Outlook, By Personal Care (2021-2030) ($MN)
- Table 71 Asia Pacific Chemical Market Outlook, By Food & Beverage (2021-2030) ($MN)
- Table 72 Asia Pacific Chemical Market Outlook, By Construction (2021-2030) ($MN)
- Table 73 Asia Pacific Chemical Market Outlook, By Paints and Coatings (2021-2030) ($MN)
- Table 74 Asia Pacific Chemical Market Outlook, By Automotive (2021-2030) ($MN)
- Table 75 Asia Pacific Chemical Market Outlook, By Textiles (2021-2030) ($MN)
- Table 76 Asia Pacific Chemical Market Outlook, By Other End Users (2021-2030) ($MN)
- Table 77 South America Chemical Market Outlook, By Country (2021-2030) ($MN)
- Table 78 South America Chemical Market Outlook, By Type (2021-2030) ($MN)
- Table 79 South America Chemical Market Outlook, By Specialty Chemicals (2021-2030) ($MN)
- Table 80 South America Chemical Market Outlook, By Fine Chemicals (2021-2030) ($MN)
- Table 81 South America Chemical Market Outlook, By Consumer Chemicals (2021-2030) ($MN)
- Table 82 South America Chemical Market Outlook, By Basic Chemicals (2021-2030) ($MN)
- Table 83 South America Chemical Market Outlook, By Other Types (2021-2030) ($MN)
- Table 84 South America Chemical Market Outlook, By End User (2021-2030) ($MN)
- Table 85 South America Chemical Market Outlook, By Consumer Goods (2021-2030) ($MN)
- Table 86 South America Chemical Market Outlook, By Pharmaceuticals (2021-2030) ($MN)
- Table 87 South America Chemical Market Outlook, By Agrochemicals (2021-2030) ($MN)
- Table 88 South America Chemical Market Outlook, By Industrial (2021-2030) ($MN)
- Table 89 South America Chemical Market Outlook, By Personal Care (2021-2030) ($MN)
- Table 90 South America Chemical Market Outlook, By Food & Beverage (2021-2030) ($MN)
- Table 91 South America Chemical Market Outlook, By Construction (2021-2030) ($MN)
- Table 92 South America Chemical Market Outlook, By Paints and Coatings (2021-2030) ($MN)
- Table 93 South America Chemical Market Outlook, By Automotive (2021-2030) ($MN)
- Table 94 South America Chemical Market Outlook, By Textiles (2021-2030) ($MN)
- Table 95 South America Chemical Market Outlook, By Other End Users (2021-2030) ($MN)
- Table 96 Middle East & Africa Chemical Market Outlook, By Country (2021-2030) ($MN)
- Table 97 Middle East & Africa Chemical Market Outlook, By Type (2021-2030) ($MN)
- Table 98 Middle East & Africa Chemical Market Outlook, By Specialty Chemicals (2021-2030) ($MN)
- Table 99 Middle East & Africa Chemical Market Outlook, By Fine Chemicals (2021-2030) ($MN)
- Table 100 Middle East & Africa Chemical Market Outlook, By Consumer Chemicals (2021-2030) ($MN)
- Table 101 Middle East & Africa Chemical Market Outlook, By Basic Chemicals (2021-2030) ($MN)
- Table 102 Middle East & Africa Chemical Market Outlook, By Other Types (2021-2030) ($MN)
- Table 103 Middle East & Africa Chemical Market Outlook, By End User (2021-2030) ($MN)
- Table 104 Middle East & Africa Chemical Market Outlook, By Consumer Goods (2021-2030) ($MN)
- Table 105 Middle East & Africa Chemical Market Outlook, By Pharmaceuticals (2021-2030) ($MN)
- Table 106 Middle East & Africa Chemical Market Outlook, By Agrochemicals (2021-2030) ($MN)
- Table 107 Middle East & Africa Chemical Market Outlook, By Industrial (2021-2030) ($MN)
- Table 108 Middle East & Africa Chemical Market Outlook, By Personal Care (2021-2030) ($MN)
- Table 109 Middle East & Africa Chemical Market Outlook, By Food & Beverage (2021-2030) ($MN)
- Table 110 Middle East & Africa Chemical Market Outlook, By Construction (2021-2030) ($MN)
- Table 111 Middle East & Africa Chemical Market Outlook, By Paints and Coatings (2021-2030) ($MN)
- Table 112 Middle East & Africa Chemical Market Outlook, By Automotive (2021-2030) ($MN)
- Table 113 Middle East & Africa Chemical Market Outlook, By Textiles (2021-2030) ($MN)
- Table 114 Middle East & Africa Chemical Market Outlook, By Other End Users (2021-2030) ($MN)
According to Stratistics MRC, the Global Chemical Market is accounted for $659.9 billion in 2023 and is expected to reach $1066.6 billion by 2030 growing at a CAGR of 7.1% during the forecast period. Chemical goods are those that help a variety of sectors that they serve, including food, oil and gas, textiles, ink additives, construction, and additives for additives. These may be mixtures made up of just one ingredient or things whose makeup affects how well the customer's product works. They are used in accordance with their functionality and performance.
According to a report published by India Brands Equity Foundation, the FDI inflows in the chemical sector reached $18.69 billion from April 2020 and June 2021.
Market Dynamics:
Driver:
Growing need for specialty chemicals
There is a considerable demand for specialty chemicals, which are high-performance, high-value substances employed in certain applications. These frequently serve specialized and sophisticated markets including biotechnology, electronics, and aerospace. The need for highly specialized chemicals made specifically for these sectors is rising as a result of technological improvements. The market is driven by the growing demand for cutting-edge materials and customized solutions.
Restraint:
Environmental regulations
Environmental rules pertaining to the chemicals business are getting more and more strict with the goal of lowering emissions, waste, and pollution. Adherence to these laws necessitates substantial expenditures on machinery, procedures, and disposal systems. Traditional chemical products and processes also face challenges from sustainability concerns and the quest for greener alternatives. These are the factors that are limiting the market's expansion.
Opportunity:
Advances in technology
Innovation and technological advancements have had a big influence on the chemicals sector. Novel goods and applications have been developed as a result of new manufacturing techniques including biotechnology and nanotechnology. Furthermore, developments in catalysts, process optimization, and chemical synthesis have increased productivity and opened up new avenues for the creation of novel chemical products. These are the driving forces behind the market's expansion.
Threat:
Volatility in raw material prices
Natural gas, petroleum, and other basic minerals are major sources of supply for the chemicals sector. The profitability of chemical factories may be impacted by changes in the price of certain raw materials. Market fluctuations, supply-demand dynamics, and geopolitical tensions are a few examples of the variables that might affect price volatility. This is the main aspect holding back the market's expansion.
COVID-19 Impact:
The global specialty chemicals value chain has been disrupted as a result of the COVID-19 epidemic. A decline in chemical output and demand was reflected in the temporary closure of chemical production facilities across the world and the limitations placed on the transit of commodities. The demand from sectors that employ specialized chemicals heavily influences both production and use of these materials.
The specialty chemicals segment is expected to be the largest during the forecast period
The specialty chemicals segment is expected to be the largest during the forecast period. This is ascribed to developments in process technology, trade liberalization, and the rising demand for chemicals used in electronics, water treatment, and building. The increasing need for tastes and perfumes, food and feed additives, medications, and other items is also credited with the development. As processed foods and drinks have grown more common in industrialized countries, there has been a rise in the need for flavoring agents.
The food & beverage segment is expected to have the highest CAGR during the forecast period
The food & beverage segment is expected to have the highest CAGR during the forecast period. wth of the food and beverage industry in the region has been largely attributed to a number of factors, including reliance on food trade, global tastes, shifting consumer preferences and lifestyles, strategic geographic location, and Gulf food programs. It is also anticipated that these factors will drive demand for specialty chemicals over the anticipated years.
Region with largest share:
North America is projected to hold the largest market share during the forecast period owing to the increasing focus and investments. With a growing emphasis on lowering greenhouse gas emissions, advancing circular economy principles, and embracing bio-based alternatives to conventional chemicals, it has been at the forefront of sustainability and environmental projects. The market is expected to be driven by factors including increased investments, fierce rivalry, and the presence of several chemical manufacturing businesses.
Region with highest CAGR:
Asia Pacific is projected to hold the highest CAGR over the forecast period due to the rise in manufacturing activities, rise in per capita disposable income, expansion of sectors such as automotive, construction and electrical and electronics. Economic development, industrialization, and the expansion of significant end-use industries are blamed for this. The chemical industry is expanding at a faster rate than other major chemical-producing nations.
Key players in the market:
Some of the key players in Chemical market include BASF SE, Dow Chemical Company, EChemicalonMobil, DuPont de Nemours, Inc., Linde plc, Bayer AG, Mitsubishi Chemical Corporation, Eastman Chemical Company, Evonik Industries, Clariant, Lanxess, Air Products and Chemicals, Inc., Borealis AG, LyondellBasell, SABIC , 3M Company and Ansell Limited.
Key Developments:
In June 2023, Avient Corporation and BASF SE have collaborated to offer colored grades of Ultrason high-performance polymers to the global market.
In December 2022, Clariant AG announced to strengthen its position in China and expand its care chemicals facility in the country, including pharmaceutical, personal care, home care, and industrial applications. The company provides care chemicals under its specialty segment.
In April 2022, Evonik invested in increasing production capacity for isobutene derivatives at its Marl location by 50%5. The isobutene part of the C4 production network produces the petrochemical specialties Tertiary Butanol (TBA), Di- isobutene (DiB), and 3,5,5 Trimethylhexanal (TMH).
Types Covered:
- Specialty Chemicals
- Fine Chemicals
- Consumer Chemicals
- Basic Chemicals
- Other Types
End Users Covered:
- Consumer Goods
- Pharmaceuticals
- Agrochemicals
- Industrial
- Personal Care
- Food & Beverage
- Construction
- Paints and Coatings
- Automotive
- Textiles
- Other End Users
Regions Covered:
- North America
- US
- Canada
- Mexico
- Europe
- Germany
- UK
- Italy
- France
- Spain
- Rest of Europe
- Asia Pacific
- Japan
- China
- India
- Australia
- New Zealand
- South Korea
- Rest of Asia Pacific
- South America
- Argentina
- Brazil
- Chile
- Rest of South America
- Middle East & Africa
- Saudi Arabia
- UAE
- Qatar
- South Africa
- Rest of Middle East & Africa
What our report offers:
- Market share assessments for the regional and country-level segments
- Strategic recommendations for the new entrants
- Covers Market data for the years 2021, 2022, 2023, 2026, and 2030
- Market Trends (Drivers, Constraints, Opportunities, Threats, Challenges, Investment Opportunities, and recommendations)
- Strategic recommendations in key business segments based on the market estimations
- Competitive landscaping mapping the key common trends
- Company profiling with detailed strategies, financials, and recent developments
- Supply chain trends mapping the latest technological advancements
Free Customization Offerings:
All the customers of this report will be entitled to receive one of the following free customization options::
- Company Profiling
- Comprehensive profiling of additional market players (up to 3)
- SWOT Analysis of key players (up to 3)
- Regional Segmentation
- Market estimations, Forecasts and CAGR of any prominent country as per the client's interest (Note: Depends on feasibility check)
- Competitive Benchmarking
- Benchmarking of key players based on product portfolio, geographical presence, and strategic alliances
Table of Contents
1 Executive Summary
2 Preface
- 2.1 Abstract
- 2.2 Stake Holders
- 2.3 Research Scope
- 2.4 Research Methodology
- 2.4.1 Data Mining
- 2.4.2 Data Analysis
- 2.4.3 Data Validation
- 2.4.4 Research Approach
- 2.5 Research Sources
- 2.5.1 Primary Research Sources
- 2.5.2 Secondary Research Sources
- 2.5.3 Assumptions
3 Market Trend Analysis
- 3.1 Introduction
- 3.2 Drivers
- 3.3 Restraints
- 3.4 Opportunities
- 3.5 Threats
- 3.6 End User Analysis
- 3.7 Emerging Markets
- 3.8 Impact of Covid-19
4 Porters Five Force Analysis
- 4.1 Bargaining power of suppliers
- 4.2 Bargaining power of buyers
- 4.3 Threat of substitutes
- 4.4 Threat of new entrants
- 4.5 Competitive rivalry
5 Global Chemical Market, By Type
- 5.1 Introduction
- 5.2 Specialty Chemicals
- 5.3 Fine Chemicals
- 5.4 Consumer Chemicals
- 5.5 Basic Chemicals
- 5.6 Other Types
6 Global Chemical Market, By End User
- 6.1 Introduction
- 6.2 Consumer Goods
- 6.3 Pharmaceuticals
- 6.4 Agrochemicals
- 6.5 Industrial
- 6.6 Personal Care
- 6.7 Food & Beverage
- 6.8 Construction
- 6.9 Paints and Coatings
- 6.10 Automotive
- 6.11 Textiles
- 6.12 Other End Users
7 Global Chemical Market, By Geography
- 7.1 Introduction
- 7.2 North America
- 7.2.1 US
- 7.2.2 Canada
- 7.2.3 Mexico
- 7.3 Europe
- 7.3.1 Germany
- 7.3.2 UK
- 7.3.3 Italy
- 7.3.4 France
- 7.3.5 Spain
- 7.3.6 Rest of Europe
- 7.4 Asia Pacific
- 7.4.1 Japan
- 7.4.2 China
- 7.4.3 India
- 7.4.4 Australia
- 7.4.5 New Zealand
- 7.4.6 South Korea
- 7.4.7 Rest of Asia Pacific
- 7.5 South America
- 7.5.1 Argentina
- 7.5.2 Brazil
- 7.5.3 Chile
- 7.5.4 Rest of South America
- 7.6 Middle East & Africa
- 7.6.1 Saudi Arabia
- 7.6.2 UAE
- 7.6.3 Qatar
- 7.6.4 South Africa
- 7.6.5 Rest of Middle East & Africa
8 Key Developments
- 8.1 Agreements, Partnerships, Collaborations and Joint Ventures
- 8.2 Acquisitions & Mergers
- 8.3 New Product Launch
- 8.4 Expansions
- 8.5 Other Key Strategies
9 Company Profiling
- 9.1 BASF SE
- 9.2 Dow Chemical Company
- 9.3 EChemicalonMobil
- 9.4 DuPont de Nemours, Inc.
- 9.5 Linde plc
- 9.6 Bayer AG
- 9.7 Mitsubishi Chemical Corporation
- 9.8 Eastman Chemical Company
- 9.9 Evonik Industries
- 9.10 Clariant
- 9.11 Lanxess
- 9.12 Air Products and Chemicals, Inc.
- 9.13 Borealis AG
- 9.14 LyondellBasell
- 9.15 SABIC
- 9.16 3M Company
- 9.17 Ansell Limited
