|
|
市場調査レポート
商品コード
1403383
ミクロスフェア市場の2030年までの予測:製品タイプ別、原材料別、用途別、地域別の世界分析Microspheres Market Forecasts to 2030 - Global Analysis By Product Type, Raw Material, Application and By Geography |
||||||
|
|
|||||||
カスタマイズ可能
|
|||||||


| ミクロスフェア市場の2030年までの予測:製品タイプ別、原材料別、用途別、地域別の世界分析 |
|
出版日: 2024年01月01日
発行: Stratistics Market Research Consulting
ページ情報: 英文 200+ Pages
納期: 2~3営業日
|

- 全表示
- 概要
- 図表
- 目次
Stratistics MRCによると、世界のミクロスフェア市場は2023年に24億米ドルを占め、2030年には60億8,000万米ドルに達すると予測され、予測期間中のCAGRは14.2%です。
ミクロスフェアは、直径が通常1~1000マイクロメートル(μm)の小さな球状粒子です。多くの場合、ポリマー、ガラス、セラミック、金属など様々な材料で作られています。ミクロスフェアは、医療、医薬品、化粧品、材料科学など、さまざまな分野で幅広く使用されています。さらに、ミクロスフェアの小さなサイズと均一な形状は、精密な用途に重宝され、その多様性により、幅広い産業で特定の機能に合わせてカスタマイズすることができます。
OECDによると、米国の国内総生産(GDP)に占めるヘルスケア支出の割合は、2020年の18.8%に対し、2021年は17.8%となっています。
ヘルスケアにおける需要の高まり
ミクロスフェアはドラッグデリバリーの役割を果たすため、様々な医療用途で使用されています。医療用画像診断では、視覚や診断に役立つ造影剤としても使用され、再生医療では組織工学や細胞培養を促進します。さらに、低侵襲手術や個別化医療が重視されるようになったため、ヘルスケア業界におけるミクロスフェアのニーズが高まっており、これが市場拡大の原動力となっています。
高い初期コスト
特に生体適合性または生分解性ミクロスフェアを製造する場合、困難な製造手順や特殊材料の使用の結果、製造コストが上昇する可能性があります。これらの法外な出費は、結果としてミクロスフェアを含む薬剤や医療処置のコストを引き上げ、患者の利用しやすさや購入しやすさを制限する可能性があります。さらに、経済的な負担は小規模生産者の市場参入を阻み、ミクロスフェアに基づく独創的なヘルスケアソリューションの進歩を制限し、市場の成長を妨げる可能性があります。
生態学的安定性の進歩
ヘルスケア産業が持続可能性をますます重視するようになるにつれ、ミクロスフェアは医療による環境への影響を最小限に抑えるソリューションを提供します。生分解性ミクロスフェアは、持続可能なパッケージング・ソリューションに応用され、様々な製品の環境フットプリントを削減します。さらに、研究開発の努力は、再生可能な資源からミクロスフェアを作ることに集中しており、生態系の安定を達成するという全体的な目標に貢献しています。エコロジーへの配慮が事業戦略に不可欠となるにつれ、これらの採用がこの市場の成長を促進することになります。
認識と標準化の欠如
様々な医療用途におけるミクロスフェアの使用に関する標準化されたガイドラインも不足しており、患者の安全性と転帰に影響を及ぼす可能性があります。このような統一性の欠如は、規制遵守や品質保証に障害をもたらし、その結果、利用が不十分となり、患者により良い治療を提供する機会を失うことになります。さらに、ミクロスフェアを製品に組み込むことの潜在的な利点に関する製造業者の認識が限定的であるため、技術革新や効率向上の機会を逃すことになり、市場規模の妨げになる可能性があります。
COVID-19の影響
COVID-19の流行は、いくつかの点でミクロスフェア市場に悪影響を及ぼしています。サプライチェーンの混乱、渡航制限、労働力不足は、ミクロスフェアメーカーの経営上の課題につながっています。自動車、化粧品、建設業界で広く利用されているミクロスフェアの需要は、消費者支出や建設プロジェクトの減少の結果、減少しました。さらに、ヘルスケア産業が逼迫し、ミクロスフェア関連の外科手術が見送られたことも、この市場の成長を徐々に阻害しました。
予測期間中、中空セグメントが最大となる見込み
中空セグメントが最大のシェアを占めると推定されます。中空球体は密度が低いため、コンクリートや塗料などの軽量充填材として利用されています。石油・ガス、塗料・コーティング、複合材料、軽量化によって強度対重量比が向上する材料など、さまざまな産業で広く使用されています。さらに、医療用途では、中空ミクロスフェアは画像技術における造影剤として機能し、診断手順における視認性を向上させる。
予測期間中、フライアッシュセグメントのCAGRが最も高くなると予想されます。
フライアッシュセグメントは、予測期間中に最も高いCAGRを持つと予測されています。フライアッシュミクロスフェアは、コンクリートの軽量充填材として機能し、強度、耐久性、断熱性を向上させる。フライアッシュミクロスフェアは、その潤滑性と浮力性から石油・ガス産業の掘削液に使用されています。さらに、フライアッシュミクロスフェア市場は、産業廃棄物(フライアッシュ)を貴重な材料に再利用するため、持続可能な慣行に合致しており、廃棄物の削減と環境保全に貢献し、このセグメントの成長を促進しています。
最大のシェアを占める地域
この地域は最先端の医療技術革新と研究の最前線にあり、その結果、さまざまな医療用途のための革新的なミクロスフェア技術が開拓されました。個別化医療、高精度薬物送達、生体適合性・生分解性ミクロスフェアの開発などは、こうした進歩の一部です。さらに、欧州の技術躍進の結果、厳格な品質基準と規制規制が導入され、この地域の成長を牽引しています。
CAGRが最も高い地域:
アジア太平洋地域は、予測期間中CAGRが最も高くなると予想されます。ミクロスフェアベースのヘルスケアイノベーションの利用や調査を奨励するため、各国政府はプログラムや政策を打ち出しています。中国やインドのような国では、インフラプロジェクト用の軽量コンクリートへのミクロスフェアの採用が増加しています。この地域には、Siemens Healthineers AG、3M、Kureha Corporation、Potters Industries LLCなど、持続可能なヘルスケアソリューションと技術進歩に専念する主要企業があり、この地域の成長を後押ししています。
無料カスタマイズサービス:
本レポートをご購読のお客様には、以下の無料カスタマイズオプションのいずれかをご利用いただけます:
- 企業プロファイル
- 追加市場プレーヤーの包括的プロファイリング(3社まで)
- 主要企業のSWOT分析(3社まで)
- 地域セグメンテーション
- 顧客の関心に応じた主要国の市場推計・予測・CAGR(注:フィージビリティチェックによる)
- 競合ベンチマーキング
- 製品ポートフォリオ、地理的プレゼンス、戦略的提携に基づく主要企業のベンチマーキング
目次
第1章 エグゼクティブサマリー
第2章 序文
- 概要
- ステークホルダー
- 調査範囲
- 調査手法
- データマイニング
- データ分析
- データ検証
- 調査アプローチ
- 調査ソース
- 1次調査ソース
- 2次調査ソース
- 前提条件
第3章 市場動向分析
- 促進要因
- 抑制要因
- 機会
- 脅威
- 製品分析
- 用途分析
- 新興市場
- 新型コロナウイルス感染症(COVID-19)の影響
第4章 ポーターのファイブフォース分析
- 供給企業の交渉力
- 買い手の交渉力
- 代替品の脅威
- 新規参入業者の脅威
- 競争企業間の敵対関係
第5章 世界のミクロスフェア市場:製品タイプ別
- 固体
- 中空
- その他の製品タイプ
第6章 世界のミクロスフェア市場:原材料別
- メタリック
- ガラス
- セラミック
- フライアッシュ
- ポリマー
- その他の原材料
第7章 世界のミクロスフェア市場:用途別
- 複合材料
- 自動車
- 医療技術
- 航空宇宙
- 石油・ガス
- 化粧品
- 塗料とコーティング
第8章 世界のミクロスフェア市場:地域別
- 北米
- 米国
- カナダ
- メキシコ
- 欧州
- ドイツ
- 英国
- イタリア
- フランス
- スペイン
- その他欧州
- アジア太平洋地域
- 日本
- 中国
- インド
- オーストラリア
- ニュージーランド
- 韓国
- その他アジア太平洋地域
- 南米
- アルゼンチン
- ブラジル
- チリ
- その他南米
- 中東とアフリカ
- サウジアラビア
- アラブ首長国連邦
- カタール
- 南アフリカ
- その他中東とアフリカ
第9章 主な発展
- 契約、パートナーシップ、コラボレーション、合弁事業
- 買収と合併
- 新製品の発売
- 事業拡大
- その他の主要戦略
第10章 企業プロファイル
- 3M
- Trelleborg AB
- Bangs Laboratories Inc.
- Siemens Healthineers AG
- Potters Industries LLC
- Chase Corporation
- Nouryon
- Cospheric LLC
- Mo-sci Corporation(Heraeus Holdings)
- Kureha Corporation
- Momentive
- Luminex Corporation(Diasorin Spa)
- Merit Medical Systems
- Matsumoto Yushi-seiyaku Co. Ltd
List of Tables
- Table 1 Global Microspheres Market Outlook, By Region (2021-2030) ($MN)
- Table 2 Global Microspheres Market Outlook, By Product Type (2021-2030) ($MN)
- Table 3 Global Microspheres Market Outlook, By Solid (2021-2030) ($MN)
- Table 4 Global Microspheres Market Outlook, By Hollow (2021-2030) ($MN)
- Table 5 Global Microspheres Market Outlook, By Other Product Types (2021-2030) ($MN)
- Table 6 Global Microspheres Market Outlook, By Raw Material (2021-2030) ($MN)
- Table 7 Global Microspheres Market Outlook, By Metallic (2021-2030) ($MN)
- Table 8 Global Microspheres Market Outlook, By Glass (2021-2030) ($MN)
- Table 9 Global Microspheres Market Outlook, By Ceramic (2021-2030) ($MN)
- Table 10 Global Microspheres Market Outlook, By Fly Ash (2021-2030) ($MN)
- Table 11 Global Microspheres Market Outlook, By Polymer (2021-2030) ($MN)
- Table 12 Global Microspheres Market Outlook, By Other Raw Materials (2021-2030) ($MN)
- Table 13 Global Microspheres Market Outlook, By Application (2021-2030) ($MN)
- Table 14 Global Microspheres Market Outlook, By Composites (2021-2030) ($MN)
- Table 15 Global Microspheres Market Outlook, By Automotive (2021-2030) ($MN)
- Table 16 Global Microspheres Market Outlook, By Medical Technology (2021-2030) ($MN)
- Table 17 Global Microspheres Market Outlook, By Aerospace (2021-2030) ($MN)
- Table 18 Global Microspheres Market Outlook, By Oil and Gas (2021-2030) ($MN)
- Table 19 Global Microspheres Market Outlook, By Cosmetics (2021-2030) ($MN)
- Table 20 Global Microspheres Market Outlook, By Paints and Coatings (2021-2030) ($MN)
- Table 21 North America Microspheres Market Outlook, By Country (2021-2030) ($MN)
- Table 22 North America Microspheres Market Outlook, By Product Type (2021-2030) ($MN)
- Table 23 North America Microspheres Market Outlook, By Solid (2021-2030) ($MN)
- Table 24 North America Microspheres Market Outlook, By Hollow (2021-2030) ($MN)
- Table 25 North America Microspheres Market Outlook, By Other Product Types (2021-2030) ($MN)
- Table 26 North America Microspheres Market Outlook, By Raw Material (2021-2030) ($MN)
- Table 27 North America Microspheres Market Outlook, By Metallic (2021-2030) ($MN)
- Table 28 North America Microspheres Market Outlook, By Glass (2021-2030) ($MN)
- Table 29 North America Microspheres Market Outlook, By Ceramic (2021-2030) ($MN)
- Table 30 North America Microspheres Market Outlook, By Fly Ash (2021-2030) ($MN)
- Table 31 North America Microspheres Market Outlook, By Polymer (2021-2030) ($MN)
- Table 32 North America Microspheres Market Outlook, By Other Raw Materials (2021-2030) ($MN)
- Table 33 North America Microspheres Market Outlook, By Application (2021-2030) ($MN)
- Table 34 North America Microspheres Market Outlook, By Composites (2021-2030) ($MN)
- Table 35 North America Microspheres Market Outlook, By Automotive (2021-2030) ($MN)
- Table 36 North America Microspheres Market Outlook, By Medical Technology (2021-2030) ($MN)
- Table 37 North America Microspheres Market Outlook, By Aerospace (2021-2030) ($MN)
- Table 38 North America Microspheres Market Outlook, By Oil and Gas (2021-2030) ($MN)
- Table 39 North America Microspheres Market Outlook, By Cosmetics (2021-2030) ($MN)
- Table 40 North America Microspheres Market Outlook, By Paints and Coatings (2021-2030) ($MN)
- Table 41 Europe Microspheres Market Outlook, By Country (2021-2030) ($MN)
- Table 42 Europe Microspheres Market Outlook, By Product Type (2021-2030) ($MN)
- Table 43 Europe Microspheres Market Outlook, By Solid (2021-2030) ($MN)
- Table 44 Europe Microspheres Market Outlook, By Hollow (2021-2030) ($MN)
- Table 45 Europe Microspheres Market Outlook, By Other Product Types (2021-2030) ($MN)
- Table 46 Europe Microspheres Market Outlook, By Raw Material (2021-2030) ($MN)
- Table 47 Europe Microspheres Market Outlook, By Metallic (2021-2030) ($MN)
- Table 48 Europe Microspheres Market Outlook, By Glass (2021-2030) ($MN)
- Table 49 Europe Microspheres Market Outlook, By Ceramic (2021-2030) ($MN)
- Table 50 Europe Microspheres Market Outlook, By Fly Ash (2021-2030) ($MN)
- Table 51 Europe Microspheres Market Outlook, By Polymer (2021-2030) ($MN)
- Table 52 Europe Microspheres Market Outlook, By Other Raw Materials (2021-2030) ($MN)
- Table 53 Europe Microspheres Market Outlook, By Application (2021-2030) ($MN)
- Table 54 Europe Microspheres Market Outlook, By Composites (2021-2030) ($MN)
- Table 55 Europe Microspheres Market Outlook, By Automotive (2021-2030) ($MN)
- Table 56 Europe Microspheres Market Outlook, By Medical Technology (2021-2030) ($MN)
- Table 57 Europe Microspheres Market Outlook, By Aerospace (2021-2030) ($MN)
- Table 58 Europe Microspheres Market Outlook, By Oil and Gas (2021-2030) ($MN)
- Table 59 Europe Microspheres Market Outlook, By Cosmetics (2021-2030) ($MN)
- Table 60 Europe Microspheres Market Outlook, By Paints and Coatings (2021-2030) ($MN)
- Table 61 Asia Pacific Microspheres Market Outlook, By Country (2021-2030) ($MN)
- Table 62 Asia Pacific Microspheres Market Outlook, By Product Type (2021-2030) ($MN)
- Table 63 Asia Pacific Microspheres Market Outlook, By Solid (2021-2030) ($MN)
- Table 64 Asia Pacific Microspheres Market Outlook, By Hollow (2021-2030) ($MN)
- Table 65 Asia Pacific Microspheres Market Outlook, By Other Product Types (2021-2030) ($MN)
- Table 66 Asia Pacific Microspheres Market Outlook, By Raw Material (2021-2030) ($MN)
- Table 67 Asia Pacific Microspheres Market Outlook, By Metallic (2021-2030) ($MN)
- Table 68 Asia Pacific Microspheres Market Outlook, By Glass (2021-2030) ($MN)
- Table 69 Asia Pacific Microspheres Market Outlook, By Ceramic (2021-2030) ($MN)
- Table 70 Asia Pacific Microspheres Market Outlook, By Fly Ash (2021-2030) ($MN)
- Table 71 Asia Pacific Microspheres Market Outlook, By Polymer (2021-2030) ($MN)
- Table 72 Asia Pacific Microspheres Market Outlook, By Other Raw Materials (2021-2030) ($MN)
- Table 73 Asia Pacific Microspheres Market Outlook, By Application (2021-2030) ($MN)
- Table 74 Asia Pacific Microspheres Market Outlook, By Composites (2021-2030) ($MN)
- Table 75 Asia Pacific Microspheres Market Outlook, By Automotive (2021-2030) ($MN)
- Table 76 Asia Pacific Microspheres Market Outlook, By Medical Technology (2021-2030) ($MN)
- Table 77 Asia Pacific Microspheres Market Outlook, By Aerospace (2021-2030) ($MN)
- Table 78 Asia Pacific Microspheres Market Outlook, By Oil and Gas (2021-2030) ($MN)
- Table 79 Asia Pacific Microspheres Market Outlook, By Cosmetics (2021-2030) ($MN)
- Table 80 Asia Pacific Microspheres Market Outlook, By Paints and Coatings (2021-2030) ($MN)
- Table 81 South America Microspheres Market Outlook, By Country (2021-2030) ($MN)
- Table 82 South America Microspheres Market Outlook, By Product Type (2021-2030) ($MN)
- Table 83 South America Microspheres Market Outlook, By Solid (2021-2030) ($MN)
- Table 84 South America Microspheres Market Outlook, By Hollow (2021-2030) ($MN)
- Table 85 South America Microspheres Market Outlook, By Other Product Types (2021-2030) ($MN)
- Table 86 South America Microspheres Market Outlook, By Raw Material (2021-2030) ($MN)
- Table 87 South America Microspheres Market Outlook, By Metallic (2021-2030) ($MN)
- Table 88 South America Microspheres Market Outlook, By Glass (2021-2030) ($MN)
- Table 89 South America Microspheres Market Outlook, By Ceramic (2021-2030) ($MN)
- Table 90 South America Microspheres Market Outlook, By Fly Ash (2021-2030) ($MN)
- Table 91 South America Microspheres Market Outlook, By Polymer (2021-2030) ($MN)
- Table 92 South America Microspheres Market Outlook, By Other Raw Materials (2021-2030) ($MN)
- Table 93 South America Microspheres Market Outlook, By Application (2021-2030) ($MN)
- Table 94 South America Microspheres Market Outlook, By Composites (2021-2030) ($MN)
- Table 95 South America Microspheres Market Outlook, By Automotive (2021-2030) ($MN)
- Table 96 South America Microspheres Market Outlook, By Medical Technology (2021-2030) ($MN)
- Table 97 South America Microspheres Market Outlook, By Aerospace (2021-2030) ($MN)
- Table 98 South America Microspheres Market Outlook, By Oil and Gas (2021-2030) ($MN)
- Table 99 South America Microspheres Market Outlook, By Cosmetics (2021-2030) ($MN)
- Table 100 South America Microspheres Market Outlook, By Paints and Coatings (2021-2030) ($MN)
- Table 101 Middle East & Africa Microspheres Market Outlook, By Country (2021-2030) ($MN)
- Table 102 Middle East & Africa Microspheres Market Outlook, By Product Type (2021-2030) ($MN)
- Table 103 Middle East & Africa Microspheres Market Outlook, By Solid (2021-2030) ($MN)
- Table 104 Middle East & Africa Microspheres Market Outlook, By Hollow (2021-2030) ($MN)
- Table 105 Middle East & Africa Microspheres Market Outlook, By Other Product Types (2021-2030) ($MN)
- Table 106 Middle East & Africa Microspheres Market Outlook, By Raw Material (2021-2030) ($MN)
- Table 107 Middle East & Africa Microspheres Market Outlook, By Metallic (2021-2030) ($MN)
- Table 108 Middle East & Africa Microspheres Market Outlook, By Glass (2021-2030) ($MN)
- Table 109 Middle East & Africa Microspheres Market Outlook, By Ceramic (2021-2030) ($MN)
- Table 110 Middle East & Africa Microspheres Market Outlook, By Fly Ash (2021-2030) ($MN)
- Table 111 Middle East & Africa Microspheres Market Outlook, By Polymer (2021-2030) ($MN)
- Table 112 Middle East & Africa Microspheres Market Outlook, By Other Raw Materials (2021-2030) ($MN)
- Table 113 Middle East & Africa Microspheres Market Outlook, By Application (2021-2030) ($MN)
- Table 114 Middle East & Africa Microspheres Market Outlook, By Composites (2021-2030) ($MN)
- Table 115 Middle East & Africa Microspheres Market Outlook, By Automotive (2021-2030) ($MN)
- Table 116 Middle East & Africa Microspheres Market Outlook, By Medical Technology (2021-2030) ($MN)
- Table 117 Middle East & Africa Microspheres Market Outlook, By Aerospace (2021-2030) ($MN)
- Table 118 Middle East & Africa Microspheres Market Outlook, By Oil and Gas (2021-2030) ($MN)
- Table 119 Middle East & Africa Microspheres Market Outlook, By Cosmetics (2021-2030) ($MN)
- Table 120 Middle East & Africa Microspheres Market Outlook, By Paints and Coatings (2021-2030) ($MN)
According to Stratistics MRC, the Global Microspheres Market is accounted for $2.40 billion in 2023 and is expected to reach $6.08 billion by 2030 growing at a CAGR of 14.2% during the forecast period. Microspheres are tiny spherical particles with diameters typically ranging from 1 to 1000 micrometers (μm). They are often made from various materials, including polymers, glass, ceramics, and metals. Microspheres find extensive use in various fields, such as medicine, pharmaceuticals, cosmetics, and materials science. Furthermore, the small size and uniform shape of microspheres make them valuable for precise applications, and their versatility allows them to be customized for specific functions in a wide range of industries.
According to the OECD, the healthcare expenditure accounted for 17.8% of United States' gross domestic product (GDP) in 2021, compared to 18.8% in 2020.
Market Dynamics:
Driver:
Rising demand in healthcare
Microspheres are used in many different medical applications as they perform the role of drug delivery vehicles, allowing for the regulated release of medications, improving the effectiveness of treatment, and minimizing negative effects. In medical imaging, these are also used as contrast agents to help with vision and diagnosis, as they facilitate tissue engineering and cell culture in regenerative medicine. Furthermore, the need for microspheres in the healthcare industry is increasing because of the growing emphasis on minimally invasive procedures and personalized medicine, which are driving this market expansion.
Restraint:
High initial cost
Production costs may rise as a result of difficult manufacturing procedures and the use of specialty materials, particularly when creating biocompatible or biodegradable microspheres. These outrageous expenses may consequently raise the cost of microsphere-containing medications or medical procedures, limiting patient accessibility and affordability. Furthermore, the financial strain could discourage smaller producers from entering the market and restrict the advancement of creative healthcare solutions based on microspheres, which hampers market growth.
Opportunity:
Advancements in ecological stability
Microspheres provide solutions that minimize the environmental impact of medical treatments as the healthcare industry places an increasing emphasis on sustainability. Biodegradable microspheres find applications in sustainable packaging solutions, reducing the environmental footprint of various products. Furthermore, research and development efforts are focused on creating microspheres from renewable resources, contributing to the overall goal of achieving ecological stability. As ecological considerations become integral to business strategies, the adoption of these will drive this market's growth.
Threat:
Lack of awareness and standardization
Standardized guidelines for the use of microspheres in various medical applications are also lacking, which could have an impact on patient safety and outcomes. This lack of uniformity can create hurdles in regulatory compliance and quality assurance, resulting in inadequate utilization and lost chances to provide patients with better care. Moreover, the limited awareness among manufacturers about the potential advantages of incorporating microspheres in their products may result in missed opportunities for innovation and efficiency improvements, thereby hampering this market size.
COVID-19 Impact
The COVID-19 pandemic has adversely affected the microsphere market in several ways. Supply chain disruptions, travel restrictions, and workforce shortages have led to operational challenges for microsphere manufacturers. The demand for microspheres, which are widely utilized in the automotive, cosmetics, and construction industries, has declined as a result of a reduction in consumer expenditure and construction projects. Furthermore, the healthcare industry was under pressure, and microsphere-related surgical procedures were put on hold, which gradually impeded this market growth.
The hollow segment is expected to be the largest during the forecast period
The hollow segment is estimated to hold the largest share. These are utilized as lightweight fillers in materials such as concrete and coatings due to their low density. They are widely used in a variety of industries, including oil and gas, paints and coatings, composites, and materials whose strength-to-weight ratios can be enhanced by their lightweight nature. Furthermore, in medical applications, hollow microspheres serve as contrast agents in imaging techniques, providing enhanced visibility in diagnostic procedures.
The fly ash segment is expected to have the highest CAGR during the forecast period
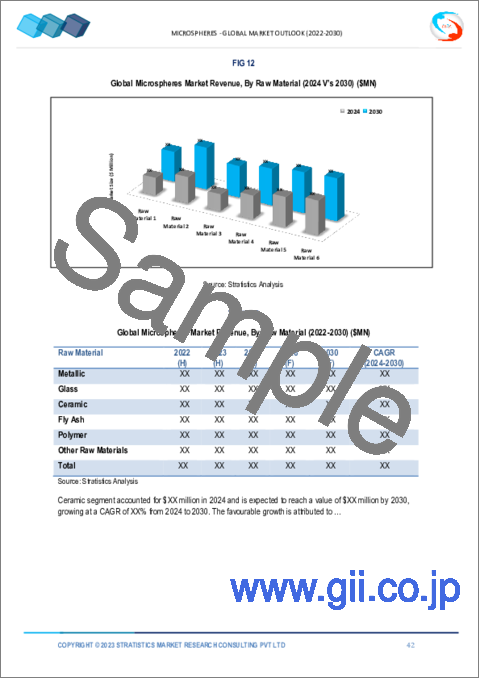
The fly ash segment is anticipated to have highest CAGR during the forecast period. These microspheres act as lightweight fillers in concrete, enhancing its strength, durability, and insulation properties. Fly ash microspheres are used in drilling fluids in the oil and gas industry because of their lubricating and buoyant qualities. Furthermore, the fly ash microsphere market aligns with sustainable practices, as it involves repurposing industrial waste (fly ash) into valuable materials, contributing to waste reduction and environmental conservation, which are propelling this segment's growth.
Region with largest share:
Europe commanded the largest market share during the extrapolated period owing to the fact that the area is at the forefront of cutting-edge medical innovation and research, which has led to the development of innovative microsphere technologies for a range of healthcare uses. Personalized medicine, precision medication delivery, and the creation of biocompatible and biodegradable microspheres are some of these advancements. Furthermore, strict quality standards and regulatory regulations have been put in place as a result of Europe's technical breakthroughs, which are driving this region's growth.
Region with highest CAGR:
Asia Pacific is expected to witness highest CAGR over the projection period. To encourage the usage and research of microsphere-based healthcare innovations, governments have launched programs and policies. In countries like China and India, the adoption of microspheres in lightweight concrete for infrastructure projects is on the rise. This region is home to major key players, including Siemens Healthineers AG, 3M, Kureha Corporation, and Potters Industries LLC, dedicated to sustainable healthcare solutions and technological advancement, which are boosting this region's growth.
Key players in the market:
Some of the key players in the Microspheres Market include 3M, Trelleborg AB, Bangs Laboratories Inc., Siemens Healthineers AG, Potters Industries LLC, Chase Corporation, Nouryon, Cospheric LLC, Mo-sci Corporation (Heraeus Holdings), Kureha Corporation, Momentive, Luminex Corporation (Diasorin Spa), Merit Medical Systems and Matsumoto Yushi-seiyaku Co. Ltd.
Key Developments:
In August 2023, 3M announced it has completed the sale of certain assets from its dental local anesthetic portfolio, based in Seefeld, Germany, to Pierrel S.p.A., a global provider of services for the pharmaceutical industry, for a purchase price of $70 million, subject to closing and other adjustments.
In July 2023, Chase, announced that it has entered into a definitive agreement to be acquired by an affiliate of investment funds managed by KKR, a leading global investment firm.
In July 2023, 3M Health Information Systems (HIS) announced that U.S. News & World Report will incorporate the 3M™ Ambulatory Potentially Preventable Complications software in the analysis of its 2023-2024 Best Hospitals Specialty rankings.
Product Types Covered:
- Solid
- Hollow
- Other Product Types
Raw Materials Covered:
- Metallic
- Glass
- Ceramic
- Fly Ash
- Polymer
- Other Raw Materials
Applications Covered:
- Composites
- Automotive
- Medical Technology
- Aerospace
- Oil and Gas
- Cosmetics
- Paints and Coatings
Regions Covered:
- North America
- US
- Canada
- Mexico
- Europe
- Germany
- UK
- Italy
- France
- Spain
- Rest of Europe
- Asia Pacific
- Japan
- China
- India
- Australia
- New Zealand
- South Korea
- Rest of Asia Pacific
- South America
- Argentina
- Brazil
- Chile
- Rest of South America
- Middle East & Africa
- Saudi Arabia
- UAE
- Qatar
- South Africa
- Rest of Middle East & Africa
What our report offers:
- Market share assessments for the regional and country-level segments
- Strategic recommendations for the new entrants
- Covers Market data for the years 2021, 2022, 2023, 2026, and 2030
- Market Trends (Drivers, Constraints, Opportunities, Threats, Challenges, Investment Opportunities, and recommendations)
- Strategic recommendations in key business segments based on the market estimations
- Competitive landscaping mapping the key common trends
- Company profiling with detailed strategies, financials, and recent developments
- Supply chain trends mapping the latest technological advancements
Free Customization Offerings:
All the customers of this report will be entitled to receive one of the following free customization options:
- Company Profiling
- Comprehensive profiling of additional market players (up to 3)
- SWOT Analysis of key players (up to 3)
- Regional Segmentation
- Market estimations, Forecasts and CAGR of any prominent country as per the client's interest (Note: Depends on feasibility check)
- Competitive Benchmarking
- Benchmarking of key players based on product portfolio, geographical presence, and strategic alliances
Table of Contents
1 Executive Summary
2 Preface
- 2.1 Abstract
- 2.2 Stake Holders
- 2.3 Research Scope
- 2.4 Research Methodology
- 2.4.1 Data Mining
- 2.4.2 Data Analysis
- 2.4.3 Data Validation
- 2.4.4 Research Approach
- 2.5 Research Sources
- 2.5.1 Primary Research Sources
- 2.5.2 Secondary Research Sources
- 2.5.3 Assumptions
3 Market Trend Analysis
- 3.1 Introduction
- 3.2 Drivers
- 3.3 Restraints
- 3.4 Opportunities
- 3.5 Threats
- 3.6 Product Analysis
- 3.7 Application Analysis
- 3.8 Emerging Markets
- 3.9 Impact of Covid-19
4 Porters Five Force Analysis
- 4.1 Bargaining power of suppliers
- 4.2 Bargaining power of buyers
- 4.3 Threat of substitutes
- 4.4 Threat of new entrants
- 4.5 Competitive rivalry
5 Global Microspheres Market, By Product Type
- 5.1 Introduction
- 5.2 Solid
- 5.3 Hollow
- 5.4 Other Product Types
6 Global Microspheres Market, By Raw Material
- 6.1 Introduction
- 6.2 Metallic
- 6.3 Glass
- 6.4 Ceramic
- 6.5 Fly Ash
- 6.6 Polymer
- 6.7 Other Raw Materials
7 Global Microspheres Market, By Application
- 7.1 Introduction
- 7.2 Composites
- 7.3 Automotive
- 7.4 Medical Technology
- 7.5 Aerospace
- 7.6 Oil and Gas
- 7.7 Cosmetics
- 7.8 Paints and Coatings
8 Global Microspheres Market, By Geography
- 8.1 Introduction
- 8.2 North America
- 8.2.1 US
- 8.2.2 Canada
- 8.2.3 Mexico
- 8.3 Europe
- 8.3.1 Germany
- 8.3.2 UK
- 8.3.3 Italy
- 8.3.4 France
- 8.3.5 Spain
- 8.3.6 Rest of Europe
- 8.4 Asia Pacific
- 8.4.1 Japan
- 8.4.2 China
- 8.4.3 India
- 8.4.4 Australia
- 8.4.5 New Zealand
- 8.4.6 South Korea
- 8.4.7 Rest of Asia Pacific
- 8.5 South America
- 8.5.1 Argentina
- 8.5.2 Brazil
- 8.5.3 Chile
- 8.5.4 Rest of South America
- 8.6 Middle East & Africa
- 8.6.1 Saudi Arabia
- 8.6.2 UAE
- 8.6.3 Qatar
- 8.6.4 South Africa
- 8.6.5 Rest of Middle East & Africa
9 Key Developments
- 9.1 Agreements, Partnerships, Collaborations and Joint Ventures
- 9.2 Acquisitions & Mergers
- 9.3 New Product Launch
- 9.4 Expansions
- 9.5 Other Key Strategies
10 Company Profiling
- 10.1 3M
- 10.2 Trelleborg AB
- 10.3 Bangs Laboratories Inc.
- 10.4 Siemens Healthineers AG
- 10.5 Potters Industries LLC
- 10.6 Chase Corporation
- 10.7 Nouryon
- 10.8 Cospheric LLC
- 10.9 Mo-sci Corporation (Heraeus Holdings)
- 10.10 Kureha Corporation
- 10.11 Momentive
- 10.12 Luminex Corporation (Diasorin Spa)
- 10.13 Merit Medical Systems
- 10.14 Matsumoto Yushi-seiyaku Co. Ltd
