|
|
市場調査レポート
商品コード
1308592
モビリティアプリケーション向けリサイクル材料(再生材料)市場の2030年までの予測:材料タイプ別、車両タイプ別、部品タイプ別、用途別、地域別の世界分析Recycled Materials for Mobility Applications Market Forecasts to 2030 - Global Analysis By Material Type, Vehicle Type, Component Type, Application and By Geography |
||||||
|
|
|||||||
カスタマイズ可能
|
|||||||


| モビリティアプリケーション向けリサイクル材料(再生材料)市場の2030年までの予測:材料タイプ別、車両タイプ別、部品タイプ別、用途別、地域別の世界分析 |
|
出版日: 2023年07月01日
発行: Stratistics Market Research Consulting
ページ情報: 英文 175+ Pages
納期: 2~3営業日
|

- 全表示
- 概要
- 図表
- 目次
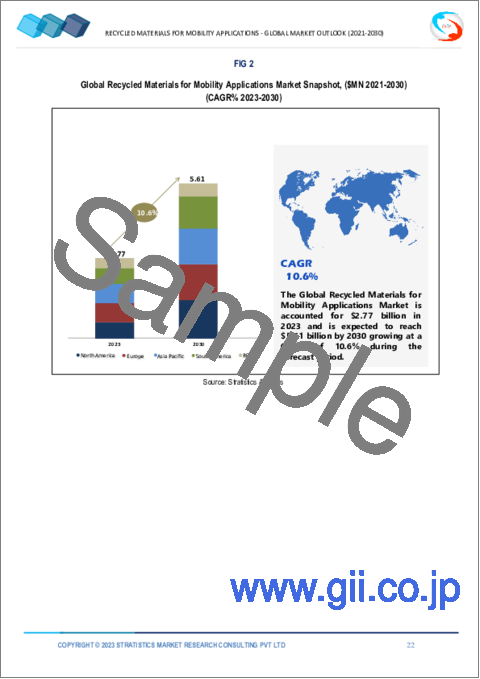
Stratistics MRCによると、モビリティアプリケーション向けリサイクル材料(再生材料)の世界市場は、2023年に27億7,000万米ドルを占め、予測期間中のCAGRは10.6%で成長し、2030年には56億1,000万米ドルに達すると予測されています。
自動車、部品、コンポーネントの製造など、モビリティアプリケーション向けリサイクル材料の利用が増加しています。モビリティアプリケーション向けリサイクル材料の使用は、環境負荷の低減、エネルギー消費の削減、コスト削減など、いくつかのメリットをもたらします。モビリティ産業におけるリサイクル材料の使用は、企業や消費者が環境への影響を意識するようになるにつれて広まってきました。
国際自動車工業会(OICA)によると、2020年の世界の自動車生産台数は7,760万台に達し、COVID-19の大流行により2019年比で16.2%減少しました。
市場力学:
促進要因
政府の対応とエネルギー効率に対する意識の高まり
リサイクル材料を利用することで、新しい材料を作る必要性が減り、エネルギーが大幅に節約されます。天然資源の採取、輸送、精製を含む、あらゆる種類のバージン材料の生産には、多大な労力とエネルギーが必要とされます。そのような材料の例としては、ポリマーや炭素繊維が挙げられます。したがって、新しい材料ではなくリサイクル材料を使用することで、生産者はより少ないエネルギーで同じ商品を生産することができます。したがって、予測期間中、省エネルギーに対する意識の高まりは、再生プラスチックの需要にプラスの影響を与えると予測されます。
抑制要因:
バージン材料の使用は強力な競合をもたらす
バージンプラスチックは、用途と品質の面で回収プラスチックと強く競合します。プラスチックの化学的構成が正確でなければならない高級品には、バージン材料しか使用できないかもしれないです。これまでバージンプラスチックは回収プラスチックよりも高価でしたが、中国のスクラップ禁止令の発表により、最近は状況が変わってきています。さらに、米国でシェールガスが発見されたことで、バージンプラスチックの重要な供給源である天然ガスのような化石燃料の生産源が新たに開発されました。その結果、安価なバージンプラスチック材料の市場供給が大幅に増加しました。
機会:
環境にやさしい商品の使用を規制する政府の政策
ドイツ、米国、日本などの先進諸国は、石油を原料とする製品よりも環境にやさしい製品の使用拡大を重視しています。自動車業界によれば、再生炭素繊維はますます多くの自動車モデルに使用されるようになっています。再生炭素繊維の使用量は、EUや米国、インド、日本などの国々が特に自動車や輸送分野で規制を強化した結果、増加すると予想されます。燃費向上とCO2排出量削減のため、EUでは新車の排出量削減目標が定められています。
脅威
再生プラスチックは非常に高価
バージンプラスチックの生産に必要な主な基礎原料は、石油・天然ガスなどの石油化学製品です。プラスチックのリサイクルには、R-ポリエチレンテレフタレート(PET)も含まれます。機械工学のティム・グトウスキー教授は、プラスチックのリサイクルの問題点は、純粋なリサイクル原料の流れを作ることだと主張します。プラスチック製品は、充填剤や着色剤などさまざまな添加物を使用して作られています。リサイクル事業者は、プラスチックに添加され、再生プラスチックで作られた製品の製造に影響を与える物質について知らないことが多いです。
COVID-19の影響:
COVID-19の大流行は、あらゆる産業に壊滅的な影響を及ぼしています。リサイクル材料の収集、加工、流通は、輸送の制限、リサイクル工場の時折の閉鎖、労働力の能力不足によって妨げられてきました。パンデミックの結果、消費者の行動は変化し、個人が衛生と安全に対してより慎重になっています。リサイクル材料ベースのモビリティアプリケーションへの需要は、この変化の影響を受けている可能性があります。例えば、共有の表面上でのウイルス感染の可能性が懸念されるため、カーシェアリングやバイクシェアリングのような共有モビリティサービスの需要が減少した可能性があります。
ポリマー材料セグメントは、予測期間中最大になると予想される:
再生プラスチック由来のポリマー材料は、強度対重量比に優れているため、モビリティ分野における軽量化用途に最適です。金属のような従来の材料に代わって使用することで、自動車、自転車、スクーター、その他のモビリティデバイスの全体的な重量を減らすことができます。その結果、燃費の向上、電気自動車のバッテリー寿命の延長、性能の向上につながります。リサイクルポリマー材料は、紫外線への暴露、温度変化、機械的ストレスなど、過酷な環境条件に耐えるように設計されています。そのため、自動車の外装や自転車のフレーム、部品といった屋外用途に適しています。
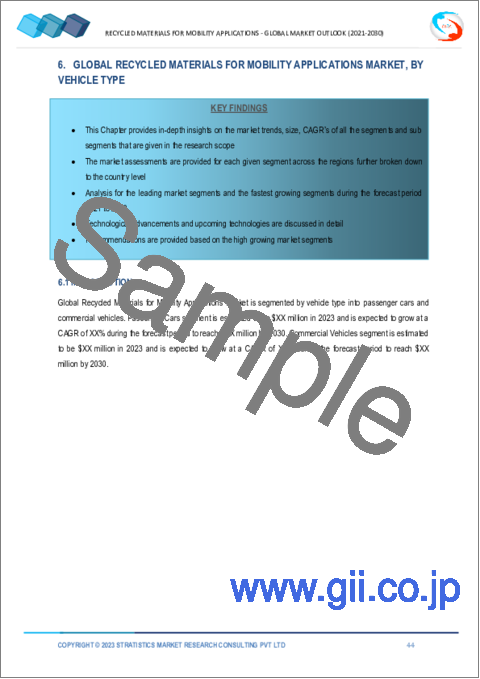
乗用車セグメントは、予測期間中に最も高いCAGRが見込まれる:
自動車産業が持続可能性と環境責任を追求するにつれて、乗用車におけるリサイクル材料の使用は勢いを増しています。シート、カーペット、ヘッドライナー、ドアパネル、ダッシュボードのトリミングなどの内装部品にはリサイクル材料が使用されています。これらの部品の製造には、リサイクルされたプラスチック、繊維、その他の材料が使用されます。ボディパネル、バンパー、トリムなどの外装部品の製造にも、リサイクル材料が使用されています。これらの部品には再生プラスチックが使用されており、軽量化、燃費向上、二酸化炭素排出量の削減だけでなく、持続可能性も促進されます。
最大のシェアを占める地域:
アジア太平洋地域は、人口と経済成長の面で最も急成長している地域と予想されます。同地域は過去10年間に著しい成長を遂げ、世界のGDPの3分の1以上を占めています。高い経済成長と人口の増加が相まって、同地域の産業セクターが活性化し、再生プラスチック・ポリマーや再生複合材といった再生材料に対する産業界のニーズが高まると予想されます。再生材料の継続的かつ容易な入手可能性、低コストの労働力、低価格、環境上の利点が、同地域のモビリティアプリケーション向けリサイクル材料市場を牽引しています。
CAGRが最も高い地域:
欧州は、持続可能性と循環型倹約に対する関心の高まりから、予測期間中にかなりの成長が見込まれます。欧州政府は、モビリティアプリケーションを含む様々な産業でリサイクル材料の使用を促進するために、厳しい規制やイニシアチブを実施しています。循環経済行動計画や欧州のグリーンディールなどの政策は、持続可能な実践を優先し、リサイクル材料の採用を奨励しています。こうした取り組みは、市場の成長を支える枠組みとなっています。
主な発展:
2022年3月、FORVIAグループの一員であるFaureciaとVeoliaは、自動車内装モジュール用の革新的なコンパウンドを共同開発するための協力・研究契約を締結し、2025年までにリサイクル含有率平均30%の達成を目指します。この提携により、両社は欧州における計器パネル、ドアパネル、センターコンソールへの画期的で持続可能な内装ソリューションの展開を加速します。
2020年11月、SGL CarbonとKoller Kunststofftechnikは、BMWグループの将来の大量生産モデル用フロントガラス用の新規リサイクル炭素繊維プロファイルの製造において提携。これにより、SGL Carbonは自動車製品の用途を改善し、再生炭素繊維の需要を拡大しました。
レポート内容
- 地域および国レベルセグメントの市場シェア評価
- 新規参入企業への戦略的提言
- 2021年、2022年、2023年、2026年、2030年の市場データをカバー
- 市場動向
- 市場推定に基づく主要ビジネスセグメントにおける戦略的提言
- 主要な共通トレンドをマッピングした競合情勢
- 詳細な戦略、財務、最近の動向を含む企業プロファイル
- 最新の技術動向をマッピングしたサプライチェーン動向
無料のカスタマイズサービス:
本レポートをご購読のお客様には、以下のいずれかの無料カスタマイズオプションをご提供いたします:
- 企業プロファイル
- 追加市場プレイヤーの包括的プロファイリング(3社まで)
- 主要企業のSWOT分析(3社まで)
- 地域セグメンテーション
- 顧客の関心に応じた主要国の市場推計・予測・CAGR(注:フィージビリティチェックによる)
- 競合ベンチマーキング
- 製品ポートフォリオ、地理的プレゼンス、戦略的提携に基づく主要企業のベンチマーキング
目次
第1章 エグゼクティブサマリー
第2章 序文
- エグゼクティブサマリー
- ステークホルダー
- 調査範囲
- 調査手法
- データマイニング
- データ分析
- データ検証
- 調査アプローチ
- 調査ソース
- 一次調査情報源
- 二次調査情報源
- 前提条件
第3章 市場動向分析
- 促進要因
- 抑制要因
- 機会
- 脅威
- 用途分析
- 新興市場
- COVID-19の影響
第4章 ポーターのファイブフォース分析
- 供給企業の交渉力
- 買い手の交渉力
- 代替品の脅威
- 新規参入業者の脅威
- 競争企業間の敵対関係
第5章 モビリティアプリケーション向けリサイクル材料の世界市場:材料タイプ別
- ポリマー材料
- 複合材料
- その他の材料タイプ
第6章 モビリティアプリケーション向けリサイクル材料の世界市場:車両タイプ別
- 乗用車
- 商用車
第7章 モビリティアプリケーション向けリサイクル材料の世界市場:部品タイプ別
- 内装
- 外装
- その他の部品タイプ
第8章 モビリティアプリケーション向けリサイクル材料の世界市場:用途別
- OEM
- アフターマーケット
- その他の用途
第9章 モビリティアプリケーション向けリサイクル材料の世界市場:地域別
- 北米
- 米国
- カナダ
- メキシコ
- 欧州
- ドイツ
- 英国
- イタリア
- フランス
- スペイン
- その他欧州
- アジア太平洋
- 日本
- 中国
- インド
- オーストラリア
- ニュージーランド
- 韓国
- その他アジア太平洋地域
- 南米
- アルゼンチン
- ブラジル
- チリ
- その他南米
- 中東・アフリカ
- サウジアラビア
- アラブ首長国連邦
- カタール
- 南アフリカ
- その他中東・アフリカ
第10章 主な発展
- 契約、パートナーシップ、提携、合弁事業
- 買収と合併
- 新製品の上市
- 事業拡大
- その他の主要戦略
第11章 企業プロファイル
- Carbon Fiber Recycling
- Celanese Corporation
- Continental AG
- Custom Polymers, Inc
- Faurecia
- Neste
- Procotex
- SGL Carbon
- Solvay
- Toray Industries, Inc
- Unifi, Inc
- Vartega Inc.
- Wellman Advanced Materials
List of Tables
- Table 1 Global Recycled Materials for Mobility Applications Market Outlook, By Region (2021-2030) ($MN)
- Table 2 Global Recycled Materials for Mobility Applications Market Outlook, By Material Type (2021-2030) ($MN)
- Table 3 Global Recycled Materials for Mobility Applications Market Outlook, By Polymer Materials (2021-2030) ($MN)
- Table 4 Global Recycled Materials for Mobility Applications Market Outlook, By Composite Materials (2021-2030) ($MN)
- Table 5 Global Recycled Materials for Mobility Applications Market Outlook, By Other Material Types (2021-2030) ($MN)
- Table 6 Global Recycled Materials for Mobility Applications Market Outlook, By Vehicle Type (2021-2030) ($MN)
- Table 7 Global Recycled Materials for Mobility Applications Market Outlook, By Passenger Cars (2021-2030) ($MN)
- Table 8 Global Recycled Materials for Mobility Applications Market Outlook, By Commercial Vehicles (2021-2030) ($MN)
- Table 9 Global Recycled Materials for Mobility Applications Market Outlook, By Component Type (2021-2030) ($MN)
- Table 10 Global Recycled Materials for Mobility Applications Market Outlook, By Interiors (2021-2030) ($MN)
- Table 11 Global Recycled Materials for Mobility Applications Market Outlook, By Exteriors (2021-2030) ($MN)
- Table 12 Global Recycled Materials for Mobility Applications Market Outlook, By Other Component Types (2021-2030) ($MN)
- Table 13 Global Recycled Materials for Mobility Applications Market Outlook, By Application (2021-2030) ($MN)
- Table 14 Global Recycled Materials for Mobility Applications Market Outlook, By OEMs (2021-2030) ($MN)
- Table 15 Global Recycled Materials for Mobility Applications Market Outlook, By Aftermarket (2021-2030) ($MN)
- Table 16 Global Recycled Materials for Mobility Applications Market Outlook, By Others Applications (2021-2030) ($MN)
- Table 17 North America Recycled Materials for Mobility Applications Market Outlook, By Country (2021-2030) ($MN)
- Table 18 North America Recycled Materials for Mobility Applications Market Outlook, By Material Type (2021-2030) ($MN)
- Table 19 North America Recycled Materials for Mobility Applications Market Outlook, By Polymer Materials (2021-2030) ($MN)
- Table 20 North America Recycled Materials for Mobility Applications Market Outlook, By Composite Materials (2021-2030) ($MN)
- Table 21 North America Recycled Materials for Mobility Applications Market Outlook, By Other Material Types (2021-2030) ($MN)
- Table 22 North America Recycled Materials for Mobility Applications Market Outlook, By Vehicle Type (2021-2030) ($MN)
- Table 23 North America Recycled Materials for Mobility Applications Market Outlook, By Passenger Cars (2021-2030) ($MN)
- Table 24 North America Recycled Materials for Mobility Applications Market Outlook, By Commercial Vehicles (2021-2030) ($MN)
- Table 25 North America Recycled Materials for Mobility Applications Market Outlook, By Component Type (2021-2030) ($MN)
- Table 26 North America Recycled Materials for Mobility Applications Market Outlook, By Interiors (2021-2030) ($MN)
- Table 27 North America Recycled Materials for Mobility Applications Market Outlook, By Exteriors (2021-2030) ($MN)
- Table 28 North America Recycled Materials for Mobility Applications Market Outlook, By Other Component Types (2021-2030) ($MN)
- Table 29 North America Recycled Materials for Mobility Applications Market Outlook, By Application (2021-2030) ($MN)
- Table 30 North America Recycled Materials for Mobility Applications Market Outlook, By OEMs (2021-2030) ($MN)
- Table 31 North America Recycled Materials for Mobility Applications Market Outlook, By Aftermarket (2021-2030) ($MN)
- Table 32 North America Recycled Materials for Mobility Applications Market Outlook, By Others Applications (2021-2030) ($MN)
- Table 33 Europe Recycled Materials for Mobility Applications Market Outlook, By Country (2021-2030) ($MN)
- Table 34 Europe Recycled Materials for Mobility Applications Market Outlook, By Material Type (2021-2030) ($MN)
- Table 35 Europe Recycled Materials for Mobility Applications Market Outlook, By Polymer Materials (2021-2030) ($MN)
- Table 36 Europe Recycled Materials for Mobility Applications Market Outlook, By Composite Materials (2021-2030) ($MN)
- Table 37 Europe Recycled Materials for Mobility Applications Market Outlook, By Other Material Types (2021-2030) ($MN)
- Table 38 Europe Recycled Materials for Mobility Applications Market Outlook, By Vehicle Type (2021-2030) ($MN)
- Table 39 Europe Recycled Materials for Mobility Applications Market Outlook, By Passenger Cars (2021-2030) ($MN)
- Table 40 Europe Recycled Materials for Mobility Applications Market Outlook, By Commercial Vehicles (2021-2030) ($MN)
- Table 41 Europe Recycled Materials for Mobility Applications Market Outlook, By Component Type (2021-2030) ($MN)
- Table 42 Europe Recycled Materials for Mobility Applications Market Outlook, By Interiors (2021-2030) ($MN)
- Table 43 Europe Recycled Materials for Mobility Applications Market Outlook, By Exteriors (2021-2030) ($MN)
- Table 44 Europe Recycled Materials for Mobility Applications Market Outlook, By Other Component Types (2021-2030) ($MN)
- Table 45 Europe Recycled Materials for Mobility Applications Market Outlook, By Application (2021-2030) ($MN)
- Table 46 Europe Recycled Materials for Mobility Applications Market Outlook, By OEMs (2021-2030) ($MN)
- Table 47 Europe Recycled Materials for Mobility Applications Market Outlook, By Aftermarket (2021-2030) ($MN)
- Table 48 Europe Recycled Materials for Mobility Applications Market Outlook, By Others Applications (2021-2030) ($MN)
- Table 49 Asia Pacific Recycled Materials for Mobility Applications Market Outlook, By Country (2021-2030) ($MN)
- Table 50 Asia Pacific Recycled Materials for Mobility Applications Market Outlook, By Material Type (2021-2030) ($MN)
- Table 51 Asia Pacific Recycled Materials for Mobility Applications Market Outlook, By Polymer Materials (2021-2030) ($MN)
- Table 52 Asia Pacific Recycled Materials for Mobility Applications Market Outlook, By Composite Materials (2021-2030) ($MN)
- Table 53 Asia Pacific Recycled Materials for Mobility Applications Market Outlook, By Other Material Types (2021-2030) ($MN)
- Table 54 Asia Pacific Recycled Materials for Mobility Applications Market Outlook, By Vehicle Type (2021-2030) ($MN)
- Table 55 Asia Pacific Recycled Materials for Mobility Applications Market Outlook, By Passenger Cars (2021-2030) ($MN)
- Table 56 Asia Pacific Recycled Materials for Mobility Applications Market Outlook, By Commercial Vehicles (2021-2030) ($MN)
- Table 57 Asia Pacific Recycled Materials for Mobility Applications Market Outlook, By Component Type (2021-2030) ($MN)
- Table 58 Asia Pacific Recycled Materials for Mobility Applications Market Outlook, By Interiors (2021-2030) ($MN)
- Table 59 Asia Pacific Recycled Materials for Mobility Applications Market Outlook, By Exteriors (2021-2030) ($MN)
- Table 60 Asia Pacific Recycled Materials for Mobility Applications Market Outlook, By Other Component Types (2021-2030) ($MN)
- Table 61 Asia Pacific Recycled Materials for Mobility Applications Market Outlook, By Application (2021-2030) ($MN)
- Table 62 Asia Pacific Recycled Materials for Mobility Applications Market Outlook, By OEMs (2021-2030) ($MN)
- Table 63 Asia Pacific Recycled Materials for Mobility Applications Market Outlook, By Aftermarket (2021-2030) ($MN)
- Table 64 Asia Pacific Recycled Materials for Mobility Applications Market Outlook, By Others Applications (2021-2030) ($MN)
- Table 65 South America Recycled Materials for Mobility Applications Market Outlook, By Country (2021-2030) ($MN)
- Table 66 South America Recycled Materials for Mobility Applications Market Outlook, By Material Type (2021-2030) ($MN)
- Table 67 South America Recycled Materials for Mobility Applications Market Outlook, By Polymer Materials (2021-2030) ($MN)
- Table 68 South America Recycled Materials for Mobility Applications Market Outlook, By Composite Materials (2021-2030) ($MN)
- Table 69 South America Recycled Materials for Mobility Applications Market Outlook, By Other Material Types (2021-2030) ($MN)
- Table 70 South America Recycled Materials for Mobility Applications Market Outlook, By Vehicle Type (2021-2030) ($MN)
- Table 71 South America Recycled Materials for Mobility Applications Market Outlook, By Passenger Cars (2021-2030) ($MN)
- Table 72 South America Recycled Materials for Mobility Applications Market Outlook, By Commercial Vehicles (2021-2030) ($MN)
- Table 73 South America Recycled Materials for Mobility Applications Market Outlook, By Component Type (2021-2030) ($MN)
- Table 74 South America Recycled Materials for Mobility Applications Market Outlook, By Interiors (2021-2030) ($MN)
- Table 75 South America Recycled Materials for Mobility Applications Market Outlook, By Exteriors (2021-2030) ($MN)
- Table 76 South America Recycled Materials for Mobility Applications Market Outlook, By Other Component Types (2021-2030) ($MN)
- Table 77 South America Recycled Materials for Mobility Applications Market Outlook, By Application (2021-2030) ($MN)
- Table 78 South America Recycled Materials for Mobility Applications Market Outlook, By OEMs (2021-2030) ($MN)
- Table 79 South America Recycled Materials for Mobility Applications Market Outlook, By Aftermarket (2021-2030) ($MN)
- Table 80 South America Recycled Materials for Mobility Applications Market Outlook, By Others Applications (2021-2030) ($MN)
- Table 81 Middle East & Africa Recycled Materials for Mobility Applications Market Outlook, By Country (2021-2030) ($MN)
- Table 82 Middle East & Africa Recycled Materials for Mobility Applications Market Outlook, By Material Type (2021-2030) ($MN)
- Table 83 Middle East & Africa Recycled Materials for Mobility Applications Market Outlook, By Polymer Materials (2021-2030) ($MN)
- Table 84 Middle East & Africa Recycled Materials for Mobility Applications Market Outlook, By Composite Materials (2021-2030) ($MN)
- Table 85 Middle East & Africa Recycled Materials for Mobility Applications Market Outlook, By Other Material Types (2021-2030) ($MN)
- Table 86 Middle East & Africa Recycled Materials for Mobility Applications Market Outlook, By Vehicle Type (2021-2030) ($MN)
- Table 87 Middle East & Africa Recycled Materials for Mobility Applications Market Outlook, By Passenger Cars (2021-2030) ($MN)
- Table 88 Middle East & Africa Recycled Materials for Mobility Applications Market Outlook, By Commercial Vehicles (2021-2030) ($MN)
- Table 89 Middle East & Africa Recycled Materials for Mobility Applications Market Outlook, By Component Type (2021-2030) ($MN)
- Table 90 Middle East & Africa Recycled Materials for Mobility Applications Market Outlook, By Interiors (2021-2030) ($MN)
- Table 91 Middle East & Africa Recycled Materials for Mobility Applications Market Outlook, By Exteriors (2021-2030) ($MN)
- Table 92 Middle East & Africa Recycled Materials for Mobility Applications Market Outlook, By Other Component Types (2021-2030) ($MN)
- Table 93 Middle East & Africa Recycled Materials for Mobility Applications Market Outlook, By Application (2021-2030) ($MN)
- Table 94 Middle East & Africa Recycled Materials for Mobility Applications Market Outlook, By OEMs (2021-2030) ($MN)
- Table 95 Middle East & Africa Recycled Materials for Mobility Applications Market Outlook, By Aftermarket (2021-2030) ($MN)
- Table 96 Middle East & Africa Recycled Materials for Mobility Applications Market Outlook, By Others Applications (2021-2030) ($MN)
According to Stratistics MRC, the Global Recycled Materials for Mobility Applications Market is accounted for $2.77 billion in 2023 and is expected to reach $5.61 billion by 2030 growing at a CAGR of 10.6% during the forecast period. Recycled materials are being increasingly used in mobility applications, such as in the manufacturing of vehicles, parts, and components. The use of recycled materials in mobility applications offers several benefits, including reduced environmental impact, reduced energy consumption, and cost saving. The use of recycled materials in the mobility industry has been gaining traction as companies and consumers are becoming more conscious about their environmental impact.
According to the International Organization of Motor Vehicle Manufacturers (OICA), global automobile production reached 77.6 million units in 2020, a decrease of 16.2% compared to 2019 due to the COVID-19 pandemic.
Market Dynamics:
Driver:
Increasing government responses and awareness of energy efficiency
Utilizing recycled materials reduces the need to create new materials, which conserves a significant amount of energy. Any sort of virgin material production, including the extraction, transportation, and refinement of natural resources, requires a significant amount of work and energy. Examples of such materials are polymers and carbon fiber. Thus, using recycled materials rather than new ones enables producers to produce the same goods with a lot less energy. Therefore, during the projection period, increased awareness of energy conservation is projected to positively impact the demand for recycled plastics.
Restraint:
The use of virgin materials poses strong competition.
Virgin plastics compete strongly with recovered plastics in terms of applicability and quality. For high-end items, where the chemical makeup of the plastic must be precise, only virgin materials may be used. Although virgin plastics have historically been more expensive than recovered plastics, the situation has lately altered as a result of the announcement of the Chinese scrap ban. Additionally, the US's discovery of shale gas has opened up a new source for the production of fossil fuels like natural gas, which is a significant supplier of virgin plastics. As a result, the market's supply of cheap virgin plastic materials has increased significantly.
Opportunity:
Government policies governing the usage of environmentally friendly goods
Developed nations like Germany, the US, and Japan are emphasizing expanding the usage of environmentally friendly products rather than those made from petroleum. Recycled carbon fiber is being used in more and more car models, according to the automotive industry. The usage of recycled carbon fiber is anticipated to rise as a result of regulatory regulations enforced by the EU and other nations like the US, India, and Japan, particularly in the automotive and transportation sectors. For enhancements in fuel efficiency and decreases in CO2 emissions, the EU legislation establishes required emission reduction targets for new cars.
Threat:
Recycled plastics are very expensive
The main basic materials needed to produce virgin plastics are petrochemicals, like oil and natural gas. Recycling plastics includes R-polyethylene terephthalate (PET). Professor of mechanical engineering Tim Gutowski claims that the problem with recycling plastic is the creation of a pure stream of recycled material. Plastic products are created using a variety of additives, such as fillers and colorants. Recycling businesses frequently are unaware of the substances added to plastic that affect the creation of items made of recycled plastic.
COVID-19 Impact:
The COVID-19 pandemic has had a devastating impact on every industry. The collection, processing, and distribution of recycled materials have been hampered by transportation restrictions, occasional closures of recycling plants, and a shortage of labor force capability. Consumer behavior has changed as a result of the pandemic, and individuals are now more cautious about hygiene and safety. The demand for recycled-materials-based mobility applications may have been impacted by this change. For instance, due to worries about possible virus transmission over shared surfaces, there may have been a decline in demand for shared mobility services like car or bike sharing.
The Polymer materials segment is expected to be the largest during the forecast period:
Polymer materials derived from recycled plastics offer excellent strength-to-weight ratios, making them ideal for lightweight applications in the mobility sector. They can be used to replace traditional materials like metal, reducing the overall weight of vehicles, bicycles, scooters, and other mobility devices. This, in turn, can lead to improved fuel efficiency, extended battery life in electric vehicles, and enhanced performance. Recycled polymer materials are engineered to withstand harsh environmental conditions, including exposure to UV radiation, temperature fluctuations, and mechanical stress. This makes them well-suited for outdoor applications such as vehicle exteriors, bike frames and components.
The Passenger cars segment is expected to have the highest CAGR during the forecast period:
The use of recycled materials in passenger cars is gaining momentum as the automotive industry strives for sustainability and environmental responsibility. In interior parts like seats, carpets, headliners, door panels, and dashboard trimmings, recycled materials are used. Plastics, textiles, and other materials that have been recycled can be used to create these components. The manufacture of exterior parts, such as body panels, bumpers, and trim, also makes use of recycled materials. Recycled plastics are used in these components, which promotes sustainability as well as weight reduction, increased fuel efficiency, and lower carbon emissions.
Region with largest share:
Asia Pacific is expected to be the fastest-growing region in terms of population and economic growth. The region has experienced significant growth in the last decade, accounting for over a third of the world's GDP. The high economic growth, coupled with the mounting population, is expected to boost the industrial sector in the region, which will increase the need for recycled materials such as recycled plastic polymers and recycled composites from industries. Continuous and easy availability of recycled materials, low-cost labor, a lower price, and environmental benefits drive the recycled materials for mobility applications market in the region.
Region with highest CAGR:
Europe is anticipated to experience considerable growth during the projection period as a result of growing concerns about sustainability and circular frugality. European governments have implemented stringent regulations and initiatives to promote the use of recycled materials in various industries, including mobility applications. Policies such as the Circular Economy Action Plan and the European Green Deal prioritize sustainable practices and encourage the adoption of recycled materials. These initiatives provide a supportive framework for the growth of the market.
Key players in the market
Some of the key players in Recycled Materials for Mobility Applications market include Toray Industries, Inc, Solvay, Faurecia, Continental AG, Neste, Unifi, Inc, Celanese Corporation, Custom Polymers, Inc, Procotex, Carbon Fiber Recycling, SGL Carbon, Wellman Advanced Materials and Vartega Inc.
Key Developments:
In March 2022, Faurecia, a company of the Group FORVIA, and Veolia have signed a cooperation and research agreement to jointly develop innovative compounds for automotive interior modules, aiming to achieve an average of 30% of recycled content by 2025. Through this partnership, the two companies will accelerate the deployment of breakthrough sustainable interior solutions implemented in instrument panels, door panels, and center consoles in Europe
In October 2021, Vartega Inc. and Aditya Birla signed an MoU to develop the recycling value chain for Recyclamine based composites
In November 2020, SGL Carbon and Koller Kunststofftechnik partnered to manufacture novel recycled carbon fiber profiles for windshields for a future high-volume model of the BMW Group. This helped SGL Carbon improve its automobile product applications and increase the demand for recycled carbon fiber
Material Types Covered:
- Polymer Materials
- Composite Materials
- Other Material Types
Vehicle Types Covered:
- Passenger Cars
- Commercial Vehicles
Components Covered:
- Interiors
- Exteriors
- Other Components
Applications Covered:
- OEMs
- Aftermarket
- Other Applications
Regions Covered:
- North America
- US
- Canada
- Mexico
- Europe
- Germany
- UK
- Italy
- France
- Spain
- Rest of Europe
- Asia Pacific
- Japan
- China
- India
- Australia
- New Zealand
- South Korea
- Rest of Asia Pacific
- South America
- Argentina
- Brazil
- Chile
- Rest of South America
- Middle East & Africa
- Saudi Arabia
- UAE
- Qatar
- South Africa
- Rest of Middle East & Africa
What our report offers:
- Market share assessments for the regional and country-level segments
- Strategic recommendations for the new entrants
- Covers Market data for the years 2021, 2022, 2023, 2026 and 2030
- Market Trends (Drivers, Constraints, Opportunities, Threats, Challenges, Investment Opportunities, and recommendations)
- Strategic recommendations in key business segments based on the market estimations
- Competitive landscaping mapping the key common trends
- Company profiling with detailed strategies, financials, and recent developments
- Supply chain trends mapping the latest technological advancements
Free Customization Offerings:
All the customers of this report will be entitled to receive one of the following free customization options:
- Company Profiling
- Comprehensive profiling of additional market players (up to 3)
- SWOT Analysis of key players (up to 3)
- Regional Segmentation
- Market estimations, Forecasts and CAGR of any prominent country as per the client's interest (Note: Depends on feasibility check)
- Competitive Benchmarking
- Benchmarking of key players based on product portfolio, geographical presence, and strategic alliances
Table of Contents
1 Executive Summary
2 Preface
- 2.1 Abstract
- 2.2 Stake Holders
- 2.3 Research Scope
- 2.4 Research Methodology
- 2.4.1 Data Mining
- 2.4.2 Data Analysis
- 2.4.3 Data Validation
- 2.4.4 Research Approach
- 2.5 Research Sources
- 2.5.1 Primary Research Sources
- 2.5.2 Secondary Research Sources
- 2.5.3 Assumptions
3 Market Trend Analysis
- 3.1 Introduction
- 3.2 Drivers
- 3.3 Restraints
- 3.4 Opportunities
- 3.5 Threats
- 3.6 Application Analysis
- 3.7 Emerging Markets
- 3.8 Impact of Covid-19
4 Porters Five Force Analysis
- 4.1 Bargaining power of suppliers
- 4.2 Bargaining power of buyers
- 4.3 Threat of substitutes
- 4.4 Threat of new entrants
- 4.5 Competitive rivalry
5 Global Recycled Materials for Mobility Applications Market, By Material Type
- 5.1 Introduction
- 5.2 Polymer Materials
- 5.3 Composite Materials
- 5.4 Other Material Types
6 Global Recycled Materials for Mobility Applications Market, By Vehicle Type
- 6.1 Introduction
- 6.2 Passenger Cars
- 6.3 Commercial Vehicles
7 Global Recycled Materials for Mobility Applications Market, By Component Type
- 7.1 Introduction
- 7.2 Interiors
- 7.3 Exteriors
- 7.4 Other Component Types
8 Global Recycled Materials for Mobility Applications Market, By Application
- 8.1 Introduction
- 8.2 OEMs
- 8.3 Aftermarket
- 8.4 Others Applications
9 Global Recycled Materials for Mobility Applications Market, By Geography
- 9.1 Introduction
- 9.2 North America
- 9.2.1 US
- 9.2.2 Canada
- 9.2.3 Mexico
- 9.3 Europe
- 9.3.1 Germany
- 9.3.2 UK
- 9.3.3 Italy
- 9.3.4 France
- 9.3.5 Spain
- 9.3.6 Rest of Europe
- 9.4 Asia Pacific
- 9.4.1 Japan
- 9.4.2 China
- 9.4.3 India
- 9.4.4 Australia
- 9.4.5 New Zealand
- 9.4.6 South Korea
- 9.4.7 Rest of Asia Pacific
- 9.5 South America
- 9.5.1 Argentina
- 9.5.2 Brazil
- 9.5.3 Chile
- 9.5.4 Rest of South America
- 9.6 Middle East & Africa
- 9.6.1 Saudi Arabia
- 9.6.2 UAE
- 9.6.3 Qatar
- 9.6.4 South Africa
- 9.6.5 Rest of Middle East & Africa
10 Key Developments
- 10.1 Agreements, Partnerships, Collaborations and Joint Ventures
- 10.2 Acquisitions & Mergers
- 10.3 New Product Launch
- 10.4 Expansions
- 10.5 Other Key Strategies
11 Company Profiling
- 11.1 Carbon Fiber Recycling
- 11.2 Celanese Corporation
- 11.3 Continental AG
- 11.4 Custom Polymers, Inc
- 11.5 Faurecia
- 11.6 Neste
- 11.7 Procotex
- 11.8 SGL Carbon
- 11.9 Solvay
- 11.10 Toray Industries, Inc
- 11.11 Unifi, Inc
- 11.12 Vartega Inc.
- 11.13 Wellman Advanced Materials
