|
|
市場調査レポート
商品コード
1284074
グリーンテクノロジーとサステナビリティ市場の2028年までの予測-コンポーネント別、組織規模別、展開モード別、技術別、用途別、エンドユーザー別、地域別の世界分析Green Technology and Sustainability Market Forecasts to 2028 - Global Analysis By Component, By Organization Size, By Deployment Mode, By Technology, By Application, By End User and By Geography |
||||||
|
|
|||||||
カスタマイズ可能
|
|||||||


| グリーンテクノロジーとサステナビリティ市場の2028年までの予測-コンポーネント別、組織規模別、展開モード別、技術別、用途別、エンドユーザー別、地域別の世界分析 |
|
出版日: 2023年06月01日
発行: Stratistics Market Research Consulting
ページ情報: 英文 175+ Pages
納期: 2~3営業日
|

- 全表示
- 概要
- 図表
- 目次
ストラティスティックスMRCによると、世界のグリーンテクノロジーとサステナビリティ市場は、2022年に162億米ドルを占め、2028年には643億米ドルに達すると予測され、予測期間中に25.8%のCAGRで成長すると予想されています。
グリーンテクノロジー(持続可能な技術)は、環境に対する行動の直接的な影響と長期的な影響の両方を扱うものです。リサイクル、再生可能な資源の使用、健康と安全への配慮、エネルギー効率などは、グリーンテクノロジーの一例です。グリーンテックに分類される技術やシステムは、より少ないエネルギーや資源を利用し、再生可能な資源に依存し、クリーンなエネルギーを生成し、環境破壊を最小限に抑え、修復することを支援します。
世界経済フォーラムによると、イーサリアム2.0が登場し、ブロックチェーンのコンセンサスモデルがPoW(Proof of Work)からPoS(Proof of Stake)に移行することで、エネルギー消費量が99.0%減少すると予想されています。PoSはPoWより少ないハードウェアで済み、安全な取引をサポートするために必要なエネルギー量が減少します。
市場力学:
促進要因
環境に対する意識と関心の高まり
世界化により世界は新たな成長を遂げ、インドや中国をはじめとする多くの発展途上国の発展も加速しています。そのため、開発やグローバリゼーションを目的とした環境破壊が絶えません。このままでは、地球とその環境はいつまでたっても持続可能な生活には適さないと、環境とエコロジーに関心を持つ人々は考えています。そこで、世界化に伴う発展を継続させながら、環境への負荷を最小限に抑えるように技術を活用する「グリーンテクノロジー」という言葉が生まれました。
抑制要因
グリーンテクノロジーとサステナビリティソリューションのコスト高
多くの伝統的な製造プロセスで外部化されている環境コストは、グリーンテクノロジーとサステナビリティ・ソリューションに代表されるものであり、これらは一般的に、代替となるはずのレガシーテクノロジーよりも高価です。グリーンテクノロジーとサステナビリティはまだ発展途上であるため、確立された技術よりも開発・訓練コストがかかると予想されます。初期導入コストが高いため、特定の企業がグリーンテクノロジーやサステイナビリティ・ソリューションを採用することができず、市場の成長が妨げられる可能性があります。
機会
グリーンデータセンターの利用拡大
グリーンデータセンター技術は、主にグリーン・クラウド・コンピューティングで導入されています。データ管理、ストレージ、運用は、主にグリーンデータセンターのエネルギー効率の高い技術によって行われ、しばしばサステナブルデータセンターと呼ばれます。2020年米国データセンター・エネルギー使用レポートでは、2020年に米国のデータセンターで730億kWhが使用されると推定しています。さらに、欧州委員会によると、欧州のデータセンターでは259TWhの電力が使用されることになります。しかし、このような高いエネルギー消費のため、グリーンデータセンターはあらゆる分野で採用され、グリーンテクノロジーとサステナビリティ分野の拡大が加速されるでしょう。
脅威
環境問題に対する専門的なソリューションの欠如
新しい技術開発は、従来、カーボンフットプリントの拡大やその他の環境問題と結びついてきました。現在、最大の環境問題には、気候変動、生物多様性の損失、水質の悪化、増加する人類に十分な栄養を供給することなどが含まれます。これらの課題を解決するためには、膨大な量のデータを収集・分析し、新たな知見を提供し、大きな変化をもたらすようなカスタマイズされたソリューションや技術が必要となっています。世界では、センサーやドローンを使ってデータを収集し、機械学習(ML)や分析によって有用な情報に変換して、天然資源の管理を向上させるビジネスが行われています。しかし、環境問題に対処するためのいくつかのユニークな戦略もあります。例えば、企業や科学者は、気候変動の課題に対処するための解決策を模索しています。
COVID-19の影響
グリーンテクノロジーとサステナビリティの市場はここ数年で大きく成長しましたが、COVID-19の大流行により、2020年には微減すると予想されています。これは、大多数の政府が国民を拘束し、世界中で進行中のさまざまな太陽光発電や風力発電のプロジェクトを停止させたためです。さらに、厳しい社会的距離を置く措置のため、住宅やその他の産業プロジェクトにささやかなソーラーパネルを設置することさえも保留されています。しかし、世界中の多くのグリーンテクノロジーソリューションプロバイダーは、競争力を維持し市場価値を高めるために、新しいビジネスプランと戦略を導入しています。
予測期間中、ソリューション分野が最も大きくなると予想される
グリーンテクノロジーとサステナビリティのソリューションは、消費者にリアルタイムの統計、チャート作成およびモニタリングツール、管理サービスなどを提供するという事実により、ソリューションカテゴリは予測期間中、市場で最大のシェアを占めると予測されます。また、中小企業向けには、環境モニタリングや再生可能エネルギー活用のためのツールがあり、強固で信頼性の高いインフラの構築や健全な生態系の強化に貢献することで、市場の成長をさらに加速させることが期待されます。
予測期間中、中小企業セグメントのCAGRが最も高くなると予想されます。
中小企業は、技術的な進歩を徐々に取り入れて事業運営を強化しているため、予測期間中、最も高いCAGRを記録すると予想されます。中小企業はモノのインターネット(IoT)を導入するのに適した立場にあり、この技術に簡単にアクセスできるため、収益性と持続可能性を高めることができます。しかし、IoTソリューションは、中小企業がグリーン認証の基準や要件をよりよく遵守することを支援します。中小企業は、適切な補助金や政府の支援を受けることで、新しい市場や財源にアクセスすることができます。
最もシェアの大きい地域:
Microsoft Corporation、GE Electric、IBM Corporation、Oracle Corporation、Engie Impact、CropX Inc.、Taranisなどの大手企業が存在するため、北米は予測期間中、世界市場で最大のシェアを占めると予想されています。また、これらの企業は、パートナーシップ、合併、協業などの様々な企業戦略を活用することで、世界各地での商業的プレゼンスを高めようとしています。さらに、この地域はグリーンテクノロジーとサステナビリティのプロバイダーとの幅広いネットワークがあるため、急速なペースで成長すると思われます。この地域の経済が確立されている結果、グリーンテクノロジーとサステナビリティのベンダーは、技術のブレークスルーとイノベーションに投資することができます。この地域はイノベーションの拠点として有名で、IT企業が新製品を発表したり、グリーンテクノロジーとサステナビリティのソリューションで積極的に協力したりしています。
CAGRが最も高い地域:
予測期間中、アジア太平洋地域の市場は最も高いCAGRを記録すると予想されます。この地域の主な経済大国は、中国、日本、台湾、インド、韓国です。低炭素で再生可能なエネルギー政策の開発は、これらの国の政府からさまざまなレベルの支援を受けています。太陽光発電や風力発電、スマートグリッド、電気自動車、グリーンビルディングなど、再生可能エネルギーのインフラ整備のための新興国市場開拓に資源を投入しています。国際市場の拡大と、クリーンテクノロジーを活用した製品の輸出におけるこの地域の成功は、これらの事業と密接に関連しています。
主な発展:
2023年5月、マイクロソフトは新しいPaymentsアプリを発表しました。このアプリにより、中小企業はデスクトップまたはモバイルデバイスのTeams内から、会議中に簡単に支払いを管理・回収できるようになります。このアプリは当初、米国とカナダのユーザーを対象に提供される予定です。さらに、Teamsの中核となるコラボレーション機能と強力なコマース機能を組み合わせるため、ペイメント分野の最大手企業と提携したとのことです。
2023年4月、GEパワーコンバージョンは、ペトロブラスの浮体式生産貯蔵積出設備(FPSO)用の電気モジュール2基(コード:P-80、P-83)の設計・供給・納入先としてケッペル・シップヤードに採用され、洋上エネルギー生産に使われることになりました。このモジュールは、GEのアジアとブラジルの両チームによる専門的なサポートと専門知識を活用し、2024年と2025年にシンガポールに納入され、トップサイドに統合される予定です。
2022年5月、ドイツとインドは、グリーンで持続可能な開発のためのインド・ドイツ・パートナーシップを開始しました。ドイツは、2030年までにインドのグリーン成長計画を支援するため、さらに段階的に110億米ドル相当の資金を提供することを約束しました。この支援は、グリーンで持続可能な開発に関する共同意向宣言(JDI)のもと、インドに提供されました。
2022年2月、IBMコーポレーションは「IBMサステナビリティ・アクセラレーター」を発表しました。これは、AI、ハイブリッド・クラウドなどのIBMテクノロジーと専門家のエコシステムを活用して、政府機関や非営利団体が、異常気象&気候変動や汚染などの環境脅威に対して脆弱な人々に焦点を当て、業務の改善と拡張を支援する、プロフェッショナルなソーシャルインパクトプログラムです。
2022年1月、シュナイダーエレクトリックは、スマートかつグリーンなインフラストラクチャのための統合ソリューション群「Infrastructure of the Future」を発表しました。この統合ソリューションには、エネルギー移行を加速するための分析的洞察、事業継続&運用サービス、グリーンテクノロジー&サステナビリティソリューション、e-モビリティ、プログラム用ソフトウェアが含まれています。
2021年3月、CropX Inc.は、食料安全保障と農業のプログラムであるNASA Harvestとパートナーシップを結びました。このパートナーシップは、CropXの衛星および土壌データモニタリングソリューションから得られる知見を利用して農業生産を支援・改善することにより、持続可能な農業の推進と食料安全保障の向上に貢献しました。
私たちのレポートが提供するもの
- 地域および国レベルセグメントの市場シェア評価
- 新規参入企業への戦略的提言
- 2020年、2021年、2022年、2025年、2028年の市場データを網羅
- 市場促進要因(市場動向、制約要因、機会、脅威、課題、投資機会、推奨事項)。
- 市場推定に基づく、主要ビジネスセグメントにおける戦略的提言
- 主要な共通トレンドをマッピングした競合情勢。
- 詳細な戦略、財務、最近の開発状況を含む企業プロファイル
- 最新の技術的進歩をマッピングしたサプライチェーン動向
無料のカスタマイズ提供:
本レポートをご購入いただいたお客様には、以下の無料カスタマイズオプションのいずれかを提供させていただきます:
- 企業プロファイル
- 追加市場プレイヤーの包括的なプロファイリング(最大3社まで)
- 主要プレイヤーのSWOT分析(3社まで)
- 地域別セグメンテーション
- お客様のご希望に応じて、主要国の市場推計・予測・CAGR(注:フィージビリティチェックによる。)
- 競合ベンチマーキング
- 製品ポートフォリオ、地域的プレゼンス、戦略的提携に基づく主要プレイヤーのベンチマーキング
目次
第1章 エグゼクティブサマリー
第2章 序文
- 概要
- ステークホルダー
- 調査範囲
- 調査手法
- データマイニング
- データ分析
- データ検証
- 調査アプローチ
- 調査ソース
- 1次調査ソース
- 2次調査ソース
- 仮定
第3章 市場動向分析
- 促進要因
- 抑制要因
- 機会
- 脅威
- 技術分析
- アプリケーション分析
- エンドユーザー分析
- 新興市場
- 新型コロナウイルス感染症(COVID-19)の影響
第4章 ポーターのファイブフォース分析
- 供給企業の交渉力
- 買い手の交渉力
- 代替品の脅威
- 新規参入業者の脅威
- 競争企業間の敵対関係
第5章 世界のグリーンテクノロジーとサステナビリティ市場:コンポーネント別
- サービス
- 統合と展開
- コンサルティング
- サポートとメンテナンス
- 解決
- その他のコンポーネント
第6章 世界のグリーンテクノロジーとサステナビリティ市場:組織規模別
- 大企業
- 中小企業
- その他の組織規模
第7章 世界のグリーンテクノロジーとサステナビリティ市場:展開モード別
- オンプレミス
- クラウド
- 他の展開モード
第8章 世界のグリーンテクノロジーとサステナビリティ市場:技術別
- ブロックチェーン
- サイバーセキュリティ
- デジタルツイン
- 人工知能と分析
- クラウドコンピューティング
- モノのインターネット(IoT)
- エッジコンピューティング
- その他の技術
第9章 世界のグリーンテクノロジーとサステナビリティ市場:用途別
- 火災検知
- 持続可能な採掘と探査
- 水の浄化
- 土壌状態/水分モニタリング
- 作物監視
- 森林モニタリング
- 大気汚染と水質汚染の監視
- 気象監視と天気予報
- 二酸化炭素排出量の管理
- グリーンビルディング
- 水漏れ検知
- 水管理
- その他の用途
第10章 世界のグリーンテクノロジーとサステナビリティ市場:エンドユーザー別
- 金融業務
- 公的機関
- 小売および消費者向けパッケージ商品
- 化学薬品
- 工業製造業
- 旅行と交通
- エネルギーと公共事業
- 銀行、金融サービス、保険
- その他のエンドユーザー
第11章 世界のグリーンテクノロジーとサステナビリティ市場:地域
- 北米
- 米国
- カナダ
- メキシコ
- 欧州
- ドイツ
- 英国
- イタリア
- フランス
- スペイン
- その他欧州
- アジア太平洋地域
- 日本
- 中国
- インド
- オーストラリア
- ニュージーランド
- 韓国
- その他アジア太平洋地域
- 南米
- アルゼンチン
- ブラジル
- チリ
- その他南米
- 中東とアフリカ
- サウジアラビア
- アラブ首長国連邦
- カタール
- 南アフリカ
- その他中東とアフリカ
第12章 主な発展
- 契約、パートナーシップ、コラボレーション、合弁事業
- 買収と合併
- 新製品の発売
- 事業拡大
- その他の主要戦略
第13章 会社概要
- Wolters Kluwer N.V.
- General Electric
- Salesforce, Inc.
- Microsoft
- Schneider Electric
- Engie Impact
- Cority
- Sensus, A Xylem Brand
- LO3 Energy
- CropX Inc.
- Enablon
- Salesforce.com Inc
- Intelex Technologies Inc.
List of Tables
- Table 1 Global Green Technology and Sustainability Market Outlook, By Region (2020-2028) ($MN)
- Table 2 Global Green Technology and Sustainability Market Outlook, By Component (2020-2028) ($MN)
- Table 3 Global Green Technology and Sustainability Market Outlook, By Services (2020-2028) ($MN)
- Table 4 Global Green Technology and Sustainability Market Outlook, By Integration and Deployment (2020-2028) ($MN)
- Table 5 Global Green Technology and Sustainability Market Outlook, By Consulting (2020-2028) ($MN)
- Table 6 Global Green Technology and Sustainability Market Outlook, By Support and Maintenance (2020-2028) ($MN)
- Table 7 Global Green Technology and Sustainability Market Outlook, By Solution (2020-2028) ($MN)
- Table 8 Global Green Technology and Sustainability Market Outlook, By Other Components (2020-2028) ($MN)
- Table 9 Global Green Technology and Sustainability Market Outlook, By Organization Size (2020-2028) ($MN)
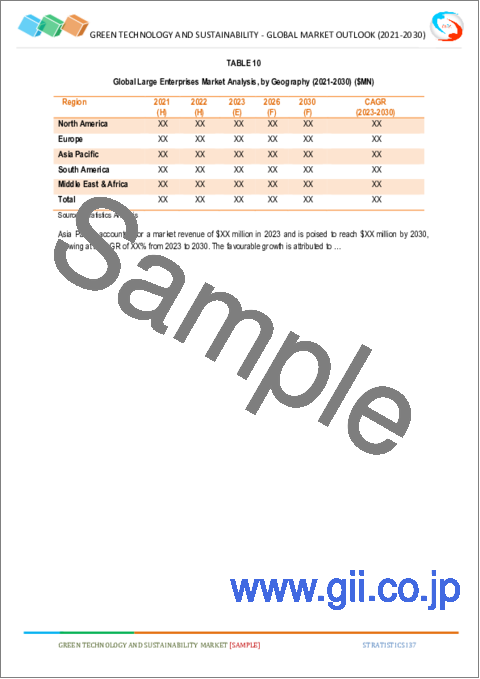
- Table 10 Global Green Technology and Sustainability Market Outlook, By Large Enterprises (2020-2028) ($MN)
- Table 11 Global Green Technology and Sustainability Market Outlook, By SMEs (2020-2028) ($MN)
- Table 12 Global Green Technology and Sustainability Market Outlook, By Other Organization Sizes (2020-2028) ($MN)
- Table 13 Global Green Technology and Sustainability Market Outlook, By Deployment Mode (2020-2028) ($MN)
- Table 14 Global Green Technology and Sustainability Market Outlook, By On Premises (2020-2028) ($MN)
- Table 15 Global Green Technology and Sustainability Market Outlook, By Cloud (2020-2028) ($MN)
- Table 16 Global Green Technology and Sustainability Market Outlook, By Other Deployment Modes (2020-2028) ($MN)
- Table 17 Global Green Technology and Sustainability Market Outlook, By Technology (2020-2028) ($MN)
- Table 18 Global Green Technology and Sustainability Market Outlook, By Blockchain (2020-2028) ($MN)
- Table 19 Global Green Technology and Sustainability Market Outlook, By Cyber Security (2020-2028) ($MN)
- Table 20 Global Green Technology and Sustainability Market Outlook, By Digital Twin (2020-2028) ($MN)
- Table 21 Global Green Technology and Sustainability Market Outlook, By Artificial Intelligence & Analytics (2020-2028) ($MN)
- Table 22 Global Green Technology and Sustainability Market Outlook, By Cloud Computing (2020-2028) ($MN)
- Table 23 Global Green Technology and Sustainability Market Outlook, By Internet Of Things (IoT) (2020-2028) ($MN)
- Table 24 Global Green Technology and Sustainability Market Outlook, By Edge Computing (2020-2028) ($MN)
- Table 25 Global Green Technology and Sustainability Market Outlook, By Other Technologies (2020-2028) ($MN)
- Table 26 Global Green Technology and Sustainability Market Outlook, By Application (2020-2028) ($MN)
- Table 27 Global Green Technology and Sustainability Market Outlook, By Fire Detection (2020-2028) ($MN)
- Table 28 Global Green Technology and Sustainability Market Outlook, By Sustainable Mining and Exploration (2020-2028) ($MN)
- Table 29 Global Green Technology and Sustainability Market Outlook, By Water Purification (2020-2028) ($MN)
- Table 30 Global Green Technology and Sustainability Market Outlook, By Soil Condition/Moisture Monitoring (2020-2028) ($MN)
- Table 31 Global Green Technology and Sustainability Market Outlook, By Crop Monitoring (2020-2028) ($MN)
- Table 32 Global Green Technology and Sustainability Market Outlook, By Forest Monitoring (2020-2028) ($MN)
- Table 33 Global Green Technology and Sustainability Market Outlook, By Air & Water Pollution Monitoring (2020-2028) ($MN)
- Table 34 Global Green Technology and Sustainability Market Outlook, By Weather Monitoring & Forecasting (2020-2028) ($MN)
- Table 35 Global Green Technology and Sustainability Market Outlook, By Carbon Footprint Management (2020-2028) ($MN)
- Table 36 Global Green Technology and Sustainability Market Outlook, By Green Building (2020-2028) ($MN)
- Table 37 Global Green Technology and Sustainability Market Outlook, By Water Leak Detection (2020-2028) ($MN)
- Table 38 Global Green Technology and Sustainability Market Outlook, By Water Management (2020-2028) ($MN)
- Table 39 Global Green Technology and Sustainability Market Outlook, By Other Applications (2020-2028) ($MN)
- Table 40 Global Green Technology and Sustainability Market Outlook, By End User (2020-2028) ($MN)
- Table 41 Global Green Technology and Sustainability Market Outlook, By Financial Services (2020-2028) ($MN)
- Table 42 Global Green Technology and Sustainability Market Outlook, By Public Sector (2020-2028) ($MN)
- Table 43 Global Green Technology and Sustainability Market Outlook, By Retail and Consumer Package Goods (2020-2028) ($MN)
- Table 44 Global Green Technology and Sustainability Market Outlook, By Chemicals (2020-2028) ($MN)
- Table 45 Global Green Technology and Sustainability Market Outlook, By Industrial Manufacturing (2020-2028) ($MN)
- Table 46 Global Green Technology and Sustainability Market Outlook, By Travel and Transportation (2020-2028) ($MN)
- Table 47 Global Green Technology and Sustainability Market Outlook, By Energy and Utilities (2020-2028) ($MN)
- Table 48 Global Green Technology and Sustainability Market Outlook, By Banking, Financial Services and Insurance (2020-2028) ($MN)
- Table 49 Global Green Technology and Sustainability Market Outlook, By Other End Users (2020-2028) ($MN)
Note: Tables for North America, Europe, APAC, South America, and Middle East & Africa Regions are also represented in the same manner as above.
According to Stratistics MRC, the Global Green Technology and Sustainability Market is accounted for $16.2 billion in 2022 and is expected to reach $64.3 billion by 2028 growing at a CAGR of 25.8% during the forecast period. Green technology, or sustainable technology, handles both the immediate and long-term effects of actions on the environment. Recycling, the use of renewable resources, health and safety concerns, energy efficiency, and other factors are instances of green technology. Technologies and systems classified as "greentech" utilize less energy and resources, rely on renewable resources, generate clean energy, and aid in minimizing and repairing environmental harm.
According to the World Economic Forum, the launch of Ethereum 2.0 and the transition from a proof of work (PoW) to a proof of stake (PoS) consensus model for blockchain is expected to consume 99.0% less energy. PoS requires lesser hardware than PoW, and the amount of energy needed to support safe transactions will decrease.
Market Dynamics:
Driver:
Rise in awareness and concern towards the environment
The world is experiencing new levels of growth because of globalization, which has also accelerated the speed of development in many developing nations, particularly India and China. There is constant environmental exploitation for the purposes of development and globalization. Individuals who care about the environment and ecology believe that if this rate of exploitation continues, the earth and its environment will not be suitable for a sustainable way of life anytime soon. This is where the term "green technology" comes into play, which makes use of technology in such a way that, on the one hand, globalization-related development is continued and, on the other hand, the level of adverse environmental impact is kept to a minimum.
Restraint:
High costs of green technologies and sustainability solutions
Environmental costs that are externalized in many traditional manufacturing processes are represented by green technologies and sustainability solutions, which are typically more expensive than the legacy technologies they are supposed to replace. Since green technology and sustainability are still developing, they are expected to have more development and training costs than well-established technologies. High initial implementation costs may prevent certain businesses from adopting green technologies and sustainable solutions, which could hinder the market from growing.
Opportunity:
Increasing use of green data centers
Green data center technology is primarily implemented in green cloud computing. Data management, storage, and operation are performed primarily by energy-efficient technologies in green data centers, frequently referred to as sustainable data centers. The 2020 U.S. Data Center Energy Use Report estimates that in 2020, data centers in the U.S. will employ 73 billion kWh. Furthermore, according to the European Commission, 259 TWh of electricity would be used by European data centers. However, due to this high energy consumption, green data centers will be adopted across all sectors, accelerating the expansion of the green technology and sustainability sectors.
Threat:
Lack of specialized solutions to environmental issues
New technological developments have traditionally been linked to a larger carbon footprint and other environmental issues. The largest environmental problems currently include climate change, biodiversity loss, poor water quality, and providing sufficient nutrition for a growing human population. Customized solutions or technologies that allow for the gathering and analysis of enormous amounts of data in order to provide fresh insights and make significant changes are required to meet these challenges. Globally, businesses are employing sensors and drones to gather data, which is then transformed into useful information via machine learning (ML) and analytics to improve the management of natural resources. There are, however, a few unique strategies to deal with environmental problems. For instance, companies and scientists are searching for solutions to address climate change challenges.
COVID-19 Impact:
The market for green technology and sustainability has grown significantly in the past few years, but it is anticipated to see a minor decline in 2020 as a result of the COVID-19 pandemic. This is due to the majority of governments placing their citizens on lockdown and stopping different ongoing solar and wind energy projects all around the world. Moreover, due to strict social distancing measures, even the installation of modest solar panels at residences and other industrial projects has been placed on hold. However, numerous green technology solution providers around the world are introducing new business plans and strategies in order to remain competitive and increase their market value.
The solutions segment is expected to be the largest during the forecast period
Due to the fact that green technology and sustainability solutions offer consumers real-time statistics, charting and monitoring tools, management services, and other services, the solutions category is anticipated to hold the largest share of the market over the extrapolated period. However, it consists of tools for monitoring the environment and utilizing renewable energy sources to help build a strong and dependable infrastructure and enhance a healthy ecosystem further augmenting the market growth.
The SMEs segment is expected to have the highest CAGR during the forecast period
Because these businesses are gradually adopting technological advancements to enhance their business operations, the SMEs segment is anticipated to record the highest CAGR throughout the projected period. Small companies are better positioned to implement the Internet of Things (IoT) and have simpler access to this technology, which will increase their profitability and sustainability. However, IoT solutions assist SMEs in better complying with the standards and requirements for green certification. SMEs can access new markets and financial resources by receiving the right subsidies and government assistance.
Region with largest share:
Due to the presence of significant companies like Microsoft Corporation, GE Electric, IBM Corporation, Oracle Corporation, Engie Impact, CropX Inc., and Taranis, North America is anticipated to hold the largest share of the global market throughout the projection period. Additionally, these players seek to increase their commercial presence across the globe by utilizing various corporate strategies like partnerships, mergers, and collaborations. Additionally, due to the region's extensive network of green technology and sustainability providers, it will grow at a rapid pace. As a result of the established economies in the region, green technology and sustainability vendors are able to invest in technological breakthroughs and innovations. The area is renowned as an innovation hub, with IT companies introducing new products and actively collaborating on green technology and sustainability solutions.
Region with highest CAGR:
During the forecast period, the market in Asia Pacific is anticipated to experience the highest CAGR. The main economic powers in the area are China, Japan, Taiwan, India, and South Korea. The development of low-carbon, renewable energy policies has also received different levels of support from the governments of these nations. They have invested resources in developing new markets for the development of renewable energy infrastructure, including solar and wind energy, smart grids, electric vehicles, and green buildings. The expansion of international markets and the region's success in exporting products utilizing clean technology are closely linked to these operations.
Key players in the market:
Some of the key players in Green Technology and Sustainability market include Wolters Kluwer N.V., General Electric, Salesforce, Inc., Microsoft, Schneider Electric, Engie Impact, Cority, Sensus, A Xylem Brand, LO3 Energy, CropX Inc., Enablon, Salesforce.com Inc and Intelex Technologies Inc.
Key Developments:
In May 2023, Microsoft has launched a new Payments app, which will allow small businesses to easily manage and collect payments from within Teams on their desktop or mobile device during a meeting. The app will be initially available for users in the US and Canada. Moreover, the company said that it has partnered with some of the largest players in the payments space to combine the core collaboration capabilities in Teams with powerful commerce features.
In April 2023, GE Power Conversion has been chosen by Keppel Shipyard for the design, supply and delivery of two electrical modules for Petrobras' Floating Production Storage Offloading vessels (FPSO), coded P-80 and P-83, which will be used for offshore energy production. The modules will be constructed in Asia for anticipated delivery during 2024 and 2025 to Singapore for topside integration, utilizing specialist support and expertise from both GE's Asia and Brazil teams.
In May 2022, Germany and India launched an Indo-German partnership for green and sustainable development. Germany pledged to give funds worth USD 11 billion in further phases to support green growth plans in India by 2030. This assistance was provided to India under the Joint Declaration of Intent (JDI) on green and sustainable development.
In February 2022, IBM Corporation introduced the IBM Sustainability Accelerator. It's a professional social impact program that uses IBM technologies such as AI, hybrid cloud, and an ecosystem of experts to help government and non-profit organizations improve and scale their operations, focusing on people who are vulnerable to environmental threats such as extreme weather & climate change and pollution.
In January 2022, Schneider Electric launched Infrastructure of the Future, an integrated suite of solutions for smart and green infrastructure. This integrated solution includes analytical insights, business continuity & operational services, green technology and sustainability solutions, e-mobility, and software for programs to accelerate the energy transition.
In March 2021, CropX Inc. partnered with NASA Harvest, a food security and agriculture program. The partnership helped advance sustainable agriculture and improved food security by using insights from CropX's satellite and soil data monitoring solutions to support and improve agricultural production.
Components Covered:
- Services
- Solution
- Other Components
Organization Sizes Covered:
- Large Enterprises
- SMEs
- Other Organization Sizes
Deployment Modes Covered:
- On Premises
- Cloud
- Other Deployment Modes
Technologies Covered:
- Blockchain
- Cyber Security
- Digital Twin
- Artificial Intelligence & Analytics
- Cloud Computing
- Internet Of Things (IoT)
- Edge Computing
- Other Technologies
Applications Covered:
- Fire Detection
- Sustainable Mining and Exploration
- Water Purification
- Soil Condition/Moisture Monitoring
- Crop Monitoring
- Forest Monitoring
- Air & Water Pollution Monitoring
- Weather Monitoring & Forecasting
- Carbon Footprint Management
- Green Building
- Water Leak Detection
- Water Management
- Other Applications
End Users Covered:
- Financial Services
- Public Sector
- Retail and Consumer Package Goods
- Chemicals
- Industrial Manufacturing
- Travel and Transportation
- Energy and Utilities
- Banking, Financial Services and Insurance
- Other End Users
Regions Covered:
- North America
- US
- Canada
- Mexico
- Europe
- Germany
- UK
- Italy
- France
- Spain
- Rest of Europe
- Asia Pacific
- Japan
- China
- India
- Australia
- New Zealand
- South Korea
- Rest of Asia Pacific
- South America
- Argentina
- Brazil
- Chile
- Rest of South America
- Middle East & Africa
- Saudi Arabia
- UAE
- Qatar
- South Africa
- Rest of Middle East & Africa
What our report offers:
- Market share assessments for the regional and country-level segments
- Strategic recommendations for the new entrants
- Covers Market data for the years 2020, 2021, 2022, 2025, and 2028
- Market Trends (Drivers, Constraints, Opportunities, Threats, Challenges, Investment Opportunities, and recommendations)
- Strategic recommendations in key business segments based on the market estimations
- Competitive landscaping mapping the key common trends
- Company profiling with detailed strategies, financials, and recent developments
- Supply chain trends mapping the latest technological advancements
Free Customization Offerings:
All the customers of this report will be entitled to receive one of the following free customization options:
- Company Profiling
- Comprehensive profiling of additional market players (up to 3)
- SWOT Analysis of key players (up to 3)
- Regional Segmentation
- Market estimations, Forecasts and CAGR of any prominent country as per the client's interest (Note: Depends on feasibility check)
- Competitive Benchmarking
- Benchmarking of key players based on product portfolio, geographical presence, and strategic alliances
Table of Contents
1 Executive Summary
2 Preface
- 2.1 Abstract
- 2.2 Stake Holders
- 2.3 Research Scope
- 2.4 Research Methodology
- 2.4.1 Data Mining
- 2.4.2 Data Analysis
- 2.4.3 Data Validation
- 2.4.4 Research Approach
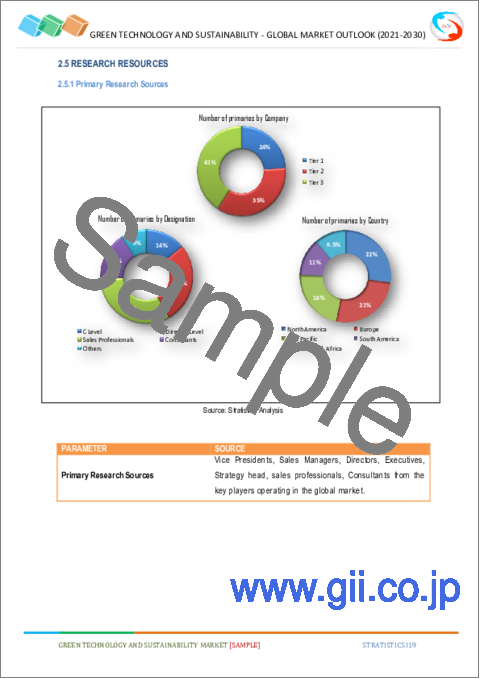
- 2.5 Research Sources
- 2.5.1 Primary Research Sources
- 2.5.2 Secondary Research Sources
- 2.5.3 Assumptions
3 Market Trend Analysis
- 3.1 Introduction
- 3.2 Drivers
- 3.3 Restraints
- 3.4 Opportunities
- 3.5 Threats
- 3.6 Technology Analysis
- 3.7 Application Analysis
- 3.8 End User Analysis
- 3.9 Emerging Markets
- 3.10 Impact of Covid-19
4 Porters Five Force Analysis
- 4.1 Bargaining power of suppliers
- 4.2 Bargaining power of buyers
- 4.3 Threat of substitutes
- 4.4 Threat of new entrants
- 4.5 Competitive rivalry
5 Global Green Technology and Sustainability Market, By Component
- 5.1 Introduction
- 5.2 Services
- 5.2.1 Integration and Deployment
- 5.2.2 Consulting
- 5.2.3 Support and Maintenance
- 5.3 Solution
- 5.4 Other Components
6 Global Green Technology and Sustainability Market, By Organization Size
- 6.1 Introduction
- 6.2 Large Enterprises
- 6.3 SMEs
- 6.4 Other Organization Sizes
7 Global Green Technology and Sustainability Market, By Deployment Mode
- 7.1 Introduction
- 7.2 On Premises
- 7.3 Cloud
- 7.4 Other Deployment Modes
8 Global Green Technology and Sustainability Market, By Technology
- 8.1 Introduction
- 8.2 Blockchain
- 8.3 Cyber Security
- 8.4 Digital Twin
- 8.5 Artificial Intelligence & Analytics
- 8.6 Cloud Computing
- 8.7 Internet Of Things (IoT)
- 8.8 Edge Computing
- 8.9 Other Technologies
9 Global Green Technology and Sustainability Market, By Application
- 9.1 Introduction
- 9.2 Fire Detection
- 9.3 Sustainable Mining and Exploration
- 9.4 Water Purification
- 9.5 Soil Condition/Moisture Monitoring
- 9.6 Crop Monitoring
- 9.7 Forest Monitoring
- 9.8 Air & Water Pollution Monitoring
- 9.9 Weather Monitoring & Forecasting
- 9.10 Carbon Footprint Management
- 9.11 Green Building
- 9.12 Water Leak Detection
- 9.13 Water Management
- 9.14 Other Applications
10 Global Green Technology and Sustainability Market, By End User
- 10.1 Introduction
- 10.2 Financial Services
- 10.3 Public Sector
- 10.4 Retail and Consumer Package Goods
- 10.5 Chemicals
- 10.6 Industrial Manufacturing
- 10.7 Travel and Transportation
- 10.8 Energy and Utilities
- 10.9 Banking, Financial Services and Insurance
- 10.10 Other End Users
11 Global Green Technology and Sustainability Market, By Geography
- 11.1 Introduction
- 11.2 North America
- 11.2.1 US
- 11.2.2 Canada
- 11.2.3 Mexico
- 11.3 Europe
- 11.3.1 Germany
- 11.3.2 UK
- 11.3.3 Italy
- 11.3.4 France
- 11.3.5 Spain
- 11.3.6 Rest of Europe
- 11.4 Asia Pacific
- 11.4.1 Japan
- 11.4.2 China
- 11.4.3 India
- 11.4.4 Australia
- 11.4.5 New Zealand
- 11.4.6 South Korea
- 11.4.7 Rest of Asia Pacific
- 11.5 South America
- 11.5.1 Argentina
- 11.5.2 Brazil
- 11.5.3 Chile
- 11.5.4 Rest of South America
- 11.6 Middle East & Africa
- 11.6.1 Saudi Arabia
- 11.6.2 UAE
- 11.6.3 Qatar
- 11.6.4 South Africa
- 11.6.5 Rest of Middle East & Africa
12 Key Developments
- 12.1 Agreements, Partnerships, Collaborations and Joint Ventures
- 12.2 Acquisitions & Mergers
- 12.3 New Product Launch
- 12.4 Expansions
- 12.5 Other Key Strategies
13 Company Profiling
- 13.1 Wolters Kluwer N.V.
- 13.2 General Electric
- 13.3 Salesforce, Inc.
- 13.4 Microsoft
- 13.5 Schneider Electric
- 13.6 Engie Impact
- 13.7 Cority
- 13.8 Sensus, A Xylem Brand
- 13.9 LO3 Energy
- 13.10 CropX Inc.
- 13.11 Enablon
- 13.12 Salesforce.com Inc
- 13.13 Intelex Technologies Inc.