|
|
市場調査レポート
商品コード
1209883
電圧/VAR管理の世界市場:2028年までの予測 - コンポーネント(ソフトウェア&サービス、ハードウェア)、アプリケーション(送電、発電、配電)、エンドユーザー(産業、電気事業者)、地域別の分析Volt/VAR Management Market Forecasts to 2028 - Global Analysis By Component (Software & Services and Hardware), Application (Transmission, Generation and Distribution), End User (Industrial and Electric Utility) and Geography |
||||||
|
|
|||||||
|
● お客様のご希望に応じて、既存データの加工や未掲載情報(例:国別セグメント)の追加などの対応が可能です。 詳細はお問い合わせください。 |
|||||||


| 電圧/VAR管理の世界市場:2028年までの予測 - コンポーネント(ソフトウェア&サービス、ハードウェア)、アプリケーション(送電、発電、配電)、エンドユーザー(産業、電気事業者)、地域別の分析 |
|
出版日: 2023年01月01日
発行: Stratistics Market Research Consulting
ページ情報: 英文 175+ Pages
納期: 2~3営業日
|
- 全表示
- 概要
- 図表
- 目次
Stratistics MRCによると、世界のVolt/VAR Management市場は2022年に5億3640万米ドルを占め、2028年には8億4649万米ドルに達し、予測期間中に7.9%のCAGRで成長すると予測されています。
電圧/VAR管理は、無効電力の流れを減らし、電圧を制限内に維持し、さらに電圧を下げることでピーク電力を制限することでエネルギー損失を低減します。近代化されたグリッドオートメーションの第一歩は、中電圧と低電圧のグリッドの障害認識です。これにより、電圧制御が改善され、ネットワークのホスティング能力が向上します。
IEA(国際エネルギー機関)によると、2018年の世界のエネルギー需要は4%(900TWH)増加しました。2016年の8699TWHに対して、2017年は約8945TWHの産業セグメントが最も多くのエネルギーを消費しました。
市場力学
促進要因
電気部門における効率的な配電とエネルギー管理に対する需要の高まり
電圧/VAR管理の市場は、電力需要の上昇によって牽引されています。電気業界が効率的な分散型エネルギー管理を必要としているため、メーカーは技術革新のハードルを上げています。2019年、シュナイダーエレクトリックのアーキテクチャツール「EcoStruxure Power」がリリースされました。このソリューションは、電気業界のマイクログリッドの安定性、効率性、耐障害性を高めることを目的としています。シュナイダー社の製品の登場は、市場全体の非価格競争を高め、他の多くのメーカーに新製品の開発にコミットするよう促しました。
抑制要因
高い設置コスト
VVOのコストやメリットは、導入するシステムの種類によって異なります。電圧制御やVAR管理のための機器やシステムの設置には、追加の設備投資と運用・保守コストが必要。燃料費と化石燃料による発電の減少による排出量を削減するため、影響を受けるフィーダーの実電力容量を増やし、発電、送電、配電の資本増強プロジェクトを延期し、燃料価格を下げます。
機会
電力の負荷フローへの注目度が高まっている
大規模な産業用・商業用機器には、ネットワークの接続性解析とスイッチングスケジュールが必要です。その結果、産業界のリーダーは電圧/VAR管理システムを導入する必要があります。G20が高度に調整された電気産業の発展に取り組む中で、電圧管理はさまざまな分野で必要とされてきました。したがって、電気ネットワークと電圧監視のための活況を呈する産業が存在するというのは、決して間違った認識ではありません。
脅威
限られた容量
Volt-VARは、発電量を抑制する必要がないため、多くの関心を集めています。しかし、家庭用太陽光発電インバータは、パネルの最大有効発電量(kW)に対応したサイズ(kVA)であるため、吸収できる容量に限界があります。しかし、家庭用太陽光発電インバータは、パネルの最大有効電力(kW)に対応するサイズ(kVA)であり、有効電力が優先されるため、発電量が多いときに無効電力(kVAR)を吸収する能力には限界があります。様々なVolt-VARカーブやPVの普及率を考慮すると、無効電力が最も必要な時にVolt-VAR制御が失敗することが分析されています。また、無効電力は電流を増加させ、その結果、資産の利用率も増加させる。
COVID-19の影響
パンデミックは、すべての電気・電子事業に深刻な打撃を与えました。特に新興国での経済拡大には電力が必要。SDG7(持続可能な開発目標の達成)の達成は、持続可能な都市、産業、持続可能な健康、教育など、他の多くのSDGsの達成に必要であり、そのためには、信頼できる、安価で持続可能な、近代的エネルギーへのアクセスを誰もが確保できるようにすることが必要です。
予測期間中、配電部門が最大となる見込み
スマートグリッドの導入が進み、配電フィーダーでの停電や故障を減らす必要があることから、電圧/VAR管理市場の配電部門は予測期間中、世界市場を独占すると予測されます。さらに、住宅分野での電力需要の増加が、同分野の市場を促進する可能性があります。
予測期間中、電力会社向けサービスのCAGRが最も高くなると予想されます。
このサービスは、電力会社が最終消費者に適切な電圧を理想的な力率で供給し、損失を最小限に抑えるのに役立つため、予測期間中、電圧/VAR管理市場で最も高い成長率を占めたのは電力会社セグメントでした。また、中国、インド、米国などの経済圏では、予測期間中に電力需要が大幅に増加すると予想され、電圧/VAR管理のニーズが高まると予測されます。
最もシェアの高い地域
送電・配電プロセスで使用される部品の技術的進歩により、北米は世界のVolt/VARマネジメント市場の予測期間中に最大の市場シェアを占めると予測されます。さらに、この地域の需要は、幅広いアプリケーション、電気自動車の製造、エネルギーコストの削減という差し迫ったニーズによって影響を受ける可能性があります。
CAGRが最も高い地域
再生可能エネルギー事業者からの投資や、インドや中国などの新興経済諸国におけるエネルギー価格の上昇を抑える必要性から、アジア太平洋地域は予測期間中に大きな成長を遂げると予想されています。その他の特典として、再生可能エネルギーの新規プロジェクトにおいて、発電した電力を管理するためのVolt/VARシステムをさまざまな場所に設置することが、この地域の市場に利益をもたらすと考えられています。
主な発展
2019年6月、ABBは中国国家電網公司(SGCC)から送電契約を受注しました。同社は、破壊的な故障から送電網を保護するブレーカーやエネルギー供給の質を向上させるコンデンサーバンクなどの高圧機器を使用し、製品寿命の延長と損失の低減を図る予定です。
2019年2月、シュナイダーエレクトリックは「Ecostruxure Power 2.0」を発表しました。EcoStruxure Microgrid Operationは、最新のEcoStruxure Powerアーキテクチャで使用され、分散型エネルギー資源(DER)と保護システムを制御してマイクログリッドの安定性と効率を高め、Volt/VAR管理市場を拡大します。
本レポートの内容
- 地域および国レベルセグメントの市場シェア評価
- 新規参入企業への戦略的提言
- 2020年、2021年、2022年、2025年、2028年の市場データを網羅
- 市場動向(市場促進要因・促進要因・機会・脅威・課題・投資機会・提言)を網羅
- 市場推定に基づく、主要ビジネスセグメントにおける戦略的推奨事項
- 主要な共通トレンドをマッピングした競合情勢
- 詳細な戦略、財務、最近の開発状況を含む企業プロファイル
- 最新の技術的進歩をマッピングしたサプライチェーン動向
無料カスタマイズサービス
本レポートをご購読のお客様には、以下のカスタマイズオプションのいずれかを無償でご提供いたします。
- 企業プロファイル
- 追加市場プレイヤーの包括的なプロファイリング(最大3社まで)
- 主要プレイヤーのSWOT分析(3社まで)
- 地域別セグメンテーション
- お客様のご希望に応じた主要国の市場推計・予測・CAGR(注:フィージビリティチェックによります。)
- 競合ベンチマーキング
製品ポートフォリオ、地理的プレゼンス、戦略的提携に基づく主要プレイヤーのベンチマーキング
目次
第1章 エグゼクティブサマリー
第2章 序文
- 概要
- ステークホルダー
- 調査範囲
- 調査手法
- データマイニング
- データ分析
- データ検証
- 調査アプローチ
- 調査情報源
- 1次調査情報源
- 2次調査情報源
- 仮定
第3章 市場動向分析
- 促進要因
- 抑制要因
- 機会
- 脅威
- アプリケーション分析
- エンドユーザー分析
- 新興市場
- COVID-19の影響
第4章 ポーターズファイブフォース分析
- 供給企業の交渉力
- 買い手の交渉力
- 代替品の脅威
- 新規参入業者の脅威
- 競争企業間の敵対関係
第5章 世界のボルト/VAR管理市場:コンポーネント別
- ソフトウェアとサービス
- ハードウェア
- ロードタップチェンジャー(LTC)変圧器
- コンデンサバンク
- 電圧レギュレータ
- スマートセンサー
第6章 世界のボルト/VAR管理市場:アプリケーション別
- 伝染; 感染
- 世代
- 分布
第7章 世界のボルト/VAR管理市場:エンドユーザー別
- 工業用
- 電気事業
第8章 世界のボルト/地域管理市場:地域別
- 北米
- 米国
- カナダ
- メキシコ
- 欧州
- ドイツ
- 英国
- イタリア
- フランス
- スペイン
- その他欧州
- アジア太平洋地域
- 日本
- 中国
- インド
- オーストラリア
- ニュージーランド
- 韓国
- その他アジア太平洋地域
- 南米
- アルゼンチン
- ブラジル
- チリ
- その他南米
- 中東とアフリカ
- サウジアラビア
- アラブ首長国連邦
- カタール
- 南アフリカ
- その他中東
第9章 主な発展
- 契約、パートナーシップ、コラボレーション、合弁事業
- 買収と合併
- 新製品の発売
- 事業拡大
- その他の主要戦略
第10章 企業プロファイル
- Open Systems International
- ABB
- GE Company
- Schneider
- S&C Electric Company
- Advanced Control System
- Eaton
- Siemens
- Utilidata
- DVI
- Landis+Gyr
- Beckwith Electric
- VArentec
- DC System
List of Tables
- Table 1 Global Volt/VAR Management Market Outlook, By Region (2020-2028) ($MN)
- Table 2 Global Volt/VAR Management Market Outlook, By Component (2020-2028) ($MN)
- Table 3 Global Volt/VAR Management Market Outlook, By Software & Services (2020-2028) ($MN)
- Table 4 Global Volt/VAR Management Market Outlook, By Hardware (2020-2028) ($MN)
- Table 5 Global Volt/VAR Management Market Outlook, By Load Tap Changer (LTC) Tranformers (2020-2028) ($MN)
- Table 6 Global Volt/VAR Management Market Outlook, By Capacitor Banks (2020-2028) ($MN)
- Table 7 Global Volt/VAR Management Market Outlook, By Voltage Regulators (2020-2028) ($MN)
- Table 8 Global Volt/VAR Management Market Outlook, By Smart Sensors (2020-2028) ($MN)
- Table 9 Global Volt/VAR Management Market Outlook, By Application (2020-2028) ($MN)
- Table 10 Global Volt/VAR Management Market Outlook, By Transmission (2020-2028) ($MN)
- Table 11 Global Volt/VAR Management Market Outlook, By Generation (2020-2028) ($MN)
- Table 12 Global Volt/VAR Management Market Outlook, By Distribution (2020-2028) ($MN)
- Table 13 Global Volt/VAR Management Market Outlook, By End User (2020-2028) ($MN)
- Table 14 Global Volt/VAR Management Market Outlook, By Industrial (2020-2028) ($MN)
- Table 15 Global Volt/VAR Management Market Outlook, By Electric Utility (2020-2028) ($MN)
- Table 16 North America Volt/VAR Management Market Outlook, By Country (2020-2028) ($MN)
- Table 17 North America Volt/VAR Management Market Outlook, By Component (2020-2028) ($MN)
- Table 18 North America Volt/VAR Management Market Outlook, By Software & Services (2020-2028) ($MN)
- Table 19 North America Volt/VAR Management Market Outlook, By Hardware (2020-2028) ($MN)
- Table 20 North America Volt/VAR Management Market Outlook, By Load Tap Changer (LTC) Tranformers (2020-2028) ($MN)
- Table 21 North America Volt/VAR Management Market Outlook, By Capacitor Banks (2020-2028) ($MN)
- Table 22 North America Volt/VAR Management Market Outlook, By Voltage Regulators (2020-2028) ($MN)
- Table 23 North America Volt/VAR Management Market Outlook, By Smart Sensors (2020-2028) ($MN)
- Table 24 North America Volt/VAR Management Market Outlook, By Application (2020-2028) ($MN)
- Table 25 North America Volt/VAR Management Market Outlook, By Transmission (2020-2028) ($MN)
- Table 26 North America Volt/VAR Management Market Outlook, By Generation (2020-2028) ($MN)
- Table 27 North America Volt/VAR Management Market Outlook, By Distribution (2020-2028) ($MN)
- Table 28 North America Volt/VAR Management Market Outlook, By End User (2020-2028) ($MN)
- Table 29 North America Volt/VAR Management Market Outlook, By Industrial (2020-2028) ($MN)
- Table 30 North America Volt/VAR Management Market Outlook, By Electric Utility (2020-2028) ($MN)
- Table 31 Europe Volt/VAR Management Market Outlook, By Country (2020-2028) ($MN)
- Table 32 Europe Volt/VAR Management Market Outlook, By Component (2020-2028) ($MN)
- Table 33 Europe Volt/VAR Management Market Outlook, By Software & Services (2020-2028) ($MN)
- Table 34 Europe Volt/VAR Management Market Outlook, By Hardware (2020-2028) ($MN)
- Table 35 Europe Volt/VAR Management Market Outlook, By Load Tap Changer (LTC) Tranformers (2020-2028) ($MN)
- Table 36 Europe Volt/VAR Management Market Outlook, By Capacitor Banks (2020-2028) ($MN)
- Table 37 Europe Volt/VAR Management Market Outlook, By Voltage Regulators (2020-2028) ($MN)
- Table 38 Europe Volt/VAR Management Market Outlook, By Smart Sensors (2020-2028) ($MN)
- Table 39 Europe Volt/VAR Management Market Outlook, By Application (2020-2028) ($MN)
- Table 40 Europe Volt/VAR Management Market Outlook, By Transmission (2020-2028) ($MN)
- Table 41 Europe Volt/VAR Management Market Outlook, By Generation (2020-2028) ($MN)
- Table 42 Europe Volt/VAR Management Market Outlook, By Distribution (2020-2028) ($MN)
- Table 43 Europe Volt/VAR Management Market Outlook, By End User (2020-2028) ($MN)
- Table 44 Europe Volt/VAR Management Market Outlook, By Industrial (2020-2028) ($MN)
- Table 45 Europe Volt/VAR Management Market Outlook, By Electric Utility (2020-2028) ($MN)
- Table 46 Asia Pacific Volt/VAR Management Market Outlook, By Country (2020-2028) ($MN)
- Table 47 Asia Pacific Volt/VAR Management Market Outlook, By Component (2020-2028) ($MN)
- Table 48 Asia Pacific Volt/VAR Management Market Outlook, By Software & Services (2020-2028) ($MN)
- Table 49 Asia Pacific Volt/VAR Management Market Outlook, By Hardware (2020-2028) ($MN)
- Table 50 Asia Pacific Volt/VAR Management Market Outlook, By Load Tap Changer (LTC) Tranformers (2020-2028) ($MN)
- Table 51 Asia Pacific Volt/VAR Management Market Outlook, By Capacitor Banks (2020-2028) ($MN)
- Table 52 Asia Pacific Volt/VAR Management Market Outlook, By Voltage Regulators (2020-2028) ($MN)
- Table 53 Asia Pacific Volt/VAR Management Market Outlook, By Smart Sensors (2020-2028) ($MN)
- Table 54 Asia Pacific Volt/VAR Management Market Outlook, By Application (2020-2028) ($MN)
- Table 55 Asia Pacific Volt/VAR Management Market Outlook, By Transmission (2020-2028) ($MN)
- Table 56 Asia Pacific Volt/VAR Management Market Outlook, By Generation (2020-2028) ($MN)
- Table 57 Asia Pacific Volt/VAR Management Market Outlook, By Distribution (2020-2028) ($MN)
- Table 58 Asia Pacific Volt/VAR Management Market Outlook, By End User (2020-2028) ($MN)
- Table 59 Asia Pacific Volt/VAR Management Market Outlook, By Industrial (2020-2028) ($MN)
- Table 60 Asia Pacific Volt/VAR Management Market Outlook, By Electric Utility (2020-2028) ($MN)
- Table 61 South America Volt/VAR Management Market Outlook, By Country (2020-2028) ($MN)
- Table 62 South America Volt/VAR Management Market Outlook, By Component (2020-2028) ($MN)
- Table 63 South America Volt/VAR Management Market Outlook, By Software & Services (2020-2028) ($MN)
- Table 64 South America Volt/VAR Management Market Outlook, By Hardware (2020-2028) ($MN)
- Table 65 South America Volt/VAR Management Market Outlook, By Load Tap Changer (LTC) Tranformers (2020-2028) ($MN)
- Table 66 South America Volt/VAR Management Market Outlook, By Capacitor Banks (2020-2028) ($MN)
- Table 67 South America Volt/VAR Management Market Outlook, By Voltage Regulators (2020-2028) ($MN)
- Table 68 South America Volt/VAR Management Market Outlook, By Smart Sensors (2020-2028) ($MN)
- Table 69 South America Volt/VAR Management Market Outlook, By Application (2020-2028) ($MN)
- Table 70 South America Volt/VAR Management Market Outlook, By Transmission (2020-2028) ($MN)
- Table 71 South America Volt/VAR Management Market Outlook, By Generation (2020-2028) ($MN)
- Table 72 South America Volt/VAR Management Market Outlook, By Distribution (2020-2028) ($MN)
- Table 73 South America Volt/VAR Management Market Outlook, By End User (2020-2028) ($MN)
- Table 74 South America Volt/VAR Management Market Outlook, By Industrial (2020-2028) ($MN)
- Table 75 South America Volt/VAR Management Market Outlook, By Electric Utility (2020-2028) ($MN)
- Table 76 Middle East & Africa Volt/VAR Management Market Outlook, By Country (2020-2028) ($MN)
- Table 77 Middle East & Africa Volt/VAR Management Market Outlook, By Component (2020-2028) ($MN)
- Table 78 Middle East & Africa Volt/VAR Management Market Outlook, By Software & Services (2020-2028) ($MN)
- Table 79 Middle East & Africa Volt/VAR Management Market Outlook, By Hardware (2020-2028) ($MN)
- Table 80 Middle East & Africa Volt/VAR Management Market Outlook, By Load Tap Changer (LTC) Tranformers (2020-2028) ($MN)
- Table 81 Middle East & Africa Volt/VAR Management Market Outlook, By Capacitor Banks (2020-2028) ($MN)
- Table 82 Middle East & Africa Volt/VAR Management Market Outlook, By Voltage Regulators (2020-2028) ($MN)
- Table 83 Middle East & Africa Volt/VAR Management Market Outlook, By Smart Sensors (2020-2028) ($MN)
- Table 84 Middle East & Africa Volt/VAR Management Market Outlook, By Application (2020-2028) ($MN)
- Table 85 Middle East & Africa Volt/VAR Management Market Outlook, By Transmission (2020-2028) ($MN)
- Table 86 Middle East & Africa Volt/VAR Management Market Outlook, By Generation (2020-2028) ($MN)
- Table 87 Middle East & Africa Volt/VAR Management Market Outlook, By Distribution (2020-2028) ($MN)
- Table 88 Middle East & Africa Volt/VAR Management Market Outlook, By End User (2020-2028) ($MN)
- Table 89 Middle East & Africa Volt/VAR Management Market Outlook, By Industrial (2020-2028) ($MN)
- Table 90 Middle East & Africa Volt/VAR Management Market Outlook, By Electric Utility (2020-2028) ($MN)
According to Stratistics MRC, the Global Volt/VAR Management Market is accounted for $536.40 million in 2022 and is expected to reach $846.49 million by 2028 growing at a CAGR of 7.9% during the forecast period. Volt/VAR management lowers energy loss by reducing reactive power flows, maintaining voltages within the limits, and also limiting peak power by lowering voltage. The first step towards modernised grid automation is fault awareness of the medium voltage and low voltage grid. It improves voltage control and increases network hosting capacity.
According to IEA (International Energy Agency), the worldwide energy demand grew by 4% (900 TWH) in 2018. The highest amount of energy was consumed by industrial segment of around 8945 TWH in 2017 as compared to 8699 TWH in 2016.
Market Dynamics:
Driver:
Rising demand for efficient distribution and energy management in the electrical sector
The market for volt/VAR management is being driven by rising power demand. Manufacturers have raised the bar for innovation as a result of the electrical industry's need for efficient distributed energy management. In 2019, EcoStruxure Power, an architecture tool from Schneider Electric, was released. The solution is intended to increase the stability, efficiency, and resilience of electric industry micro grids. The emergence of Schneider's product heightened non-price competition throughout the market, inspiring many other manufacturers to commit to developing new products.
Restraint:
High installation costs
Depending on the procedure type, VVO costs and benefits vary. The installation of equipment and systems for voltage control and VAR management requires additional capital investments as well as operating and maintenance costs. To reduce fuel costs and emissions from reduced fossil-fired generating, increase the real-power capacity of impacted feeders, postpone capital enhancement projects for generation, transmission, and distribution, and lower fuel prices.
Opportunity:
Increasing focus on load flow of electricity
Network connectivity analyses and switching schedules are necessary for large industrial and commercial units. Volt/VAR management systems must be implemented by industrial leaders as a result of this. Voltage management has been required in a Variety of sectors as the G20 works to develop a highly coordinated electrical industry. Therefore, the existence of a booming industry for electrical network and voltage monitoring is not a misconception.
Threat:
Limited capacity
Volt-VAR has attained a lot of interest because it does not require generation curtailment. However, household-scale PV inverters are sized (kVA) to handle the panels' maximum active power generation (kW). They have a limited capacity to absorb reactive power (kVAR) during times of high generation because active power generation is typically given priority. Analysis shows that Volt-VAR control fails when reactive power is most needed when taking into account Various Volt-VAR curves and PV penetrations. Reactive power also raises currents and, consequently, asset utilisation.
COVID-19 Impact:
The pandemic severely harmed all electrical and electronics businesses. Power is necessary for economic expansion, especially in emerging markets. Achieving SDG 7 (Achieving Sustainable Development Goals), which aims to ensure that everyone has access to reliable, affordable, sustainable, and modern energy, is necessary for the accomplishment of many other SDGs, including those pertaining to sustainable cities, industry, sustainable health, and education.
The distribution segment is expected to be the largest during the forecast period
Due to the increased deployment of smart grids and the need to reduce power outages and faults in distribution feeders, the distribution segment of the volt/VAR management market is anticipated to dominate the worldwide market during the forecast period. Furthermore, increase in demand of electricity from residential sector might propel the market in this segment.
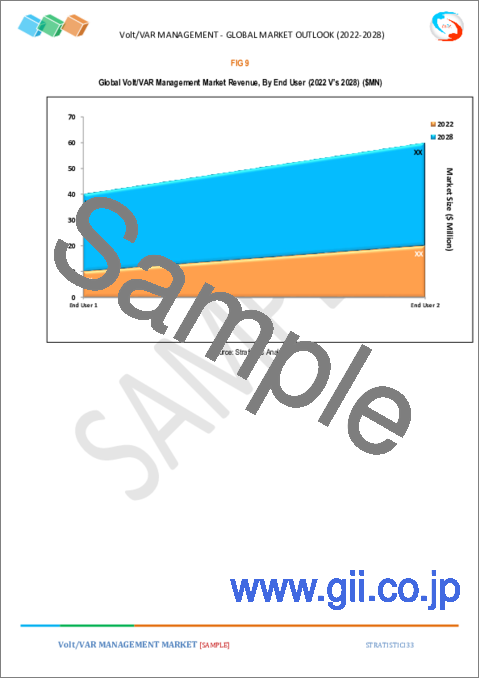
The electric utility segment is expected to have the highest CAGR during the forecast period
Because the service helps utilities supply the proper voltage to end-consumers at the ideal power factor to minimise losses, the electric utility segment accounted for the highest growth rate during the forecast period in the Volt/VAR management market. Additionally, in economies like China, India, and the US, the demand for power is anticipated to rise significantly over the forecast period, which is anticipated to increase the need for volt/VAR management.
Region with largest share:
Due to technological advancements of components used in the transmission and distribution process, North America is predicted to hold the largest market share during the period of the forecast for the global Volt/VAR management market. Furthermore, the regional demand may be influenced by a wide range of applications, the manufacture of electric vehicles, and the pressing need to reduce energy costs.
Region with highest CAGR:
Because of significant market demand brought on by investments from renewable energy providers and the need to contain rising energy prices in developing economies like India and China, Asia Pacific is anticipated to grow lucratively during the forecast period. Additionally, in the event of new renewable energy projects, installing Volt/VAR systems in various locations for managing power generated will benefit the market in this region.
Key players in the market
Some of the key players in Volt/VAR Management market include Open Systems International, ABB, GE Company, Schneider, S&C Electric Company, Advanced Control System, Eaton, Siemens, Utilidata, DVI, Landis+Gyr, Beckwith Electric, VArentec and DC System.
Key Developments:
In June 2019, ABB was awarded a power transmission contract by the State Grid Corporation of China (SGCC). The company plans to use high-voltage equipment such as breakers to safeguard the grid from disruptive failures and capacitor banks to improve the quality of the energy supply, extending product life and lowering losses.
In February 2019, Schneider Electric released the Ecostruxure Power 2.0. EcoStruxure Microgrid Operation is used in the latest EcoStruxure Power architecture to control Distributed Energy Resources (DER) and protection systems for better microgrid stability and efficiency increasing the Volt/VAR Management Market.
Components Covered:
- Software & Services
- Hardware
Applications Covered:
- Transmission
- Generation
- Distribution
End Users Covered:
- Industrial
- Electric Utility
Regions Covered:
- North America
- US
- Canada
- Mexico
- Europe
- Germany
- UK
- Italy
- France
- Spain
- Rest of Europe
- Asia Pacific
- Japan
- China
- India
- Australia
- New Zealand
- South Korea
- Rest of Asia Pacific
- South America
- Argentina
- Brazil
- Chile
- Rest of South America
- Middle East & Africa
- Saudi Arabia
- UAE
- Qatar
- South Africa
- Rest of Middle East & Africa
What our report offers:
- Market share assessments for the regional and country-level segments
- Strategic recommendations for the new entrants
- Covers Market data for the years 2020, 2021, 2022, 2025, and 2028
- Market Trends (Drivers, Constraints, Opportunities, Threats, Challenges, Investment Opportunities, and recommendations)
- Strategic recommendations in key business segments based on the market estimations
- Competitive landscaping mapping the key common trends
- Company profiling with detailed strategies, financials, and recent developments
- Supply chain trends mapping the latest technological advancements
Free Customization Offerings:
All the customers of this report will be entitled to receive one of the following free customization options:
- Company Profiling
- Comprehensive profiling of additional market players (up to 3)
- SWOT Analysis of key players (up to 3)
- Regional Segmentation
- Market estimations, Forecasts and CAGR of any prominent country as per the client's interest (Note: Depends on feasibility check)
- Competitive Benchmarking
Benchmarking of key players based on product portfolio, geographical presence, and strategic alliances
Table of Contents
1 Executive Summary
2 Preface
- 2.1 Abstract
- 2.2 Stake Holders
- 2.3 Research Scope
- 2.4 Research Methodology
- 2.4.1 Data Mining
- 2.4.2 Data Analysis
- 2.4.3 Data Validation
- 2.4.4 Research Approach
- 2.5 Research Sources
- 2.5.1 Primary Research Sources
- 2.5.2 Secondary Research Sources
- 2.5.3 Assumptions
3 Market Trend Analysis
- 3.1 Introduction
- 3.2 Drivers
- 3.3 Restraints
- 3.4 Opportunities
- 3.5 Threats
- 3.6 Application Analysis
- 3.7 End User Analysis
- 3.8 Emerging Markets
- 3.9 Impact of Covid-19
4 Porters Five Force Analysis
- 4.1 Bargaining power of suppliers
- 4.2 Bargaining power of buyers
- 4.3 Threat of substitutes
- 4.4 Threat of new entrants
- 4.5 Competitive rivalry
5 Global Volt/VAR Management Market, By Component
- 5.1 Introduction
- 5.2 Software & Services
- 5.3 Hardware
- 5.3.1 Load Tap Changer (LTC) Tranformers
- 5.3.2 Capacitor Banks
- 5.3.3 Voltage Regulators
- 5.3.4 Smart Sensors
6 Global Volt/VAR Management Market, By Application
- 6.1 Introduction
- 6.2 Transmission
- 6.3 Generation
- 6.4 Distribution
7 Global Volt/VAR Management Market, By End User
- 7.1 Introduction
- 7.2 Industrial
- 7.3 Electric Utility
8 Global Volt/VAR Management Market, By Geography
- 8.1 Introduction
- 8.2 North America
- 8.2.1 US
- 8.2.2 Canada
- 8.2.3 Mexico
- 8.3 Europe
- 8.3.1 Germany
- 8.3.2 UK
- 8.3.3 Italy
- 8.3.4 France
- 8.3.5 Spain
- 8.3.6 Rest of Europe
- 8.4 Asia Pacific
- 8.4.1 Japan
- 8.4.2 China
- 8.4.3 India
- 8.4.4 Australia
- 8.4.5 New Zealand
- 8.4.6 South Korea
- 8.4.7 Rest of Asia Pacific
- 8.5 South America
- 8.5.1 Argentina
- 8.5.2 Brazil
- 8.5.3 Chile
- 8.5.4 Rest of South America
- 8.6 Middle East & Africa
- 8.6.1 Saudi Arabia
- 8.6.2 UAE
- 8.6.3 Qatar
- 8.6.4 South Africa
- 8.6.5 Rest of Middle East & Africa
9 Key Developments
- 9.1 Agreements, Partnerships, Collaborations and Joint Ventures
- 9.2 Acquisitions & Mergers
- 9.3 New Product Launch
- 9.4 Expansions
- 9.5 Other Key Strategies
10 Company Profiling
- 10.1 Open Systems International
- 10.2 ABB
- 10.3 GE Company
- 10.4 Schneider
- 10.5 S&C Electric Company
- 10.6 Advanced Control System
- 10.7 Eaton
- 10.8 Siemens
- 10.9 Utilidata
- 10.10 DVI
- 10.11 Landis+Gyr
- 10.12 Beckwith Electric
- 10.13 VArentec
- 10.14 DC System