|
|
市場調査レポート
商品コード
1597046
抗体薬物複合体市場:適応疾患別、治療領域別、リンカー別、ペイロード別、標的抗原別、主要地域別:2035年までの業界動向と世界の予測Antibody Drug Conjugate Market by Target Disease Indication,Therapeutic Area, Linker, Payload, Target Antigens And Key Geographical Regions: Industry Trends and Global Forecasts, Till 2035 |
||||||
|
|||||||
カスタマイズ可能
|
|||||||

| 抗体薬物複合体市場:適応疾患別、治療領域別、リンカー別、ペイロード別、標的抗原別、主要地域別:2035年までの業界動向と世界の予測 |
|
出版日: 2024年11月15日
発行: Roots Analysis
ページ情報: 英文 716 Pages
納期: 即日から翌営業日
|

全表示
- 概要
- 図表
- 目次
世界の抗体薬物複合体の市場規模は、2035年までの予測期間中に9.63%のCAGRで拡大し、現在の77億2,000万米ドルから2035年までに233億米ドルに成長すると予測されています。
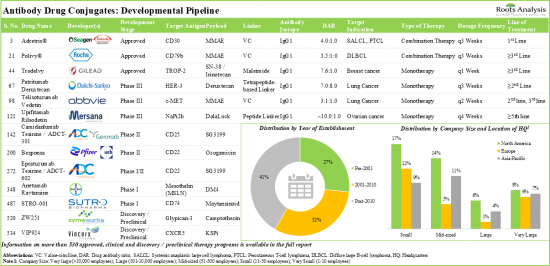
長年にわたり、薬物動態学的および薬力学的特性の向上や抗体工学などのさまざまな技術開発により、抗体薬物複合体が固形がんや血液悪性腫瘍の治療において実行可能な治療手段と見なされる道が開かれました。現在までに280以上の抗体薬物複合体が承認され、あるいは臨床試験中であり、250以上の候補が開発の初期段階にあります。米国食品医薬品局(USFDA)が承認した薬剤の例としては、ジンロンタ、アカラックス、エイジキシなどがあります。
抗体薬物複合体は、最小限の副作用で腫瘍集団を選択的に除去する可能性のある選択肢として浮上してきました。現在までにいくつかの臨床試験で、抗体薬物複合体の治療上の優位性(従来のがん治療の選択肢を上回る)と有効性が示されています。そのため、さまざまながん疾患の患者数の増加は、抗体薬物複合体市場の主要な促進要因の1つとなっています。革新的な技術プラットフォームの利用可能性、有利な資金調達の機会、有望な臨床試験結果などに後押しされ、今後10年間で複数の製品候補が販売承認を取得すると予想されることから、抗体薬物複合体市場は長期的に成長する見通しです。
当レポートでは、世界の抗体薬物複合体市場について調査し、市場の概要とともに、適応疾患別、治療領域別、リンカー別、ペイロード別、標的抗原別、地域別の動向、および市場に参入する企業のプロファイルなどを提供しています。
目次
第1章 序文
第2章 エグゼクティブサマリー
第3章 イントロダクション
第4章 市場概要
第5章 ターゲット競争力分析
第6章 企業と薬剤プロファイル
- 章の概要
- ADC Therapeutics
- Astellas Pharma
- AstraZeneca
- Byondis
- Daiichi Sankyo
- Genentech
- Gilead Sciences
- ImmunoGen
- Pfizer
- RemeGen
- Seagen
第7章 臨床試験の分析
第8章 主要なオピニオンリーダー
第9章 併用療法
第10章 パートナーシップとコラボレーション
第11章 資金調達と投資分析
第12章 特許分析
第13章 学術助成金の分析
第14章 主要な商業化戦略
第15章 プロモーション分析
第16章 成功プロトコル分析
第17章 新しい結合とリンカー技術プラットフォーム
第18章 ヒトへの投与における非臨床データの評価
第19章 原価分析
第20章 ケーススタディ1:抗体薬物複合体の受託製造
第21章 ケーススタディ2:抗体薬物複合体治療のためのコンパニオン診断
第22章 SWOT分析
第23章 市場予測と機会分析
第24章 エグゼクティブ洞察
- 章の概要
- Oxford Biotherapeutics
- Angiex
- Syndivia
- BSP Pharmaceuticals
- PolyTherics (an Abzena company)
- CureMeta
- CytomX Therapeutics
- NBE-Therapeutics
- Cerbios-Pharma
- Eisai
- AbTis
- AmbrX
- Synaffix
- Pierre Fabre
- Catalent Pharma Solutions
- Lonza
- Piramal Healthcare
- Ajinomoto Bio-Pharma Services
- Cardiff University
- その他
第25章 結論
第26章 付録1:表形式のデータ
第27章 付録2:企業・団体一覧
List of Tables
- Table 3.1 List of Approved Monoclonal Antibody Therapies
- Table 3.2 Characteristics of Small Molecules and Monoclonal Antibodies and Antibody Drug Conjugates
- Table 3.3 Commonly Used Cytotoxins for Antibody Drug Conjugates
- Table 3.4 Characteristics of First, Second and Third Generation Antibody Drug Conjugates
- Table 4.1 Antibody Drug Conjugates: Information on Drug Candidates, Developer(s), Status of Development, Target Disease Indication(s), and Therapeutic Area(s)
- Table 4.2 Antibody Drug Conjugates: Information on Drug Candidates, Line of Treatment, Dosing Frequency, Type of Therapy, Target Antigen and Antibody Isotype
- Table 4.3 Antibody Drug Conjugates: Information on Drug Candidates, Payload / Cytotoxin / Warhead, Type of Payload, Linker and Type of Linker (Cleavable and Non-Cleavable)
- Table 4.4 Antibody Drug Conjugate Developers: Information on Year of Establishment, Company Size, and Location of Headquarters
- Table 5.1 Target Competitiveness Analysis: Information on Novel Pre-Clinical Stage Targets, Drug Candidates, Developer(s), Target Disease Indication(s) and Therapeutics Area(s)
- Table 6.1 List of Companies Profiled
- Table 6.2 ADC Therapeutics: Company Overview
- Table 6.3 ADC Therapeutics: Antibody Drug Conjugate Pipeline
- Table 6.4 Drug Profile: Zynlonta
- Table 6.5 ADC Therapeutics: Recent Developments and Future Outlook
- Table 6.6 Astellas Pharma: Company Overview
- Table 6.7 Astellas Pharma: Antibody Drug Conjugate Pipeline
- Table 6.8 Drug Profile: Padcev
- Table 6.9 Astellas Pharma: Recent Developments and Future Outlook
- Table 6.10 AstraZeneca: Company Overview
- Table 6.11 AstraZeneca: Antibody Drug Conjugate Pipeline
- Table 6.12 Drug Profile: Enhertu
- Table 6.13 AstraZeneca: Recent Developments and Future Outlook
- Table 6.14 Byondis: Company Overview
- Table 6.15 Byondis: Antibody Drug Conjugate Pipeline
- Table 6.16 Drug Profile: Trastuzumab Duocarmazine
- Table 6.17 Byondis: Recent Developments and Future Outlook
- Table 6.18 Daiichi Sankyo: Company Overview
- Table 6.19 Daiichi Sankyo: Antibody Drug Conjugate Pipeline
- Table 6.20 Drug Profile: Enhertu
- Table 6.21 Daiichi Sankyo: Recent Development and Future Outlook
- Table 6.22 Genentech: Company Overview
- Table 6.23 Genentech: Antibody Drug Conjugate Pipeline
- Table 6.24 Drug Profile: Kadcyla
- Table 6.25 Drug Profile: Polivy
- Table 6.26 Roche / Genentech: Recent Developments and Future Outlook
- Table 6.27 Gilead Sciences: Company Overview
- Table 6.28 Gilead Sciences: Antibody Drug Conjugate Pipeline
- Table 6.29 Drug Profile: Trodelvy
- Table 6.30 Gilead Sciences: Recent Developments and Future Outlook
- Table 6.31 ImmunoGen: Company Overview
- Table 6.32 ImmunoGen: Antibody Drug Conjugate Pipeline
- Table 6.33 Drug Profile: Elahere
- Table 6.34 ImmunoGen: Recent Developments and Future Outlook
- Table 6.35 Pfizer: Company Overview
- Table 6.36 Pfizer: Antibody Drug Conjugate Pipeline
- Table 6.37 Drug Profile: Mylotarg
- Table 6.38 Drug Profile: Besponsa
- Table 6.39 Pfizer: Recent Developments and Future Outlook
- Table 6.40 RemeGen: Company Overview
- Table 6.41 RemeGen: Antibody Drug Conjugate Pipeline
- Table 6.42 Drug Profile: Disitamab vedotin
- Table 6.43 RemeGen: Recent Developments and Future Outlook
- Table 6.44 Seagen: Company Overview
- Table 6.45 Seagen: Antibody Drug Conjugate Pipeline
- Table 6.46 Drug Profile: Adcetris
- Table 6.47 Drug Profile: Padcev
- Table 6.48 Drug Profile: Tivdak
- Table 6.49 Seagen: Recent Developments and Future Outlook
- Table 8.1 Antibody Drug Conjugates: List of Principal Investigators
- Table 10.1 Antibody Drug Conjugates: List of Partnerships and Collaborations, 2014 Onwards
- Table 11.1 Antibody Drug Conjugates: List of Funding and Investments, 2014 Onwards
- Table 11.2 Funding and Investment Analysis: Summary of Investments
- Table 12.1 Patent Analysis: Top CPC Sections
- Table 12.2 Patent Analysis: Top CPC Symbols
- Table 12.3 Patent Analysis: Top CPC Codes
- Table 12.4 Patent Analysis: Summary of Benchmarking Analysis
- Table 12.5 Patent Analysis: Categorization based on Weighted Valuation Scores
- Table 12.6 Patent Portfolio: List of Leading Patents (by Highest Relative Valuation)
- Table 12.7 Patent Portfolio: List of Leading Patents (by Number of Citations)
- Table 14.1 List of Conferences Related to Approved Antibody Drug Conjugates
- Table 14.2 Key Commercialization Strategies: Harvey Ball Analysis by Ease of Implementation, Value Addition and Current Adoption
- Table 15.1 Promotional / Marketing Strategy: Informative Downloads
- Table 15.2 Adcetris: Drug Overview
- Table 15.3 Besponsa: Drug Overview
- Table 15.4 Enhertu: Drug Overview
- Table 15.5 Kadcyla: Drug Overview
- Table 15.6 Mylotarg: Drug Overview
- Table 15.7 Polivy: Drug Overview
- Table 15.8 Trodelvy: Drug Overview
- Table 16.1 List of Top Approved Antibody Drug Conjugates
- Table 16.2 Adcetris (Seagen / Takeda Oncology): Success Protocol Analysis Parameters
- Table 16.3 Besponsa (UCB / Pfizer): Success Protocol Analysis Parameters
- Table 16.4 Elahere (ImmunoGen): Success Protocol Analysis Parameters
- Table 16.5 Enhertu (Seagen / Takeda Oncology): Success Protocol Analysis Parameters
- Table 16.6 Kadcyla (Genentech / ImmunoGen): Success Protocol Analysis Parameters
- Table 16.7 Padcev (Seagen / Astellas Pharma): Success Protocol Analysis Parameters
- Table 16.8 Polivy (Genentech): Success Protocol Analysis Parameters
- Table 16.9 Tivdak (Seagen / Genmab): Success Protocol Analysis Parameters
- Table 16.10 Trodelvy (Gilead Sciences): Success Protocol Analysis Parameters
- Table 16.11 Zynlonta (ADC Therapeutics): Success Protocol Analysis Parameters
- Table 17.1 Antibody Drug Conjugate Conjugation Technologies: Information on Generation of Technology, Type of Specificity, Type of Conjugation and Drug Antibody Ratio
- Table 17.2 Antibody Drug Conjugate Linker and Linker-Payload Technologies: Information on Manufacturer, Linker Name and Type of Linker
- Table 18.1 Antibody Drug Conjugates Non-Clinical Studies: Safety Packages Required
- Table 18.2 Kadcyla: GLP Toxicology Study Results
- Table 18.3 Antibody Drug Conjugates: Dose Limiting Toxicities in Clinical Studies
- Table 18.4 Antibody Drug Conjugates: Relationship Between Dose-Limiting Toxicities and Antibody Drug Conjugate Warhead
- Table 19.1 Antibody Drug Conjugates Components: Information on the Cost of Different Types of Linkers
- Table 19.2 Antibody Drug Conjugates Component: Information on Cost by Type of Cytotoxin
- Table 19.3 Price of Marketed Antibody Drug Conjugates
- Table 19.4 Price of Marketed Targeted Drugs
- Table 20.1 Antibody Drug Conjugates Contract Manufacturing Service Providers: List of Companies
- Table 20.2 Antibody Drug Conjugates Contract Manufacturing Service Providers: List of HPAPI and Cytotoxic Payloads Manufacturing Service Providers
- Table 20.3 Antibody Drug Conjugates Contract Manufacturing Service Providers: Information on Scale of Operation
- Table 20.4 Antibody Drug Conjugate Contract Manufacturing Service Providers: Information on Location of Dedicated Manufacturing Facilities
- Table 21.1 Companion Diagnostics: List of Available / Under Development Tests for Antibody Drug Conjugates
- Table 21.2 Companion Diagnostics: Partnerships and Collaborations, 2017 Onwards
- Table 21.3 Companion Diagnostics for Antibody Therapeutics: List of Available / Under Development Tests
- Table 23.1 Antibody Drug Conjugates: List of Forecasted Therapies
- Table 23.2 Adcetris (Seagen / Takeda Oncology): Net Present Value (USD Billion)
- Table 23.3 Adcetris (Seagen / Takeda Oncology): Value Creation Analysis (USD Billion)
- Table 23.4 Aidixi (RemeGen): Net Present Value (USD Billion)
- Table 23.5 Aidixi (RemeGen): Value Creation Analysis (USD Billion)
- Table 23.6 Besponsa (Pfizer / UCB): Net Present Value (USD Billion)
- Table 23.7 Besponsa (Pfizer / UCB): Value Creation Analysis (USD Billion)
- Table 23.8 Blenrep (GSK): Net Present Value (USD Billion)
- Table 23.9 Blenrep (GSK): Value Creation Analysis (USD Billion)
- Table 23.10 Elahere (ImmunoGen): Net Present Value (USD Billion)
- Table 23.11 Elahere (ImmunoGen): Value Creation Analysis (USD Billion)
- Table 23.12 Enhertu (Daiichi Sankyo / AstraZeneca): Net Present Value (USD Billion)
- Table 23.13 Enhertu (Daiichi Sankyo / AstraZeneca): Value Creation Analysis (USD Billion)
- Table 23.14 Kadcyla (Genentech / ImmunoGen): Net Present Value (USD Billion)
- Table 23.15 Kadcyla (Genentech / ImmunoGen): Value Creation Analysis (USD Billion)
- Table 23.16 Padcev (Seagen / Astellas Pharma): Net Present Value (USD Billion)
- Table 23.17 Padcev (Seagen / Astellas Pharma): Value Creation Analysis (USD Billion)
- Table 23.18 Polivy (Genentech): Net Present Value (USD Billion)
- Table 23.19 Polivy (Genentech): Value Creation Analysis (USD Billion)
- Table 23.20 Tivdak (Seagen / Genmab): Net Present Value (USD Billion)
- Table 23.21 Tivdak (Seagen / Genmab): Value Creation Analysis (USD Billion)
- Table 23.22 Trodelvy (Gilead Sciences): Net Present Value (USD Billion)
- Table 23.23 Trodelvy (Gilead Sciences): Value Creation Analysis (USD Billion)
- Table 23.24 Zynlonta (ADC Therapeutics): Net Present Value (USD Billion)
- Table 23.25 Zynlonta (ADC Therapeutics): Value Creation Analysis (USD Billion)
- Table 23.26 Datopotamab Deruxtecan (Daiichi Sankyo): Net Present Value (USD Billion)
- Table 23.27 Datopotamab Deruxtecan (Daiichi Sankyo): Value Creation Analysis (USD Billion)
- Table 23.28 Patritumab Deruxtecan (Daiichi Sankyo): Net Present Value (USD Billion)
- Table 23.29 Patritumab Deruxtecan (Daiichi Sankyo): Value Creation Analysis (USD Billion)
- Table 23.30 SHR-A1811 (Luzsana Biotechnology): Net Present Value (USD Billion)
- Table 23.31 SHR-A1811 (Luzsana Biotechnology): Value Creation Analysis (USD Billion)
- Table 23.32 SKB264 (Klus Pharma): Net Present Value (USD Billion)
- Table 23.33 SKB264 (Klus Pharma): Value Creation Analysis (USD Billion)
- Table 23.34 TAA013 (Tot Biopharm): Net Present Value (USD Billion)
- Table 23.35 TAA013 (Tot Biopharm): Value Creation Analysis (USD Billion)
- Table 23.36 Telisotuzumab Vedotin (Abbvie): Net Present Value (USD Billion)
- Table 23.37 Telisotuzumab Vedotin (Abbvie): Value Creation Analysis (USD Billion)
- Table 23.38 Trastuzumab Duocarmazine (Byondis): Net Present Value (USD Billion)
- Table 23.39 Trastuzumab Duocarmazine (Byondis): Value Creation Analysis (USD Billion)
- Table 23.40 Tusamitamab Ravtansine (Sanofi / ImmunoGen): Net Present Value (USD Billion)
- Table 23.41 Tusamitamab Ravtansine (Sanofi / ImmunoGen): Value Creation Analysis (USD Billion)
- Table 23.42 Upifitamab Rilsodotin (Mersana Therapeutics): Net Present Value (USD Billion)
- Table 23.43 Upifitamab Rilsodoti (Mersana Therapeutics): Value Creation Analysis (USD Billion)
- Table 24.1 Angiex: Key Highlights
- Table 24.2 Syndivia: Key Highlights
- Table 24.3 BSP Pharmaceuticals: Key Highlights
- Table 24.4 PolyTherics: Key Highlights
- Table 24.5 CureMeta: Key Highlights
- Table 24.6 CytomX: Key Highlights
- Table 24.7 NBE-Therapeutics: Key Highlights
- Table 24.8 Cerbios-Pharma: Key Highlights
- Table 24.9 Eisai: Key Highlights
- Table 24.10 AbTis: Key Highlights
- Table 24.11 AmbrX: Key Highlights
- Table 24.12 Synaffix: Key Highlights
- Table 24.13 Pierre Fabre: Key Highlights
- Table 24.14 Catalent Pharma Solutions: Key Highlights
- Table 24.15 Lonza: Key Highlights
- Table 24.16 Piramal Healthcare: Key Highlights
- Table 24.17 Ajinomoto Bio-Pharma Services: Key Highlights
- Table 24.18 Cardiff University: Key Highlights
- Table 26.1 Antibody Drug Conjugates: Distribution by Status of Development
- Table 26.2 Antibody Drug Conjugates: Distribution by Target Disease Indication
- Table 26.3 Antibody Drug Conjugates: Distribution by Therapeutic Area
- Table 26.4 Antibody Drug Conjugates: Distribution by Line of Treatment
- Table 26.5 Antibody Drug Conjugates: Distribution by Dosing Frequency
- Table 26.6 Antibody Drug Conjugates: Distribution by Type of Therapy
- Table 26.7 Antibody Drug Conjugates: Distribution by Target Antigen
- Table 26.8 Antibody Drug Conjugates: Distribution by Antibody Isotype
- Table 26.9 Antibody Drug Conjugates: Distribution by Type of Payload / Cytotoxin / Warhead
- Table 26.10 Antibody Drug Conjugates: Distribution by Type of Payload
- Table 26.11 Antibody Drug Conjugates: Distribution by Linker
- Table 26.12 Antibody Drug Conjugates: Distribution by Type of Linker
- Table 26.13 Antibody Drug Conjugate Developers: Distribution by Year of Establishment
- Table 26.14 Antibody Drug Conjugates Developers: Distribution by Company Size
- Table 26.15 Antibody Drug Conjugates Developers: Distribution by Location of Headquarters
- Table 26.16 Antibody Drug Conjugate Developers: Distribution by Company Size and Location of Headquarters
- Table 26.17 Most Active Players: Distribution by Number of Antibody Drug Conjugates
- Table 26.18 ADC Therapeutics: Annual Revenues, 2021 Onwards (USD Million)
- Table 26.19 Astellas Pharma: Annual Revenues, FY 2018 Onwards (JPY Billion)
- Table 26.20 AstraZeneca: Annual Revenues, 2018 Onwards (USD Billion)
- Table 26.21 Byondis: Annual Revenues, 2019 Onwards (EUR Million)
- Table 26.22 Daiichi Sankyo: Annual Revenues, FY 2018 Onwards (JPY Billion)
- Table 26.23 Roche (Parent Company of Genentech): Annual Revenues, 2018 Onwards (CHF Billion)
- Table 26.24 Gilead Sciences: Annual Revenues, 2018 Onwards (USD Billion)
- Table 26.25 ImmunoGen: Annual Revenues, 2018 Onwards (USD Million)
- Table 26.26 Pfizer: Annual Revenues, 2018 Onwards (USD Billion)
- Table 26.27 RemGen: Annual Revenues, 2021 Onwards (CNY Million)
- Table 26.28 Seagen: Annual Revenues, 2018 Onwards (USD Million)
- Table 26.29 Clinical Trial Analysis: Cumulative Distribution by Trial Registration Year, 2016 Onwards
- Table 26.30 Clinical Trial Analysis: Distribution by Trial Status
- Table 26.31 Clinical Trial Analysis: Distribution by Trial Status and Patients Enrolled
- Table 26.32 Clinical Trial Analysis: Distribution by Trial Registration Year and Trial Status, 2016 Onwards
- Table 26.33 Clinical Trial Analysis: Distribution by Trial Registration Year and Patients Enrolled, 2016 Onwards
- Table 26.34 Clinical Trial Analysis: Distribution by Trial Phase
- Table 26.35 Clinical Trial Analysis: Distribution by Trial Phase and Patients Enrolled
- Table 26.36 Clinical Trial Analysis: Distribution by Type of Sponsor / Collaborator
- Table 26.37 Clinical Trial Analysis: Distribution by Target Population
- Table 26.38 Clinical Trial Analysis: Distribution by Study Design
- Table 26.39 Most Active Industry Players: Distribution by Number of Trials
- Table 26.40 Most Active Non-Industry Players: Distribution by Number of Trials
- Table 26.41 Clinical Trial Analysis: Geographical Distribution by Number of Clinical Trials
- Table 26.42 Clinical Trial Analysis: Geographical Distribution by Number of Patients Enrolled
- Table 26.43 Antibody Drug Conjugates KOL Analysis: Distribution by Type of KOLs
- Table 26.44 Antibody Drug Conjugates KOL Analysis: Distribution by Qualification(s)
- Table 26.45 Antibody Drug Conjugates KOL Analysis: Distribution by Affiliated Organization
- Table 26.46 Antibody Drug Conjugates KOL Analysis: Distribution by Type of Organization
- Table 26.47 Antibody Drug Conjugates: Geographical Distribution of KOLs
- Table 26.48 Antibody Drug Conjugates Most Prominent KOLs: Distribution by RA Score
- Table 26.49 Antibody Drug Conjugates Most Prominent KOLs: Comparison of RA Score with Third-Party Score
- Table 26.50 Antibody Drug Conjugates Clinical Studies: Distribution by Trial Registration Year and Type of Therapy
- Table 26.51 Antibody Drug Conjugate-based Combination Therapies: Distribution by Phase of Development
- Table 26.52 Antibody Drug Conjugate-based Combination Therapies: Distribution by Trial Status
- Table 26.53 Antibody Drug Conjugate-based Combination Therapies: Distribution by Target Disease Indication
- Table 26.54 Most Popular Antibody Drug Conjugates Used in Combination Therapies: Distribution by Number of Trials
- Table 26.55 Most Popular Drug Classes Used in Antibody Drug Conjugate-based Combination Therapies: Distribution by Number of Trials
- Table 26.56 Partnerships and Collaborations: Cumulative Year-wise Trend, 2014 Onwards
- Table 26.57 Partnerships and Collaborations: Distribution by Type of Partnership
- Table 26.58 Partnerships and Collaborations: Distribution by Year and Type of Partnership, 2014-2023
- Table 26.59 Partnerships and Collaborations: Distribution by Purpose of Partnership
- Table 26.60 Partnerships and Collaborations: Distribution by Type of Partner
- Table 26.61 Most Active Players: Distribution by Number for Partnerships
- Table 26.62 Partnerships and Collaborations: International and Local Agreements
- Table 26.63 Partnerships and Collaborations: Intercontinental and Intracontinental Agreements
- Table 26.64 Funding and Investment Analysis: Cumulative Distribution of Instances, 2016 Onwards
- Table 26.65 Funding and Investment Analysis: Cumulative Distribution of Amount Invested, 2016 Onwards (USD Million)
- Table 26.66 Funding and Investment Analysis: Distribution of Instances by Type of Funding
- Table 26.67 Funding and Investment Analysis: Distribution of Amount Invested by Type of Funding (USD Million)
- Table 26.68 Funding and Investments: Distribution of Amount Invested by Year and Type of Funding
- Table 26.69 Funding and Investment Analysis: Distribution of Instances by Type of Investor
- Table 26.70 Funding and Investment Analysis: Distribution of Funding Instances by Region
- Table 26.71 Funding and Investment Analysis: Distribution of Amount Invested by Country (USD Million)
- Table 26.72 Most Active Players: Distribution by Number of Funding Instances
- Table 26.73 Most Active Players: Distribution by Amount Invested (USD Million)
- Table 26.74 Key Investors: Distribution by Number of Instances
- Table 26.75 Patent Analysis: Distribution by Type of Patent
- Table 26.76 Patent Analysis: Cumulative Distribution by Patent Publication Year, 2019 Onwards
- Table 26.77 Patent Analysis: Cumulative Distribution by Patent Application Year, 2018 Onwards
- Table 26.78 Patent Analysis: Year-wise Distribution of Granted Patents and Patent Applications, 2019 Onwards
- Table 26.79 Patent Analysis: Distribution by Patent Jurisdiction (Region-wise)
- Table 26.80 Patent Analysis: Distribution by Patent Jurisdiction (Country-wise)
- Table 26.81 Patent Analysis: Cumulative Year-wise Distribution by Type of Applicant, 2019 Onwards
- Table 26.82 Leading Industry Players: Distribution by Number of Patents
- Table 26.83 Leading Non-Industry Players: Distribution by Number of Patents
- Table 26.84 Leading Individual Assignees: Distribution by Number of Patents
- Table 26.85 Patent Analysis: Distribution by Patent Age
- Table 26.86 Grants Analysis: Cumulative Distribution by Year of Grant, 2016 Onwards
- Table 26.87 Grants Analysis: Distribution by Cumulative Amount Awarded (USD Million), 2016- 2023
- Table 26.88 Grants Analysis: Distribution by Funding Institute Center
- Table 26.89 Grants Analysis: Distribution by Support Period
- Table 26.90 Grants Analysis: Distribution by Type of Grant Applications
- Table 26.91 Grants Analysis: Distribution by Purpose of Grant Award
- Table 26.92 Grants Analysis: Distribution by Activity Code
- Table 26.93 Grants Analysis: Distribution by Study Section Involved
- Table 26.94 Popular NIH Departments: Distribution by Number of Grants
- Table 26.95 Prominent Program Officers: Distribution by Number of Grants
- Table 26.96 Popular Recipient Organizations: Distribution by Number of Grants
- Table 26.97 Popular Recipient Organizations: Distribution by Grant Amount (USD Million)
- Table 26.98 Grants Analysis: Distribution by Region of Recipient Organization
- Table 26.99 Antibody Drug Conjugate Contract Manufacturing Service Providers: Distribution by Scale of Operation
- Table 26.100 Antibody Drug Conjugate Contract Manufacturing Service Providers: Distribution by Location of Manufacturing Facilities
Table 26.101Companion Diagnostics for Antibody Therapeutics: Distribution by Target Antigen
- Table 26.102 Companion Diagnostics for Antibody Therapeutics: Distribution by Type of Cancer
- Table 26.103 Companion Diagnostics for Antibody Therapeutics: Distribution by Key Players
- Table 26.104 Global Antibody Drug Conjugates Market, Conservative, Base and Optimistic Scenarios, till 2035 (USD Billion)
- Table 26.105 Antibody Drug Conjugates Market: Distribution by Target Disease Indication, Current Year and 2035 (USD Billion)
- Table 26.106 Antibody Drug Conjugates Market for Breast Cancer, Conservative, Base and Optimistic Scenarios, till 2035 (USD Billion)
- Table 26.107 Antibody Drug Conjugates Market for B-cell Lymphoma, Conservative, Base and Optimistic Scenarios, till 2035 (USD Billion)
- Table 26.108 Antibody Drug Conjugates Market for Lung Cancer, Conservative, Base and Optimistic Scenarios, till 2035 (USD Billion)
- Table 26.109 Antibody Drug Conjugates Market for Multiplr Myeloma, Conservative, Base and Optimistic Scenarios, till 2035 (USD Billion)
- Table 26.110 Antibody Drug Conjugates Market for Renal Cancer, Conservative, Base and Optimistic Scenarios, till 2035 (USD Billion)
- Table 26.111 Antibody Drug Conjugates Market for Gastric Cancer, Conservative, Base and Optimistic Scenarios, till 2035 (USD Billion)
- Table 26.112 Antibody Drug Conjugates Market for Cervical Cancer, Conservative, Base and Optimistic Scenarios, till 2035 (USD Billion)
- Table 26.113 Antibody Drug Conjugates Market for Acute Lymphoblastic Leukemia, Conservative, Base and Optimistic Scenarios, till 2035 (USD Billion)
- Table 26.114 Antibody Drug Conjugates Market for Other Target Disease Indication, Conservative, Base and Optimistic Scenarios, till 2035 (USD Billion)
- Table 26.115 Antibody Drug Conjugates Market: Distribution by Therapeutic Area, Current Year and 2035 (USD Billion)
- Table 26.116 Antibody Drug Conjugates Market for Solid Tumors, Conservative, Base and Optimistic Scenarios, till 2035 (USD Billion)
- Table 26.117 Antibody Drug Conjugates Market for Hematological Cancer, Conservative, Base and Optimistic Scenarios, till 2035 (USD Billion)
- Table 26.118 Antibody Drug Conjugates Market, Current Year and 2035: Distribution by Linker (USD Billion)
- Table 26.119 Antibody Drug Conjugates Market for Valine-Citrulline Linker, Conservative, Base and Optimistic Scenarios, till 2035 (USD Billion)
- Table 26.120 Antibody Drug Conjugates Market for Tetrapeptide-based Linker, Conservative, Base and Optimistic Scenarios, till 2035 (USD Billion)
- Table 26.121 Antibody Drug Conjugates Market for Succinimidyl-4-(N-maleimidomethyl) cyclohexane-1-carboxylate Linker, Conservative, Base and Optimistic Scenarios, till 2035 (USD Billion)
- Table 26.122 Antibody Drug Conjugates Market for Maleimide Linker, Conservative, Base and Optimistic Scenarios, till 2035 (USD Billion)
- Table 26.123 Antibody Drug Conjugates Market for Maleimidocaproyl Linker, Conservative, Base and Optimistic Scenarios, till 2035 (USD Billion)
- Table 26.124 Antibody Drug Conjugates Market for Valine-alanine Linker, Conservative, Base and Optimistic Scenarios, till 2035 (USD Billion)
- Table 26.125 Antibody Drug Conjugates Market for Hydrazone (4-(4-acetylphenoxy) butanoic acid (AcBut) Linker, Conservative, Base and Optimistic Scenarios, till 2035 (USD Billion)
- Table 26.126 Antibody Drug Conjugates Market for Other Linkers, Conservative, Base and Optimistic Scenarios, till 2035 (USD Billion)
- Table 26.127 Global Antibody Drug Conjugates Market, Current Year and 2035: Distribution by Payload (USD Billion)
- Table 26.128 Antibody Drug Conjugates Market for Monomethyl auristatin F (MMAF) Payload, Conservative, Base and Optimistic Scenarios, till 2035 (USD Billion)
- Table 26.129 Antibody Drug Conjugates Market for DM1 Payload, Conservative, Base and Optimistic Scenarios, till 2035 (USD Billion)
- Table 26.130 Antibody Drug Conjugates Market for SN-38 / Irinotecan Payload, Conservative, Base and Optimistic Scenarios, till 2035 (USD Billion)
- Table 26.131 Antibody Drug Conjugates Market for Monomethyl auristatin E (MMAE) Payload, Conservative, Base and Optimistic Scenarios, till 2035
- Table 26.132 Antibody Drug Conjugates Market for Duocarmycin Payload, Conservative, Base and Optimistic Scenarios, till 2035 (USD Billion)
- Table 26.133 Antibody Drug Conjugates Market for SG3199 Payload, Conservative, Base and Optimistic Scenarios, till 2035 (USD Billion)
- Table 26.134 Antibody Drug Conjugates Market for Ozogamicin Payload, Conservative, Base and Optimistic Scenarios, till 2035 (USD Billion)
- Table 26.135 Antibody Drug Conjugates Market for DM4 Payload, Conservative, Base and Optimistic Scenarios, till 2035 (USD Billion)
- Table 26.136 Antibody Drug Conjugates Market for Other Payloads, Conservative, Base and Optimistic Scenarios, till 2035 (USD Billion)
- Table 26.137 Antibody Drug Conjugates Market, 2023 and 2035: Distribution by Target Antigen (USD Billion)
- Table 26.138 Antibody Drug Conjugates Market for HER-2 (ERBB2), Conservative, Base and Optimistic Scenarios, till 2035 (USD Billion)
- Table 26.139 Antibody Drug Conjugates Market for CD79b, Conservative, Base and Optimistic Scenarios, till 2035 (USD Billion)
- Table 26.140 Antibody Drug Conjugates Market for TROP-2, Conservative, Base and Optimistic Scenarios, till 2035 (USD Billion)
- Table 26.141 Antibody Drug Conjugates Market for BCMA (TNFRSF17 / BCM), Conservative, Base and Optimistic Scenarios, till 2035 (USD Billion)
- Table 26.142 Antibody Drug Conjugates Market for CD19, Conservative, Base and Optimistic Scenarios, till 2035 (USD Billion)
- Table 26.143 Antibody Drug Conjugates Market for Nectin 4, Conservative, Base and Optimistic Scenarios, till 2035 (USD Billion)
- Table 26.144 Antibody Drug Conjugates Market for Tissue Factor, Conservative, Base and Optimistic Scenarios, till 2035 (USD Billion)
- Table 26.145 Antibody Drug Conjugates Market for CD22, Conservative, Base and Optimistic Scenarios, till 2035 (USD Billion)
- Table 26.146 Antibody Drug Conjugates Market for CD30, Conservative, Base and Optimistic Scenarios, till 2035 (USD Billion)
- Table 26.147 Antibody Drug Conjugates Market for CEACAM5, Conservative, Base and Optimistic Scenarios, till 2035 (USD Billion)
- Table 26.148 Antibody Drug Conjugates Market for Other Target Antigens, Conservative, Base and Optimistic Scenarios, till 2035 (USD Billion)
- Table 26.149 Global Antibody Drug Conjugates Market, Current Year and 2035: Distribution by Key Geographical Regions (USD Billion)
- Table 26.150 Antibody Drug Conjugates Market in North America, Conservative, Base and Optimistic Scenarios, till 2035 (USD Billion)
- Table 26.151 Antibody Drug Conjugates Market in US, Conservative, Base and Optimistic Scenarios, till 2035 (USD Billion)
- Table 26.152 Antibody Drug Conjugates Market in Canada, Conservative, Base and Optimistic Scenarios, till 2035 (USD Billion)
- Table 26.153 Antibody Drug Conjugates Market in Europe, Conservative, Base and Optimistic Scenarios, till 2035 (USD Billion)
- Table 26.154 Antibody Drug Conjugates Market in Germany, Conservative, Base and Optimistic Scenarios, till 2035 (USD Billion)
- Table 26.155 Antibody Drug Conjugates Market in UK, Conservative, Base and Optimistic Scenarios, till 2035 (USD Billion)
- Table 26.156 Antibody Drug Conjugates Market in France, Conservative, Base and Optimistic Scenarios, till 2035 (USD Billion)
- Table 26.157 Antibody Drug Conjugates Market in Italy, Conservative, Base and Optimistic Scenarios, till 2035 (USD Billion)
- Table 26.158 Antibody Drug Conjugates Market in Spain, Conservative, Base and Optimistic Scenarios, till 2035 (USD Billion)
- Table 26.159 Antibody Drug Conjugates Market in Asia-Pacific, Conservative, Base and Optimistic Scenarios, till 2035 (USD Billion)
- Table 26.160 Antibody Drug Conjugates Market in China, Conservative, Base and Optimistic Scenarios, till 2035 (USD Billion)
- Table 26.161 Antibody Drug Conjugates Market in Australia,, Conservative, Base and Optimistic Scenarios, till 2035 (USD Billion)
- Table 26.162 Antibody Drug Conjugates Market in Japan,, Conservative, Base and Optimistic Scenarios, till 2035 (USD Billion)
- Table 26.163 Adcetris: Sales Forecast, Conservative, Base and Optimistic Scenarios, till 2035 (USD Billion)
- Table 26.164 Aidixi: Sales Forecast, Conservative, Base and Optimistic Scenarios, till 2035 (USD Billion)
- Table 26.165 Besponsa: Sales Forecast, Conservative, Base and Optimistic Scenarios, till 2035 (USD Billion)
- Table 26.166 Blenrep: Sales Forecast, Conservative, Base and Optimistic Scenarios, till 2035 (USD Billion)
- Table 26.167 Elahere: Sales Forecast, Conservative, Base and Optimistic Scenarios, till 2035 (USD Billion)
- Table 26.168 Enhertu: Sales Forecast, Conservative, Base and Optimistic Scenarios, till 2035 (USD Billion)
- Table 26.169 Kadcyla: Sales Forecast, Conservative, Base and Optimistic Scenarios, till 2035 (USD Billion)
- Table 26.170 Padcev: Sales Forecast, Conservative, Base and Optimistic Scenarios, till 2035 (USD Billion)
- Table 26.171 Polivy: Sales Forecast, Conservative, Base and Optimistic Scenarios, till 2035 (USD Billion)
- Table 26.172 Tivdak: Sales Forecast, Conservative, Base and Optimistic Scenarios, till 2035 (USD Billion)
- Table 26.173 Trodelvy: Sales Forecast, Conservative, Base and Optimistic Scenarios, till 2035 (USD Billion)
- Table 26.174 Zynlonta: Sales Forecast, Conservative, Base and Optimistic Scenarios, till 2035 (USD Billion)
- Table 26.175 Datopotamab Deruxtecan: Sales Forecast, Conservative, Base and Optimistic Scenarios, 2028-2035 (USD Billion)
- Table 26.176 Patritumab Deruxtecan: Sales Forecast, Conservative, Base and Optimistic Scenarios, 2028-2035 (USD Billion)
- Table 26.177 SHR-A1811: Sales Forecast, Conservative, Base and Optimistic Scenarios, till 2035 (USD Billion)
- Table 26.178 SKB264: Sales Forecast, Conservative, Base and Optimistic Scenarios, till 2035 (USD Billion)
- Table 26.179 TAA013: Sales Forecast, Conservative, Base and Optimistic Scenarios, till 2035 (USD Billion)
- Table 26.180 Telisotuzumab Vedotin: Sales Forecast, Conservative, Base and Optimistic Scenarios, till 2035 (USD Billion)
- Table 26.181 Trastuzumab Duocarmazine: Sales Forecast, Conservative, Base and Optimistic Scenarios, till 2035 (USD Billion)
- Table 26.182 Tusamitamab Ravtansine: Sales Forecast, Conservative, Base and Optimistic Scenarios, till 2035 (USD Billion)
- Table 26.183 Upifitamab Rilsodotin: Sales Forecast, Conservative, Base and Optimistic Scenarios, till 2035 (USD Billion)
List of Figures
- Figure 2.1 Executive Summary: Market Overview
- Figure 2.2 Executive Summary: Clinical Trial Analysis
- Figure 2.3 Executive Summary: Partnerships and Collaborations
- Figure 2.4 Executive Summary: Funding and Investment Analysis
- Figure 2.5 Executive Summary: Patent Analysis
- Figure 2.6 Executive Summary: Academic Grants Analysis
- Figure 2.7 Executive Summary: Market Sizing and Opportunity Analysis
- Figure 3.1 Pillars of Cancer Therapy
- Figure 3.2 Antibody Drug Conjugates: Development History
- Figure 3.3 Comparative Analysis of Pharmacokinetic Properties of Antibody Drug Conjugates: Dosage Regimen, Cmax and T1/2
- Figure 3.4 Components of Antibody Drug Conjugates
- Figure 4.1 Antibody Drug Conjugates: Distribution by Status of Development
- Figure 4.2 Antibody Drug Conjugates: Distribution by Target Disease Indication
- Figure 4.3 Antibody Drug Conjugates: Distribution by Therapeutic Area
- Figure 4.4 Antibody Drug Conjugates: Distribution by Line of Treatment
- Figure 4.5 Antibody Drug Conjugates: Distribution by Dosing Frequency
- Figure 4.6 Antibody Drug Conjugates: Distribution by Type of Therapy
- Figure 4.7 Antibody Drug Conjugates: Distribution by Target Antigen
- Figure 4.8 Antibody Drug Conjugates: Distribution by Antibody Isotype
- Figure 4.9 Antibody Drug Conjugates: Distribution by Payload / Cytotoxin / Warhead
- Figure 4.10 Antibody Drug Conjugates: Distribution by Type of Payload
- Figure 4.11 Antibody Drug Conjugates: Distribution by Linker
- Figure 4.12 Antibody Drug Conjugates: Distribution by Type of Linker
- Figure 4.13 Antibody Drug Conjugate Developers: Distribution by Year of Establishment
- Figure 4.14 Antibody Drug Conjugate Developers: Distribution by Company Size
- Figure 4.15 Antibody Drug Conjugate Developers: Distribution by Location of Headquarters
- Figure 4.16 Antibody Drug Conjugate Developers: Distribution by Company Size and Location of Headquarters
- Figure 4.17 Most Active Players: Distribution by Number of Antibody Drug Conjugates
- Figure 5.1 Antibody Drug Conjugates: Three-Dimensional Bubble Analysis for Approved / Marketed Targets
- Figure 5.2 Antibody Drug Conjugates: Three-Dimensional Bubble Analysis for Phase III Targets
- Figure 5.3 Antibody Drug Conjugates: Three-Dimensional Bubble Analysis for Phase II Targets
- Figure 5.4 Antibody Drug Conjugates: Three-Dimensional Bubble Analysis for Phase I Targets
- Figure 5.4 Antibody Drug Conjugates: Three-Dimensional Bubble Analysis for Pre-Clinical Stage Targets
- Figure 5.5 Antibody Drug Conjugates: Six-Dimensional Spider Web Analysis
- Figure 6.1 ADC Therapeutics: Annual Revenues, 2021 Onwards (USD Million)
- Figure 6.2 Astellas Pharma: Annual Revenues, FY 2018 Onwards (JPY Billion)
- Figure 6.3 AstraZeneca: Annual Revenues, 2018 Onwards (USD Billion)
- Figure 6.4 Byondis: Annual Revenues, 2019 Onwards (EUR Million)
- Figure 6.5 Daiichi Sankyo: Annual Revenues, FY 2018 Onwards (JPY Billion)
- Figure 6.6 Roche (Parent Company of Genentech): Annual Revenues, 2018 Onwards (CHF Billion)
- Figure 6.7 Gilead Sciences: Annual Revenues, 2018 Onwards (USD Billion)
- Figure 6.8 ImmunoGen: Annual Revenues, 2018 Onwards (USD Million)
- Figure 6.9 Pfizer: Annual Revenues, 2018 Onwards (USD Billion)
- Figure 6.10 RemeGen: Annual Revenues, 2021 Onwards (CNY Million)
- Figure 6.11 Seagen: Annual Revenues, 2018 Onwards (USD Million)
- Figure 7.1 Clinical Trial Analysis: Scope and Methodology
- Figure 7.2 Clinical Trial Analysis: Cumulative Distribution by Trial Registration Year, Pre-2016-2023
- Figure 7.3 Clinical Trial Analysis: Distribution by Trial Status
- Figure 7.4 Clinical Trial Analysis: Distribution by Trial Status and Patients Enrolled
- Figure 7.5 Clinical Trial Analysis: Distribution by Trial Registration Year and Trial Status, 2016 Onwards
- Figure 7.6 Clinical Trial Analysis: Distribution by Trial Registration Year and Patients Enrolled, 2016 Onwards
- Figure 7.7 Clinical Trial Analysis: Distribution by Trial Phase
- Figure 7.8 Clinical Trial Analysis: Distribution by Trial Phase and Patients Enrolled
- Figure 7.9 Clinical Trial Analysis: Distribution by Type of Sponsor / Collaborator
- Figure 7.10 Clinical Trial Analysis: Distribution by Target Population
- Figure 7.11 Clinical Trial Analysis: Distribution by Study Design
- Figure 7.12 Most Active Industry Players: Distribution by Number of Trials
- Figure 7.13 Most Active Non-Industry Players: Distribution by Number of Trials
- Figure 7.14 Clinical Trial Analysis: Geographical Distribution by Number of Clinical Trials
- Figure 8.1 Antibody Drug Conjugates KOL Analysis: Distribution by Type of KOLs
- Figure 8.2 Antibody Drug Conjugates KOL Analysis: Distribution by Qualification
- Figure 8.3 Antibody Drug Conjugates KOL Analysis: Distribution by Affiliated Organization
- Figure 8.4 Antibody Drug Conjugates KOL Analysis: Distribution by Type of Organization
- Figure 8.5 Antibody Drug Conjugates: Geographical Distribution of KOLs
- Figure 8.6 Most Prominent Principal Investigators: Analysis by KOL Activeness, Expertise and Strength
- Figure 8.7 Most Prominent Study Directors and Study Chairs: Analysis by KOL Activeness, Expertise and Strength
- Figure 8.8 Antibody Drug Conjugates Most Prominent KOLs: Distribution by RA Score
- Figure 8.9 Antibody Drug Conjugates Most Prominent KOLs: Comparison of RA Score with Third-Party Score
- Figure 8.10 Antibody Drug Conjugates Most Prominent KOLs: Comparison of RA Score with Third-Party Score (Scatter Plot)
- Figure 9.1 Antibody Drug Conjugates Clinical Studies: Distribution by Trial Registration Year and Type of Therapy
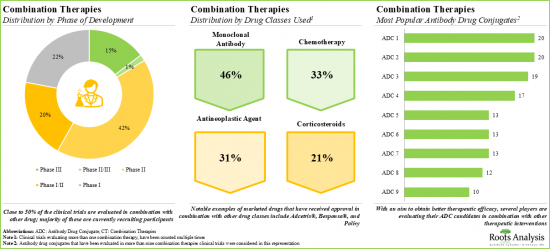
- Figure 9.2 Antibody Drug Conjugate-based Combination Therapies: Distribution by Phase of Development
- Figure 9.3 Antibody Drug Conjugate-based Combination Therapies: Distribution by Trial Status
- Figure 9.4 Antibody Drug Conjugate-based Combination Therapies: Distribution by Target Disease Indication
- Figure 9.5 Most Popular Antibody Drug Conjugates Used in Combination Therapies: Distribution by Number of Trials
- Figure 9.6 Most Popular Drug Classes Used in Antibody Drug Conjugate-based Combination Therapies: Distribution by Number of Trials
- Figure 9.7 Antibody Drug Conjugate-based Combination Therapies: Distribution by Target Disease Indication and Drug Class
- Figure 9.8 Antibody Drug Conjugate-Based Combination Therapies: Benchmarking of Popular Drug Classes for Blood Cancer
- Figure 9.9 Antibody Drug Conjugate-Based Combination Therapies: Benchmarking of Popular Drug Classes for Breast Cancer
- Figure 9.10 Antibody Drug Conjugate-Based Combination Therapies: Benchmarking of Popular Drug Classes for Renal Cancer
- Figure 9.11 Antibody Drug Conjugate-Based Combination Therapies: Benchmarking of Popular Drug Classes for Lung Cancer
- Figure 9.12 Antibody Drug Conjugate-Based Combination Therapies: Benchmarking of Popular Drug Classes for Ovarian Cancer
- Figure 9.13 Antibody Drug Conjugate-Based Combination Therapies: Benchmarking of Popular Drug Classes for Gastric Cancer
- Figure 10.1 Partnerships and Collaborations: Cumulative Year-wise Trend, 2014 Onwards
- Figure 10.2 Partnerships and Collaborations: Distribution by Type of Partnership
- Figure 10.3 Partnerships and Collaborations: Distribution by Year and Type of Partnership, 2014 Onwards
- Figure 10.4 Partnerships and Collaborations: Distribution by Purpose of Partnership
- Figure 10.5 Partnerships and Collaborations: Distribution by Type of Partner
- Figure 10.6 Most Active Players: Distribution by Number for Partnerships
- Figure 10.7 Partnerships and Collaborations: International and Local Agreements
- Figure 10.8 Partnerships and Collaborations: Intercontinental and Intracontinental Agreements
- Figure 11.1 Funding and Investment Analysis: Cumulative Distribution of Instances, 2016 Onwards
- Figure 11.2 Funding and Investment Analysis: Cumulative Distribution of Amount Invested, 2016 Onwards (USD Million)
- Figure 11.3 Funding and Investment Analysis: Distribution of Instances by Type of Funding
- Figure 11.4 Funding and Investment Analysis: Distribution of Amount Invested by Type of Funding (USD Million)
- Figure 11.5 Funding and Investments: Distribution of Amount Invested by Year and Type of Funding
- Figure 11.6 Funding and Investment Analysis: Distribution of Instances by Type of Investor
- Figure 11.7 Funding and Investment Analysis: Distribution of Amount Invested by Region (USD Million)
- Figure 11.8 Funding and Investment Analysis: Distribution of Amount Invested by Country (USD Million)
- Figure 11.9 Most Active Players: Distribution by Number of Funding Instances
- Figure 11.10 Most Active Players: Distribution by Amount Invested (USD Million)
- Figure 11.11 Key Investors: Distribution by Number of Instances
- Figure 12.1 Patent Analysis: Distribution by Type of Patent
- Figure 12.2 Patent Analysis: Cumulative Distribution by Patent Publication Year, 2019 Onwards
- Figure 12.3 Patent Analysis: Cumulative Distribution by Patent Application Year, 2018 Onwards
- Figure 12.4 Patent Analysis: Year-wise Distribution of Granted Patents and Patent Applications, 2019 Onwards
- Figure 12.5 Patent Analysis: Distribution by Patent Jurisdiction (Region-wise)
- Figure 12.6 Patent Analysis: Distribution by Patent Jurisdiction (Country-wise)
- Figure 12.7 Patent Analysis: Distribution by CPC Symbols
- Figure 12.8 Patent Analysis: Cumulative Year-wise Distribution by Type of Applicant, 2019 Onwards
- Figure 12.9 Leading Industry Players: Distribution by Number of Patents
- Figure 12.10 Leading Non-Industry Players: Distribution by Number of Patents
- Figure 12.11 Leading Individual Assignees: Distribution by Number of Patents
- Figure 12.12 Patent Benchmarking Analysis: Distribution of Leading Industry Player by Patent Characteristics (CPC Codes)
- Figure 12.13 Patent Analysis: Distribution by Patent Age
- Figure 12.14 Antibody Drug Conjugates: Patent Valuation
- Figure 13.1 Grants Analysis: Cumulative Distribution by Year of Grant, 2016 Onwards
- Figure 13.2 Grants Analysis: Distribution by Cumulative Amount Awarded (USD Million), 2016 Onwards
- Figure 13.3 Grants Analysis: Distribution by Funding Institute Center
- Figure 13.4 Grants Analysis: Distribution by Support Period
- Figure 13.5 Grants Analysis: Distribution by Type of Grant Application
- Figure 13.6 Grants Analysis: Distribution by Purpose of Grant Award
- Figure 13.7 Grants Analysis: Distribution by Activity Code
- Figure 13.8 Grants Analysis: Distribution by Study Section Involved
- Figure 13.9 Popular NIH Departments: Distribution by Number of Grants
- Figure 13.10 Prominent Program Officers: Distribution by Number of Grants
- Figure 13.11 Popular Recipient Organizations: Distribution by Number of Grants
- Figure 13.12 Popular Recipient Organizations: Distribution by Grant Amount (USD Million)
- Figure 13.13 Grants Analysis: Distribution by Region of Recipient Organization
- Figure 14.1 Successful Drug Launch Strategy: ROOTS Framework
- Figure 14.2 Successful Drug Launch Strategy: Product Differentiation
- Figure 14.3 Common Commercialization Strategies Adopted Based on Development Stage of Product
- Figure 14.4 Harvey Ball Analysis: Commercialization Strategies Adopted by Companies Focused on Developing Antibody Drug Conjugates
- Figure 14.5 Antibody Drug Conjugates Approval in Multiple Geographies: Historical Timeline
- Figure 14.6 Approved Antibody Drug Conjugates: Snapshot of Promotional Activities on Product Website
- Figure 15.1 Channels Used for Promotional Campaigns
- Figure 15.2 Promotional / Marketing Strategy: Product Website Analysis
- Figure 15.3 Product Website Analysis: Adcetris, Messages for Healthcare Professionals
- Figure 15.4 Product Website Analysis: Adcetris, Messages for Patients
- Figure 15.5 Product Website Analysis: Adcetris, Patient Support Program
- Figure 15.6 Product Website Analysis: Besponsa, Messages for Healthcare Professionals
- Figure 15.7 Product Website Analysis: Besponsa, Messages for Patients
- Figure 15.8 Product Website Analysis: Besponsa, Patient Support Program
- Figure 15.9 Product Website Analysis: Enhertu, Messages for Healthcare Professionals
- Figure 15.10 Product Website Analysis: Enhertu, Messages for Patients
- Figure 15.11 Product Website Analysis: Enhertu, Patient Support Program
- Figure 15.12 Product Website Analysis: Kadcyla, Messages for Healthcare Professionals
- Figure 15.13 Product Website Analysis: Kadcyla, Messages for Patients
- Figure 15.14 Product Website Analysis: Kadacyla, Patient Support Program
- Figure 15.15 Product Website Analysis: Mylotarg, Messages for Healthcare Professionals
- Figure 15.16 Product Website Analysis: Mylotarg, Messages for Patients
- Figure 15.17 Product Website Analysis: Mylotarg, Patient Support Program
- Figure 15.18 Product Website Analysis: Pfizer Oncology Together Program
- Figure 15.19 Product Website Analysis: Polivy, Messages for Healthcare Professionals
- Figure 15.20 Product Website Analysis: Polivy, Messages for Patients
- Figure 15.21 Product Website Analysis: Polivy, Patient Support Program
- Figure 15.22 Product Website Analysis: Trodelvy, Messages for Healthcare Professionals
- Figure 15.23 Product Website Analysis: Messages for Patients
- Figure 15.24 Product Website Analysis: Trodelvy, Patient Support Program
- Figure 16.1 Adcetris (Seagen / Takeda Oncology): Approval Timeline
- Figure 16.2 Adcetris (Seagen / Takeda Oncology): Success Protocol Analysis
- Figure 16.3 Besponsa (UCB / Pfizer): Approval Timeline
- Figure 16.4 Besponsa (UCB / Pfizer): Success Protocol Analysis
- Figure 16.5 Elahere (ImmunoGen): Approval Timeline
- Figure 16.6 Elahere (ImmunoGen): Success Protocol Analysis
- Figure 16.7 Enhertu (Daiichi Sankyo / AstraZeneca): Approval Timeline
- Figure 16.8 Enhertu (Daiichi Sankyo / AstraZeneca): Success Protocol Analysis
- Figure 16.9 Kadcyla (Genentech / ImmunoGen): Approval Timeline
- Figure 16.10 Kadcyla (Genentech / ImmunoGen): Success Protocol Analysis
- Figure 16.11 Padcev (Seagen / Astellas Pharma): Approval Timeline
- Figure 16.12 Padcev (Seagen / Astellas Pharma): Success Protocol Analysis
- Figure 16.13 Polivy (Genentech): Approval Timeline
- Figure 16.14 Polivy (Genentech): Success Protocol Analysis
- Figure 16.15 Tivdak (Seagen / Genmab): Approval Timeline
- Figure 16.16 Tivdak (Seagen / Genmab): Success Protocol Analysis
- Figure 16.17 Trodelvy (Gilead Sciences): Approval Timeline
- Figure 16.18 Trodelvy (Gilead Sciences): Success Protocol Analysis
- Figure 16.19 Zynlonta (ADC Therapeutics): Approval Timeline
- Figure 16.20 Zynlonta (ADC Therapeutics): Success Protocol Analysis
- Figure 16.21 Success Protocol Analysis: Leading Parameters
- Figure 18.1 First in Human Dose Calculation: Dose Escalation using BSA Conversion
- Figure 18.2 Maximum Tolerated Dose (MTD): Relationship between Drug to Antibody Ratio and Highest Non-Severely Toxic Dose (HNSTD)
- Figure 19.1 Antibody Drug Conjugates: Key Manufacturing Steps
- Figure 19.2 Antibody Drug Conjugates: Distribution by Cost involved in Clinical Stage Manufacturing
- Figure 19.3 Antibody Drug Conjugates: Distribution by Cost involved in Clinical Stage Manufacturing (With Licensing Fees)
- Figure 19.4 Antibody Drug Conjugates: Pricing Model Based on Patient Segment
- Figure 20.1 Antibody Drug Conjugates: Manufacturing Steps
- Figure 20.2 Antibody Drug Conjugate Contract Manufacturing Service Providers: Distribution by Scale of Operation
- Figure 20.3 Antibody Drug Conjugate Contract Manufacturing Service Providers: Distribution by Location of Manufacturing Facilities
- Figure 21.1 Advantages of Companion Diagnostics
- Figure 21.2 Failure Rate: Distribution by Type of Drug Class
- Figure 21.3 Companion Diagnostics: Primary Developmental Challenges
- Figure 21.4 Companion Diagnostics for Antibody Therapeutics: Distribution by Target Antigen
- Figure 21.5 Companion Diagnostics for Antibody Therapeutics: Distribution by Type of Cancer
- Figure 21.6 Companion Diagnostics for Antibody Therapeutics: Distribution by Key Players
- Figure 22.1 Antibody Drug Conjugates: SWOT Analysis
- Figure 22.2 Antibody Drug Conjugates SWOT Analysis: Strengths
- Figure 22.3 Antibody Drug Conjugates SWOT Analysis: Weaknesses
- Figure 22.4 Antibody Drug Conjugates SWOT Analysis: Opportunities
- Figure 22.5 Antibody Drug Conjugates SWOT Analysis: Threats
- Figure 23.1 Global Antibody Drug Conjugates Market, till 2035 (USD Billion)
- Figure 23.2 Antibody Drug Conjugates Market: Distribution by Target Disease Indication, Current Year and 2035 (USD Billion)
- Figure 23.3 Antibody Drug Conjugates Market for Breast Cancer, till 2035 (USD Billion)
- Figure 23.4 Antibody Drug Conjugates Market for B-cell Lymphoma, till 2035 (USD Billion)
- Figure 23.5 Antibody Drug Conjugates Market for Lung Cancer, till 2035 (USD Billion)
- Figure 23.6 Antibody Drug Conjugates Market for Multiple Myeloma, till 2035 (USD Billion)
- Figure 23.7 Antibody Drug Conjugates Market for Renal Cancer, till 2035 (USD Billion)
- Figure 23.8 Antibody Drug Conjugates Market for Gastric Cancer, till 2035 (USD Billion)
- Figure 23.9 Antibody Drug Conjugates Market for Cervical Cancer, till 2035 (USD Billion)
- Figure 23.10 Antibody Drug Conjugates Market for Acute Lymphoblastic Leukemia, till 2035 (USD Billion)
- Figure 23.11 Antibody Drug Conjugates Market for Other Target Disease Indications, till 2035 (USD Billion)
- Figure 23.12 Antibody Drug Conjugates Market: Distribution by Therapeutic Area, Current Year and 2035 (USD Billion)
- Figure 23.13 Antibody Drug Conjugates Market for Solid Tumors, till 2035 (USD Billion)
- Figure 23.14 Antibody Drug Conjugates Market for Hematological Cancer, till 2035 (USD Billion)
- Figure 23.15 Antibody Drug Conjugates Market: Distribution by Linker, Current Year and 2035 (USD Billion)
- Figure 23.16 Antibody Drug Conjugates Market for Valine-Citrulline Linker, till 2035 (USD Billion)
- Figure 23.17 Antibody Drug Conjugates Market for Tetrapeptide-based Linker, till 2035 (USD Billion)
- Figure 23.18 Antibody Drug Conjugates Market for Succinimidyl-4-(N-maleimidomethyl) cyclohexane-1-carboxylate Linker, till 2035 (USD Billion)
- Figure 23.19 Antibody Drug Conjugates Market for Maleimide Linker, till 2035 (USD Billion)
- Figure 23.20 Antibody Drug Conjugates Market for Maleimidocaproyl Linker, till 2035 (USD Billion)
- Figure 23.21 Antibody Drug Conjugates Market for Valine-Alanine Linker, till 2035 (USD Billion)
- Figure 23.22 Antibody Drug Conjugates Market for Hydrazone (4-(4-acetylphenoxy) butanoic acid (AcBut) Linker, till 2035 (USD Billion)
- Figure 23.23 Antibody Drug Conjugates Market for Other Linkers, till 2035 (USD Billion)
- Figure 23.24 Antibody Drug Conjugates Market: Distribution by Payload, Current Year and 2035 (USD Billion)
- Figure 23.25 Antibody Drug Conjugates Market for Monomethyl auristatin F (MMAF) Payload, till 2035 (USD Billion)
- Figure 23.26 Antibody Drug Conjugates Market for DM1 Payload, till 2035 (USD Billion)
- Figure 23.27 Antibody Drug Conjugates Market for SN-38 / Irinotecan Payload, till 2035 (USD Billion)
- Figure 23.28 Antibody Drug Conjugates Market for Monomethyl auristatin E (MMAE) Payload, till 2035
- Figure 23.29 Antibody Drug Conjugates Market for Duocarmycin Payload, till 2035 (USD Billion)
- Figure 23.30 Antibody Drug Conjugates Market for SG3199 Payload, till 2035 (USD Billion)
- Figure 23.31 Antibody Drug Conjugates Market for Ozogamicin Payload, till 2035 (USD Billion)
- Figure 23.32 Antibody Drug Conjugates Market for DM4 Payload, till 2035 (USD Billion)
- Figure 23.33 Antibody Drug Conjugates Market for Other Payloads, till 2035 (USD Billion)
- Figure 23.34 Antibody Drug Conjugates Market: Distribution by Target Antigen, Current Year and 2035 (USD Billion)
- Figure 23.35 Antibody Drug Conjugates Market for HER-2 (ERBB2), till 2035 (USD Billion)
- Figure 23.36 Antibody Drug Conjugates Market for CD79b, till 2035 (USD Billion)
- Figure 23.37 Antibody Drug Conjugates Market for TROP-2, till 2035 (USD Billion)
- Figure 23.38 Antibody Drug Conjugates Market for BCMA (TNFRSF17 / BCM), till 2035 (USD Billion)
- Figure 23.39 Antibody Drug Conjugates Market for CD19, till 2035 (USD Billion)
- Figure 23.40 Antibody Drug Conjugates Market for Nectin 4, till 2035 (USD Billion)
- Figure 23.41 Antibody Drug Conjugates Market for Tissue Factor, till 2035 (USD Billion)
- Figure 23.42 Antibody Drug Conjugates Market for CD22, till 2035 (USD Billion)
- Figure 23.43 Antibody Drug Conjugates Market for CD30, till 2035 (USD Billion)
- Figure 23.44 Antibody Drug Conjugates Market for CEACAM5, till 2035 (USD Billion)
- Figure 23.45 Antibody Drug Conjugates Market for Other Target Antigens, till 2035 (USD Billion)
- Figure 23.46 Antibody Drug Conjugates Market: Distribution by Key Geographical Regions, Current Year and 2035 (USD Billion)
- Figure 23.47 Antibody Drug Conjugates Market in North America, till 2035 (USD Billion)
- Figure 23.48 Antibody Drug Conjugates Market in US, till 2035 (USD Billion)
- Figure 23.49 Antibody Drug Conjugates Market in Canada, till 2035 (USD Billion)
- Figure 23.50 Antibody Drug Conjugates Market in Europe, till 2035 (USD Billion)
- Figure 23.51 Antibody Drug Conjugates Market in Germany, till 2035 (USD Billion)
- Figure 23.52 Antibody Drug Conjugates Market in UK, till 2035 (USD Billion)
- Figure 23.53 Antibody Drug Conjugates Market in France, till 2035 (USD Billion)
- Figure 23.54 Antibody Drug Conjugates Market in Italy, till 2035 (USD Billion)
- Figure 23.55 Antibody Drug Conjugates Market in Spain, till 2035 (USD Billion)
- Figure 23.56 Antibody Drug Conjugates Market in Asia-Pacific, till 2035 (USD Billion)
- Figure 23.57 Antibody Drug Conjugates Market in China, till 2035 (USD Billion)
- Figure 23.58 Antibody Drug Conjugates Market in Australia, till 2035 (USD Billion)
- Figure 23.59 Antibody Drug Conjugates Market in Japan, till 2035 (USD Billion)
- Figure 23.60 Adcetris: Sales Forecast, till 2035 (USD Billion)
- Figure 23.61 Aidixi: Sales Forecast, till 2035 (USD Billion)
- Figure 23.62 Besponsa: Sales Forecast, till 2035 (USD Billion)
- Figure 23.63 Blenrep: Sales Forecast, till 2035 (USD Billion)
- Figure 23.64 Elahere: Sales Forecast, till 2035 (USD Billion)
- Figure 23.65 Enhertu: Sales Forecast, till 2035 (USD Billion)
- Figure 23.66 Kadcyla: Sales Forecast, till 2035 (USD Billion)
- Figure 23.67 Padcev: Sales Forecast, till 2035 (USD Billion)
- Figure 23.68 Polivy: Sales Forecast, till 2035 (USD Billion)
- Figure 23.69 Tivdak: Sales Forecast, till 2035 (USD Billion)
- Figure 23.70 Trodelvy: Sales Forecast, till 2035 (USD Billion)
- Figure 23.71 Zynlonta: Sales Forecast, till 2035 (USD Billion)
- Figure 23.72 Datopotamab Deruxtecan: Sales Forecast, till 2035 (USD Billion)
- Figure 23.73 Patritumab Deruxtecan: Sales Forecast, till 2035 (USD Billion)
- Figure 23.74 SHR-A1811: Sales Forecast, till 2035 (USD Billion)
- Figure 23.75 SKB264: Sales Forecast, till 2035 (USD Billion)
- Figure 23.76 TAA013: Sales Forecast, till 2035 (USD Billion)
- Figure 23.77 Telisotuzumab Vedotin: Sales Forecast, till 2035 (USD Billion)
- Figure 23.78 Trastuzumab Duocarmazine: Sales Forecast, till 2035 (USD Billion)
- Figure 23.79 Tusamitamab Ravtansine: Sales Forecast, till 2035 (USD Billion)
- Figure 23.80 Upifitamab Rilsodotin: Sales Forecast, till 2035 (USD Billion)
- Figure 25.1 Concluding Remarks: Market Overview
- Figure 25.2 Concluding Remarks: Clinical Trials Landscape
- Figure 25.3 Concluding Remarks: Partnerships and Collaborations
- Figure 25.4 Concluding Remarks: Funding and Investment Analysis
- Figure 25.5 Concluding Remarks: Patent Analysis
- Figure 25.6 Concluding Remarks: Academic Grants Analysis
- Figure 25.7 Concluding Remarks: Market Sizing and Opportunity Analysis
ANTIBODY DRUG CONJUGATE MARKET: OVERVIEW
As per Roots Analysis, the global antibody drug conjugate market is estimated to grow from USD 7.72 billion in the current year to USD 23.3 billion by 2035, at a CAGR of 9.63% during the forecast period, till 2035.
The market sizing and opportunity analysis has been segmented across the following parameters:
Target Disease Indication
- Breast Cancer
- B-cell Lymphoma
- Lung Cancer
- Multiple Myeloma
- Acute Lymphoblastic Leukemia
- Gastric Cancer
- Renal Cancer
- Cervical Cancer
- Other Target Disease Indications
Therapeutic Area
- Hematological Cancer
- Solid Tumor
Linker
- Valine-Citrulline
- Succinimidyl-4-(N-Maleimidomethyl) Cyclohexane-1-Carboxylate
- Tetrapeptide-based Linker
- Maleimide, Maleimidocaproyl
- Valine-Alanine
- Hydrazone (4-(4-Acetylphenoxy) Butanoic Acid (AcBut)
- Other Linkers
Payload
- Monomethyl Auristatin E
- DM1
- Duocarmycin
- SN-38 / Irinotecan
- Monomethyl Auristatin F
- SG3199
- Ozogamicin
- DM4
- Other Payloads
Target Antigens
- HER-2 (ERBB2)
- CD79b
- Trop-2
- BCMA (TNFRSF17 / BCM)
- CD19
- CD22
- Tissue Factor
- CD30
- CEACAM5
- Nectin 4
- Others
Key Geographical Regions
- North America
- Europe
- Asia-Pacific
ANTIBODY DRUG CONJUGATE MARKET: GROWTH AND TRENDS
Over the years, various technical developments, such as enhanced pharmacokinetic and pharmacodynamic properties and antibody engineering have paved the way for antibody drug conjugates to be considered as a viable therapeutic modality for the treatment of solid tumors and hematological malignancies. Till date, over 280 antibody drug conjugates have been either approved or being investigated in clinical studies, whereas more than 250 candidates are in the early stages of development. Examples of the USFDA approved drugs include Zynlonta, Akalux, Aidixi.
Antibody drug conjugates have emerged as a potential option to selectively eliminate the tumor population, with minimal side effects. Till date, several clinical trials have shown the therapeutic superiority (over conventional cancer treatment options) and efficacy of antibody-drug conjugates. Therefore, the rising population of various oncological disorders is one of the key drivers for the antibody drug conjugate market. Driven by the availability of innovative technology platforms, lucrative funding opportunities and encouraging clinical trial results, the antibody drug conjugates market is poised to grow in the long-run, as multiple product candidates are expected to receive marketing approval in the coming decade.
ANTIBODY DRUG CONJUGATE MARKET: KEY INSIGHTS
The report delves into the current state of the antibody drug conjugate market and identifies potential growth opportunities within the industry. Some key findings from the report include:
- 1. The landscape of ADCs has steadily evolved over the past decade; more than 530 ADC therapy programs are being evaluated by over 140 drug developers, worldwide.
- 2. Currently, 47% of the ADCs are in discovery / preclinical stages of development; of these, close to 160 ADCs utilize auristatin and maytansinoid payloads.
- 3. In order to gain a competitive edge, ADC developers are actively exploring novel targets for the treatment of a wide array of indications.
- 4. Since 2010, 560+ clinical trials have been registered to evaluate the safety and efficacy of various ADCs; majority of these studies have been conducted across various sites in the US.
- 5. Developers have already evaluated more than 190 ADCs in combination with other therapeutic modalities for the treatment of various oncological disorders.
- 6. The growing interest in this field is evident from the rise in partnership activity over the years; in fact, the maximum partnerships, till date, were inked recently.
- 7. Considering the enormous opportunities associated with ADCs for the treatment of cancer, investors have readily extended funds, worth nearly USD 30 billion, in the last decade.
- 8. Several researchers from renowned universities, currently involved in evaluating efficacy and safety of ADCs, have emerged as prominent KOLs.
- 9. Over the years, the intellectual capital related to the therapeutic applications of ADCs has grown at a commendable pace; more than 3,330 patents have been filed by both industry and non-industry players.
- 10. A number of grants, worth over USD 135 million, have been awarded for research activity related to ADCs; nearly 90% of these grants extend a support period of up to 10 years.
- 11. Stakeholders are exploring diverse commercialization strategies across different stages of a drug's launch cycle; for drugs nearing patent expiry, these developers are expected to adopt lifecycle management strategies.
- 12. Presently, around 35 players, across the globe, claim to have the required capabilities to offer contract manufacturing / conjugation services for ADCs; of these, over 10 players claim to be one-stop-shops.
- 13. With a promising developmental pipeline, the global market is anticipated to witness an annualized growth of nearly 10% over the next decade.
ANTIBODY DRUG CONJUGATE MARKET: KEY SEGMENTS
Breast Cancer is Likely to Dominate the Antibody Drug Conjugate Market During the Forecast Period
Based on the target disease indication, the market is segmented into breast cancer, b-cell lymphoma, lung cancer, multiple myeloma, acute lymphoblastic leukemia, gastric cancer, renal cancer, cervical cancer and other target disease indications. Currently, a number of antibody drug conjugates have been approved for the treatment of breast cancer patients. This segment is expected to capture the largest share as more drug candidates receive approvals in the future.
Currently, Solid Tumor Holds Maximum Share within the Antibody Drug Conjugate Market
Based on the therapeutic area, the market is segmented into hematological cancer and solid tumor. It is worth highlighting that antibody drug conjugate market for solid tumor is likely to grow at a relatively higher CAGR, during the forecast period.
Maleimidocaproyl is the Fastest Growing Segment in the Antibody Conjugate Market During the Forecast Period
Based on the type of linker, the market is segmented into valine-citrulline, succinimidyl-4-(n-maleimidomethyl) cyclohexane-1-carboxylate, tetrapeptide-based linker, maleimidocaproyl, valine-alanine, hydrazone (4-(4-acetylphenoxy) butanoic acid (acbut) and other linkers. It is worth highlighting that the current antibody drug conjugate market is dominated by valine-citrulline linkers.
Monomethyl auristatin E (MMAE) Payload is Likely to Dominate the Antibody Drug Conjugate Market During the Forecast Period
Based on the type of payload, the market is segmented into Monomethyl Auristatin E, DM1, Duocarmycin, SN-38 / Irinotecan, Monomethyl Auristatin F, SG3199, Ozogamicin, DM4 and other Payloads. The current market is expected to be driven by MMAE payload used in antibody drug conjugates, followed by DM1; a similar trend is anticipated in the long term.
Currently, HER-2 (ERBB2) Target Antigen Holds the Maximum Share within the Antibody Drug Conjugate Market
Based on the target antigen, the market is segmented into HER-2 (ERBB2), CD79b, Trop-2, BCMA (TNFRSF17 / BCM), CD19, CD22, tissue factor, CD30, CEACAM5, Nectin 4 and others.
The market is expected to be driven by HER-2 (ERBB2) antigen, CD79b target antigen and TROP-2 antigen in mid-long term. It is worth highlighting that the antibody drug conjugate market for tissue factor is likely to grow at a relatively higher CAGR during the forecast period.
North America Accounts for the Largest Share of the Market
Based on key geographical regions, the market is segmented into North America, Europe and Asia-Pacific. Majority share is expected to be captured by drug developers based in North America and Europe. It is worth highlighting that over the years, the market in Asia-Pacific is expected to grow at a higher CAGR.
Example Players in the Antibody Drug Conjugates Market
- ADC Therapeutics
- Astellas Pharma
- AstraZeneca
- Byondis
- Daiichi Sankyo
- Genentech
- Gilead Sciences
- ImmunoGen
- Pfizer
- RemeGen
Primary Research Overview
The opinions and insights presented in this study were influenced by discussions conducted with multiple stakeholders. The research report features detailed transcripts of interviews held with the following industry stakeholders:
- Founder and Chief Executive Officer, Oxford Biotherapeutics
- Founder and Chief Operating Officer, Angiex
- Co-Founder and Chief Executive Officer, Syndivia
- President and Chief Executive Officer, BSP Pharmaceuticals
- Former Chief Executive Officer, PolyTherics (an Abzena company)
- Founder and Chief Executive Officer, CureMeta
- Chief Business Officer and Head of Strategy, CytomX Therapeutics
- Former Chief Business Officer, NBE-Therapeutics
- Chief Commercial Officer, Cerbios-Pharma
- Senior Vice President and Chief Scientific Officer, Eisai
- Chief Business Officer, AbTis
- Former Vice President and Head of Chemistry, AmbrX
- Vice President, Business Development, Synaffix
- Former Director, Pierre Fabre
- Former Group Product Manager, Catalent Pharma Solutions
- Former Head of Bioconjugates Commercial Development, Lonza
- Former Site Head, Piramal Healthcare
- General Manager, Business Development, CDMO Business, Ajinomoto Bio-Pharma Services
- Professor, Cardiff University
ANTIBODY DRUG CONJUGATE MARKET: RESEARCH COVERAGE
- The report features an in-depth analysis of the antibody drug conjugate market, focusing on key market segments, including target disease indication, therapeutic area, linker, payload, target antigens and key geographical regions.
- A comprehensive evaluation of close to 400 antibody drug conjugates / ADC therapeutics that have been either approved or being evaluated in different stages of development, considering various parameters, such as status of development (Approved, Phase III, Phase II, Phase I and Discovery / Preclinical), target disease indication (breast cancer, lung cancer, gastric cancer, ovarian cancer, non-Hodgkin's lymphoma, hepatic cancer, b-cell lymphoma, acute myeloid leukemia, brain cancer and renal cancer), therapeutic area (solid tumors, hematological cancers, autoimmune disorders / inflammatory disorders and others), line of treatment (1st line, >=1st line, 2nd line, >=2nd line, 3rd line, >=3rd line, <=4th line, Last line and others), dosing frequency (q3 weeks, q2 weeks, q1 weeks, q4 weeks, once and q6 weeks), type of therapy (combination therapy and monotherapy), target antigen (HER-2 (ERBB2), Trop-2, EGFR, FOLR1 (folate receptor alpha), CD30, B7-H3 (CD276), Nectin 4 and c-MET), antibody isotype (IgG1, IgG2 and IgG4), payload / cytotoxin / warhead (monomethyl auristatin E (MMAE), DM4, DM1, SG3199, SN-38 / irinotecan, duocarmycin and monomethyl auristatin F (MMAF)), type of payload (auristatin, Maytansinoid, camptothecin, exatecan derivative topoisomerase I inhibitor, pyrrolobenzodiazepine dimer, topoisomerase I inhibitor (unspecified), DNA topoisomerase I inhibitor, Seco-DUBA, calicheamicin (ozogamicin), glucocorticoid and pyrrolobenzodiazepine (PBD)), linkers (valine-citrulline, peptide linker, tetrapeptide-based linker, N-succinimidyl 4-(2-pyridyldithio) -butanoate (SPDB), valine-alanine, succinimidyl-4-(N-maleimidomethyl) cyclohexane-1-carboxylate and maleimide linker) and type of linkers (cleavable and non-cleavable). In addition, it includes information on various antibody drug conjugate developers, based on their year of establishment, company size, location of headquarters and most active players (in terms of number of therapies).
- A comprehensive competitive analysis of biological targets, examining factors, such as number of antibody drug conjugates being developed against them, number of unique target disease indications and number of companies developing antibody-drug conjugates for the target. In addition, it includes a six-dimensional spider-web analysis, featuring the most popular biological targets based on a number of relevant parameters, including number of publications, number of grants received to support research on a particular target, number of companies involved in drug development based on a singular target, highest phase of development for the singular target, number of therapies and number of indications.
- In-depth profiles of key industry players in antibody drug conjugate market, focusing on company overviews, financial information (if available), product portfolio, recent developments, and an informed future outlook.
- Detailed profiles of marketed ADC therapeutics, focusing on overview of the therapy, its mechanism of action, target antigen, linker, payload, type of therapy and details related to sales generated (wherever available).
- Examination of completed, ongoing, and planned clinical studies of various drug conjugates based on several parameters, such as trial registration year, trial status, trial phase, enrolled patient population, type of sponsor / collaborator, target population, study design, most active industry players, and non-industry players (in terms of number of trials) and key geographical regions.
- An in-depth examination that emphasizes the key opinion leaders (KOLs) within this field includes an evaluation of various principal investigators overseeing clinical trials associated with antibody drug conjugates, based on several relevant parameters, such as type of KOL, qualification(s), type of organization, affiliated organization, geographical location of KOLs and target disease indications. In addition, the chapter highlights the most prominent KOLs, based on our proprietary and third-party scoring criteria.
- An assessment of various therapeutics that are being evaluated in combination with antibody-drug conjugates. The study also presents the likely evolution of these therapeutics across different indications.
- An analysis of partnerships established in this sector, since 2014, covering product licensing agreements, technology licensing agreements, research and development agreements, clinical trial agreements, mergers / acquisitions, product development agreements, technology utilization agreements, product development and commercialization agreements, manufacturing agreements, technology integration agreements and others), purpose of partnership (research and development, product development and commercialization, product development, clinical evaluation, portfolio enhancement, product development and manufacturing, manufacturing, research and others.
- A detailed evaluation of the investments made in the ADC domain, encompassing seed financing, venture capital financing, debt financing, grants, capital raised from IPOs and subsequent offerings based on several parameters, such as number of funding instances, amount invested, type of funding, leading companies and investors, and geographical analysis.
- Detailed analysis of various patents filed / granted related to antibody drug conjugates based on type of patent, patent publication year, patent application year, geographical location, type of players, assigned CPC symbol, type of organization, and leading industry / academic players (in terms of size of intellectual property portfolio). It also includes a patent benchmarking analysis and a detailed valuation analysis.
- A comprehensive evaluation of various grants that have been awarded to research institutes engaged in conducting research related to antibody drug conjugates, since 2016, based on various important parameters, such as year of grant award, amount awarded, funding institute center, support period, type of grant application, purpose of grant award, activity code, study section involved, popular NIH departments (based on number of grants awarded), prominent program officers, leading recipient organizations and key regions.
- A detailed analysis of the commercialization strategies employed by different drug developers for their respective products, prior to launch, during / post launch. It also includes a proprietary framework to outline the essential steps and guidelines that companies can follow while developing their marketing strategies.
- An analysis of the key promotional strategies that have been adopted by the developers of marketed products, namely Adcetris, Besponsa, Enhertu, Kadcyla, Mylotarg, Polivy, and Trodelvy.
- Assessment of the success protocol model for the recently approved ADC therapeutics, based on several relevant parameters, such as dosing frequency, drug efficacy, drug exclusivity, fatality rate, geographical reach, intra-class competition, line of treatment, prevalence, price, type of therapy, and existing competition among developers.
- An overview of various conjugation and linker technologies along with the types that are presently being employed in the designing and development of antibody drug conjugates. In addition, it presents a list of the conjugation and linker technologies that are presently being employed in the designing and development of antibody drug conjugates.
- An overview of research aimed at enhancing the analysis of non-clinical data to support first-in-human (FIH) dose selection for antibody drug conjugates. It also examines the various methods employed to estimate FIH doses. Additionally, it highlights potential FIH starting doses and the estimated dose escalations necessary to achieve the maximum tolerated dose (MTD) in humans.
- A comprehensive discussion on the various factors that are likely to influence the pricing of antibody drug conjugate products. This includes an exploration of different models and approaches that pharmaceutical companies may consider while determining the prices of their lead therapy candidates that are likely to be marketed in the near future.
- A case study on manufacturing of antibody drug conjugates, highlighting the key challenges, and a list of contract service providers that are involved in the ADC market.
- A case study on companies offering companion diagnostics that can potentially be used to make treatment related decisions involving antibody-drug conjugates, providing information on the geographical location of key diagnostic developers, affiliated disease biomarkers, assay techniques involved, target indications, the type of sample required (tumor tissue, blood, bone marrow and others) and the drug candidates for which a particular test was developed.
- A SWOT analysis, focusing on key drivers and challenges that are likely to impact the industry's evolution. Further, it includes a Harvey ball analysis, highlighting the relative effect of each SWOT parameter on the overall industry.
KEY QUESTIONS ANSWERED IN THIS REPORT
- How many companies are currently engaged in this market?
- Which are the leading companies in this market?
- What kind of partnership models are commonly adopted by industry stakeholders?
- What are the factors that are likely to influence the evolution of this market?
- What is the current and future market size?
- What is the CAGR of this market?
- How is the current and future market opportunity likely to be distributed across key market segments?
REASONS TO BUY THIS REPORT
- The report provides a comprehensive market analysis, offering detailed revenue projections of the overall market and its specific sub-segments. This information is valuable to both established market leaders and emerging entrants.
- Stakeholders can leverage the report to gain a deeper understanding of the competitive dynamics within the market. By analyzing the competitive landscape, businesses can make informed decisions to optimize their market positioning and develop effective go-to-market strategies.
- The report offers stakeholders a comprehensive overview of the market, including key drivers, barriers, opportunities, and challenges. This information empowers stakeholders to stay abreast of market trends and make data-driven decisions to capitalize on growth prospects.
ADDITIONAL BENEFITS
- Complimentary PPT Insights Packs
- Complimentary Excel Data Packs for all Analytical Modules in the Report
- 10% Free Content Customization
- Detailed Report Walkthrough Session with Research Team
- Free Updated report if the report is 6-12 months old or older
TABLE OF CONTENTS
1.PREFACE
- 1.1. Antibody Drug Conjugate Market Overview
- 1.2. Key Market Insights
- 1.3. Scope of the Report
- 1.4. Research Methodology
- 1.5. Key Questions Answered
- 1.6. Chapter Outlines
2.EXECUTIVE SUMMARY
3.INTRODUCTION
- 3.1.Chapter Overview
- 3.2.Pillars of Cancer Therapy
- 3.3.Overview of Antibody Drug Conjugates
- 3.3.1.History of Antibody Drug Conjugates
- 3.3.2.Difference between Small Molecule Drugs, Monoclonal Antibody Therapies and Antibody Drug Conjugates
- 3.3.3.Components of Antibody Drug Conjugates
- 3.3.3.1.Antibody
- 3.3.3.2.Cytotoxin
- 3.3.3.3.Linker
- 3.3.4.Advantages of Antibody Drug Conjugates Therapeutics over Traditional Therapeutics
- 3.3.5.Pharmacokinetic Properties of Antibody-Drug Conjugates
- 3.3.5.1. Absorption
- 3.3.5.2. Distribution
- 3.3.5.3. Metabolism and Elimination
- 3.4.Concluding Remarks
4. MARKET OVERVIEW
- 4.1.Chapter Overview
- 4.2.Antibody Drug Conjugates: Therapies Pipeline
- 4.2.1.Analysis by Status of Development
- 4.2.2.Analysis by Target Disease Indication
- 4.2.3.Analysis by Therapeutic Area
- 4.2.4.Analysis by Line of Treatment
- 4.2.5.Analysis by Dosing Frequency
- 4.2.6.Analysis by Type of Therapy
- 4.2.7.Analysis by Target Antigen
- 4.2.8.Analysis by Antibody Isotype
- 4.2.9.Analysis by Payload / Cytotoxin / Warhead
- 4.2.10.Analysis by Type of Payload
- 4.2.11.Analysis by Linker
- 4.2.12.Analysis by Type of Linker (Cleavable / Non-Cleavable)
- 4.3.Antibody Drug Conjugate: List of Therapy Developers
- 4.3.1.Analysis by Year of Establishment
- 4.3.2.Analysis by Company Size
- 4.3.3.Analysis by Location of Headquarters
- 4.3.4.Analysis by Company size and Location of Headquarters
- 4.3.5.Most Active Players: Analysis by Number of Therapies
5. TARGET COMPETITIVENESS ANALYSIS
- 5.1.Chapter Overview
- 5.2.Key Parameters
- 5.3.Methodology
- 5.4.Target Competitiveness Analysis: Key Targets of Antibody Drug Conjugates
- 5.4.1.Three-Dimensional Bubble Analysis
- 5.4.1.1.Targets of Approved / Marketed Drugs
- 5.4.1.2.Targets of Phase III Drugs
- 5.4.1.3.Targets of Phase II Drugs
- 5.4.1.4.Targets of Phase I Drugs
- 5.4.1.5.Targets of Pre-Clinical Drugs
- 5.4.2.Six-Dimensional Spider Web Analysis
- 5.4.1.Three-Dimensional Bubble Analysis
6.COMPANY AND DRUG PROFILES
- 6.1.Chapter Overview
- 6.2.ADC Therapeutics
- 6.2.1.Company Overview
- 6.2.2.Financial Information
- 6.2.3.Pipeline Overview
- 6.2.3.1.Zynlonta
- 6.2.4.Recent Developments and Future Outlook
- 6.3.Astellas Pharma
- 6.3.1.Company Overview
- 6.3.2.Financial Information
- 6.3.3.Pipeline Overview
- 6.3.3.1.Padcev
- 6.3.4.Recent Developments and Future Outlook
- 6.4.AstraZeneca
- 6.4.1.Company Overview
- 6.4.2.Financial Information
- 6.4.3.Pipeline Overview
- 6.4.3.1.Enhertu
- 6.4.4.Recent Developments and Future Outlook
- 6.5.Byondis
- 6.5.1.Company Overview
- 6.5.2.Financial Information
- 6.5.2.1.Pipeline Overview
- 6.5.3.Trastuzumab duocarmazine
- 6.5.4.Recent Developments and Future Outlook
- 6.6.Daiichi Sankyo
- 6.6.1.Company Overview
- 6.6.2.Financial Information
- 6.6.3.Pipeline Overview
- 6.6.3.1.Enhertu
- 6.6.4.Recent Developments and Future Outlook
- 6.7.Genentech (Subsidiary of Roche)
- 6.7.1.Company Overview
- 6.7.2.Financial Information
- 6.7.3.Pipeline Overview
- 6.7.3.1.Kadcyla
- 6.7.3.2.Polivy
- 6.7.4.Recent Developments and Future Outlook
- 6.8.Gilead Sciences
- 6.8.1.Company Overview
- 6.8.2.Financial Information
- 6.8.3.Pipeline Overview
- 6.8.3.1.Trodelvy
- 6.8.4.Recent Developments and Future Outlook
- 6.9.ImmunoGen
- 6.9.1.Company Overview
- 6.9.2.Financial Information
- 6.9.3.Pipeline Overview
- 6.9.3.1.Elahere
- 6.9.4.Recent Developments and Future Outlook
- 6.10.Pfizer
- 6.10.1.Company Overview
- 6.10.2.Financial Information
- 6.10.3.Pipeline Overview
- 6.10.3.1.Mylotarg
- 6.10.3.2.Besponsa
- 6.10.4.Recent Developments and Future Outlook
- 6.11.RemeGen
- 6.11.1.Company Overview
- 6.11.2.Financial Information
- 6.11.3.Pipeline Overview
- 6.11.3.1.Disitamab vedotin
- 6.11.4.Recent Developments and Future Outlook
- 6.12.Seagen
- 6.12.1.Company Overview
- 6.12.2.Financial Information
- 6.12.3.Pipeline Overview
- 6.12.3.1.Adcetris
- 6.12.3.2.Padcev
- 6.12.3.3.Tivdak
- 6.12.4.Recent Developments and Future Outlook
7.CLINICAL TRIAL ANALYSIS
- 7.1.Chapter Overview
- 7.2.Scope and Methodology
- 7.3.Antibody Drug Conjugates: Clinical Trial Analysis
- 7.3.1.Analysis by Trial Registration Year
- 7.3.2.Analysis by Trial Status
- 7.3.3.Analysis by Trial Status and Patients Enrolled
- 7.3.4.Analysis by Trial Registration Year and Trial Status
- 7.3.5.Analysis by Trial Registration Year and Patients Enrolled
- 7.3.6.Analysis by Trial Phase
- 7.3.7.Analysis by Trial Phase and Patients Enrolled
- 7.3.8.Analysis by Type of Sponsor / Collaborator
- 7.3.9.Analysis by Target Population
- 7.3.10.Analysis by Study Design
- 7.3.11.Most Active Industry Players: Analysis by Number of Trials
- 7.3.12.Most Active Non-Industry Players: Analysis by Number of Trials
- 7.3.13.Analysis of Clinical Trials by Geography
- 7.3.14.Analysis of Patients Enrolled by Geography
8. KEY OPINION LEADERS
- 8.1.Chapter Overview
- 8.2.Assumption and Key Parameters
- 8.3.Methodology
- 8.4.Antibody Drug Conjugates: Key Opinion Leaders
- 8.4.1.Analysis by Type of KOLs
- 8.4.2.Analysis by Qualification
- 8.4.3.Analysis by Affiliated Organization
- 8.4.4.Analysis by Type of Organization
- 8.4.5.Analysis by Geographical Location of KOLs
- 8.4.6.Most Prominent KOLs: Analysis by KOLs Activeness, Expertise and Strength
- 8.4.7.Most Prominent KOLs: Analysis by RA score
- 8.4.8.Most Prominent KOLs: Comparison of RA Score and Third-Party Score
9.COMBINATION THERAPIES
- 9.1.Chapter Overview
- 9.2.Combination Therapies: History of Development
- 9.3.Combination Therapies: FDA Guidelines
- 9.3.1.Combination of Marketed Drugs
- 9.3.2.Combinations of Marketed Drugs with New Molecular Entities
- 9.3.3.Combination of New Molecular Entities
- 9.4.Combination Therapies: Antibody Drug Conjugates
- 9.4.1.Completed / Ongoing Clinical Studies of Antibody Drug Conjugates
- 9.4.1.1.Analysis by Type of Therapy
- 9.4.2.Completed / Ongoing Clinical Studies of Antibody Drug Conjugate-based Combination Therapies
- 9.4.2.1.Analysis by Phase of Development
- 9.4.2.2.Analysis by Trial Status
- 9.4.2.3.Analysis by Target Disease Indication
- 9.4.2.4.Most Popular Antibody Drug Conjugates Used in Combination Therapies: Analysis by Number of Trials
- 9.4.2.5.Most Popular Drug Class Used in Combination Therapies: Analysis by Number of Trials
- 9.4.2.6.Analysis by Target Disease Indication and Drug Class Used in Antibody Drug Conjugate-based Combination Therapies
- 9.4.1.Completed / Ongoing Clinical Studies of Antibody Drug Conjugates
10. PARTNERSHIPS AND COLLABORATIONS
- 10.1.Chapter Overview
- 10.2.Partnership Models
- 10.3.Antibody Drug Conjugates: List of Partnerships and Collaborations
- 10.3.1.Analysis by Year of Partnership
- 10.3.2.Analysis by Type of Partnership
- 10.3.3.Analysis by Year and Type of Partnership
- 10.3.4.Analysis by Purpose of Partnership
- 10.3.5.Analysis by Type of Partner
- 10.3.6.Most Active Players: Analysis by Number of Partnerships
- 10.3.7.Analysis by Geography
- 10.3.7.1.International and Local Agreements
- 10.3.7.2.Intercontinental and Intracontinental Agreements
11.FUNDING AND INVESTMENT ANALYSIS
- 11.1.Chapter Overview
- 11.2.Types of Funding
- 11.3.Antibody Drug Conjugates: List of Funding and Investment Analysis
- 11.3.1.Analysis by Year of Funding
- 11.3.2.Analysis by Amount Invested
- 11.3.3.Analysis by Type of Funding
- 11.3.4.Analysis by Year and Type of Funding
- 11.3.5.Analysis by Type of Investor
- 11.3.6.Analysis by Amount Invested by Geography
- 11.3.6.1.Analysis by Region
- 11.3.6.2.Analysis by Country
- 11.3.7. Most Active Players: Analysis by Number of Funding Instances
- 11.3.8. Most Active Players: Analysis by Amount Invested
- 11.3.9. Key Investors: Analysis by Number of Funding Instances
12.PATENT ANALYSIS
- 12.1.Chapter Overview
- 12.2.Scope and Methodology
- 12.3.Antibody Drug Conjugates: Patent Analysis
- 12.3.1.Analysis by Patent Publication Year
- 12.3.2.Analysis by Patent Application Year
- 12.3.3.Analysis by Annual Number of Granted Patents and Patent Applications
- 12.3.4.Analysis by Patent Jurisdiction
- 12.3.5.Analysis by CPC Symbols
- 12.3.6.Analysis by Type of Applicant
- 12.3.7.Leading Industry Players: Analysis by Number of Patents
- 12.3.8.Leading Non-Industry Players: Analysis by Number of Patents
- 12.3.9.Leading Individual Assignees: Analysis by Number of Patents
- 12.4.Antibody Drug Conjugate: Patent Benchmarking Analysis
- 12.4.1.Analysis by Patent Characteristics
- 12.5.Antibody Drug Conjugate: Patent Valuation
- 12.6.Leading Patents by Number of Citations
13.ACADEMIC GRANTS ANALYSIS
- 13.1.Chapter Overview
- 13.2.Scope and Methodology
- 13.3.Antibody Drug Conjugates: Grants Analysis
- 13.3.1.Analysis by Year of Grant Award
- 13.3.2.Analysis by Amount Awarded
- 13.3.3.Analysis by Funding Institute
- 13.3.4.Analysis by Support Period
- 13.3.5.Analysis by Type of Grant Application
- 13.3.6.Analysis by Purpose of Grant Award
- 13.3.7.Analysis by Activity Code
- 13.3.8.Analysis by Study Section Involved
- 13.3.9.Popular NIH Departments: Analysis by Number of Grants
- 13.3.9.1.Prominent Program Officers: Analysis by Number of Grants
- 13.3.9.2.Popular Recipient Organizations: Analysis by Number of Grants
- 13.3.9.3.Popular Recipient Organizations: Analysis by Grant Amount
- 13.3.10. Analysis by Region of Recipient Organization
14.KEY COMMMERCIALIZATION STRATEGIES
- 14.1.Chapter Overview
- 14.2.Successful Drug Launch Strategy: ROOTS Framework
- 14.3.Successful Drug Launch Strategy: Product Differentiation
- 14.4.Common Commercialization Strategies Adopted Across Different Stages of Product Development
- 14.5.Key Commercialization Strategies Adopted by the Companies Focused on Antibody Drug Conjugates
- 14.5.1.Participation in the Global Events
- 14.5.2.Collaboration with External Stakeholders and Pharmaceuticals Firms
- 14.5.3.Geographical Expansion
- 14.5.4.Awareness Through Product Website
- 14.6.Concluding Remarks
15.PROMOTIONAL ANALYSIS
- 15.1.Chapter Overview
- 15.2.Channels Used for Promotional Campaigns
- 15.3.Summary of Product Website
- 15.4.Summary of Patient Support Services and Informative Downloads
- 15.5.Adcetris: Promotional Analysis
- 15.5.1.Drug Overview
- 15.5.2.Product Website Analysis
- 15.5.2.1.Message for Healthcare Professional
- 15.5.2.2.Message for Patients
- 15.5.2.3.Informative Downloads
- 15.5.2.4.Patient Support Services
- 15.6.Besponsa: Promotional Analysis
- 15.6.1.Drug Overview
- 15.6.2.Product Website Analysis
- 15.6.2.1.Message for Healthcare Professional
- 15.6.2.2.Message for Patients
- 15.6.2.3.Informative Downloads
- 15.6.2.4.Patient Support Services
- 15.7.Enhertu: Promotional Analysis
- 15.7.1.Drug Overview
- 15.7.2.Product Website Analysis
- 15.7.2.1.Message for Healthcare Professional
- 15.7.2.2.Message for Patients
- 15.7.2.3.Informative Downloads
- 15.7.2.4.Patient Support Services
- 15.8.Kadcyla: Promotional Analysis
- 15.8.1.Drug Overview
- 15.8.2.Product Website Analysis
- 15.8.2.1.Message for Healthcare Professional
- 15.8.2.2.Message for patients
- 15.8.2.3.Informative Downloads
- 15.8.2.4.Patient Support Services
- 15.9.Mylotarg: Promotional Analysis
- 15.9.1.Drug Overview
- 15.9.2.Product Website Analysis
- 15.9.2.1.Message for Healthcare Professional
- 15.9.2.2.Message for patients
- 15.9.2.3.Informative Downloads
- 15.9.2.4.Patient Support Services
- 15.10.Polivy: Promotional Analysis
- 15.10.1.Drug Overview
- 15.10.2.Product Website Analysis
- 15.10.2.1.Message for Healthcare Professional
- 15.10.2.2.Message for Patients
- 15.10.2.3.Informative Downloads
- 15.10.2.4.Patient Support Services
- 15.11.Trodelvy: Promotional Analysis
- 15.11.1.Drug Overview
- 15.11.2.Product Website Analysis
- 15.11.2.1.Message for Healthcare Professional
- 15.11.2.2.Message for Patients
- 15.11.2.3.Informative Downloads
- 15.11.2.4.Patient Support Services
16.SUCCESS PROTOCOL ANALYSIS
- 16.1.Chapter Overview
- 16.2.Antibody Drug Conjugates: Success Protocol Analysis
- 16.3.Adcetris (Seagen / Takeda Oncology)
- 16.3.1.Overview
- 16.3.2.Approval Timeline
- 16.3.3.Success Protocol Analysis
- 16.4.Aidixi (RemeGen)
- 16.4.1.Overview
- 16.4.2.Approval Timeline
- 16.4.3.Success Protocol Analysis
- 16.5.Akalux (Rakuten Medical)
- 16.5.1.Overview
- 16.5.2.Approval Timeline
- 16.5.3.Success Protocol Analysis
- 16.6.Besponsa (Pfizer / UCB)
- 16.6.1.Overview
- 16.6.2.Approval Timeline
- 16.6.3.Success Protocol Analysis
- 16.7.Blenrep (GlaxoSmithKline)
- 16.7.1.Overview
- 16.7.2.Approval Timeline
- 16.7.3.Success Protocol Analysis
- 16.8.Elahere (ImmunoGen)
- 16.8.1.Overview
- 16.8.2.Approval Timeline
- 16.8.3.Success Protocol Analysis
- 16.9.Enhertu (Daiichi Sankyo / AstraZeneca)
- 16.9.1.Overview
- 16.9.2.Approval Timeline
- 16.9.3.Success Protocol Analysis
- 16.10.Kadcyla (Genentech / ImmunoGen)
- 16.10.1.Overview
- 16.10.2.Approval Timeline
- 16.10.3.Success Protocol Analysis
- 16.11.Padcev (Seagen / Astellas Pharma)
- 16.11.1.Overview
- 16.11.2.Approval Timeline
- 16.11.3.Success Protocol Analysis
- 16.12.Polivy (Genentech)
- 16.12.1.Overview
- 16.12.2. Approval Timeline
- 16.12.3. Success Protocol Analysis
- 16.13.Tivdak (Seagen / Genmab)
- 16.13.1.Overview
- 16.13.2.Approval Timeline
- 16.13.3.Success Protocol Analysis
- 16.14.Trodelvy (Gilead Sciences)
- 16.14.1.Overview
- 16.14.2.Approval Timeline
- 16.14.3.Success Protocol Analysis
- 16.15. Zynlonta (ADC Therapeutics)
- 16.15.1.Overview
- 16.15.2.Approval Timeline
- 16.15.3.Success Protocol Analysis
- 16.16.Concluding Remarks
17. NOVEL CONJUGATION AND LINKER TECHNOLOGY PLATFORMS
- 17.1.Chapter Overview
- 17.2.Antibody Drug Conjugates: Conjugation Technologies
- 17.2.1.Chemical Conjugation
- 17.2.2.Enzymatic Conjugation
- 17.3.Antibody Drug Conjugates: List of Conjugation Technologies
- 17.4.Antibody Drug Conjugates: Linker Technologies
- 17.4.1.Non-cleavable Linkers
- 17.4.2.Cleavable Linker
- 17.5.Antibody Drug Conjugates: List of Linker and Linker-Payload Technologies
- 17.6.Concluding Remarks
18.ASSESSMENT OF NON-CLINICAL DATA FIRST IN HUMAN DOSING
- 18.1.Chapter Overview
- 18.2.Antibody Drug Conjugates: Non-Clinical Studies
- 18.3.ICH S9 Guidelines
- 18.4.Investigational New Drug (IND)-Enabling Study Designs
- 18.4.1.Example Case: Kadcyla
- 18.5.Toxicities in Animal Models
- 18.6.Prediction of Maximum Tolerated Dosage (MTD) in Humans
- 18.7.Other Key Considerations for Study Design
19.COST PRICE ANALYSIS
- 19.1.Chapter Overview
- 19.2.Factors Contributing Towards the High Price of Antibody-Drug Conjugates
- 19.3.Antibody Drug Conjugates Market: Cost Price Analysis
- 19.3.1.On the Basis of Associated Costs
- 19.3.2.On the Basis of Competition
- 19.3.3.On the Basis of Patient Segment
- 19.4.Reimbursement Considerations for Antibody-Drug Conjugates
20.CASE STUDY 1: CONTRACT MANUFACTURING OF ANTIBODY-DRUG CONJUGATES
- 20.1.Chapter Overview
- 20.2.Key Steps in Antibody Drug Conjugate Manufacturing Process
- 20.3.Technical Challenges Related to Antibody Drug Conjugate Manufacturing
- 20.4.Challenges Associated with Supply Chain and Method Transfer
- 20.5.Limitations of In-House Manufacturing
- 20.6.Investments in Antibody Drug Conjugate Manufacturing Capability Expansions
- 20.7.Collaborations Established for Antibody-Drug Conjugate Manufacturing
- 20.8.Growing Demand for Antibody-Drug Conjugate Contract Manufacturing
- 20.9.CMOs with Linker Manufacturing Capabilities
- 20.10.CMOs with HPAPI / Cytotoxic Payload Manufacturing Capabilities
- 20.11.CMOs with Conjugation Capabilities
- 20.12.Antibody Drug Conjugate One-Stop-Shops
- 20.13.Increasing Demand for One-Stop-Shops
21.CASE STUDY 2: COMPANION DIAGNOSTICS FOR ANTIBODY DRUG CONJUGATES THERAPEUTICS
- 21.1.Chapter Overview
- 21.1.1.Advantages of Companion Diagnostics
- 21.1.2.Challenges Associated with the Development of Companion Diagnostics
- 21.2. Companion Diagnostics for Antibody Drug Conjugates
- 21.3.Companion Diagnostics For Antibody Therapeutics
- 21.3.1.Analysis by Target Antigen
- 21.3.2.Analysis by Type of Cancer
- 21.4.Most Prominent Players: Analysis by Number of Tests
22.SWOT ANALYSIS
- 22.1.Chapter Overview
- 22.2.Strengths
- 22.2.1.Improved Safety and Patient Adherence
- 22.2.2.Rise of Next-Generation Conjugation Technologies
- 22.2.3.Robust Pipeline with Multiple Late Stage Product Candidates
- 22.2.4.Growing Involvement of Academic Institutes
- 22.3.Weaknesses
- 22.3.1.Technical Complexities Associated with Product Development
- 22.3.2.Manufacturing, Logistics and Supply Chain Challenges
- 22.3.3.Batch to Batch Inconsistencies
- 22.4.Opportunities
- 22.4.1.Increasing Collaborations and VC Funding
- 22.4.2.Widening Therapeutics Reach
- 22.4.3.Life Cycle Management
- 22.4.4.Combination Therapies
- 22.4.5.Opportunities for CMOs
- 22.5.Threats
- 22.5.1.Failure of Clinical / Marketed Candidates
- 22.5.2.Increased Competition from Other Therapeutic Classes
23. MARKET FORECAST AND OPPORTUNITY ANALYSIS
- 23.1.Chapter Overview
- 23.2.Forecast Methodology and Key Assumptions
- 23.3.Global Antibody Drug Conjugates Market, till 2035
- 23.3.1.Global Antibody Drug Conjugates Market: Distribution by Target Disease Indication, 2023 and 2035
- 23.3.1.1.Antibody Drug Conjugates Market for Breast Cancer, till 2035
- 23.3.1.2.Antibody Drug Conjugates Market for B-cell Lymphoma, till 2035
- 23.3.1.3.Antibody Drug Conjugates Market for Lung Cancer, till 2035
- 23.3.1.4.Antibody Drug Conjugates Market for Multiple Myeloma, till 2035
- 23.3.1.5.Antibody Drug Conjugates Market for Renal Cancer, till 2035
- 23.3.1.6.Antibody Drug Conjugates Market for Gastric Cancer, till 2035
- 23.3.1.7.Antibody Drug Conjugates Market for Cervical Cancer, till 2035
- 23.3.1.8.Antibody Drug Conjugates Market for Acute Lymphoblastic Leukemia, till 2035
- 23.3.1.9.Antibody Drug Conjugates Market for Other Disease Indications, till 2035
- 23.3.2.Antibody Drug Conjugates Market: Distribution by Therapeutic Area, Current Year and 2035
- 23.3.2.1.Antibody Drug Conjugates Market for Solid Tumors, till 2035
- 23.3.2.2.Antibody Drug Conjugates Market for Hematological Cancer, till 2035
- 23.3.3.Global Antibody Drug Conjugates Market: Distribution by Linker, 2023 and 2035
- 23.3.3.1.Antibody Drug Conjugates Market for Valine-Citrulline Linker, till 2035
- 23.3.3.2.Antibody Drug Conjugates Market for Tetrapeptide-Based Linker, till 2035
- 23.3.3.3.Antibody Drug Conjugates Market for Succinimidyl-4-(N-maleimidomethyl) cyclohexane-1-carboxylate Linker, till 2035
- 23.3.3.4.Antibody Drug Conjugates Market for Maleimide Linker, till 2035
- 23.3.3.5.Antibody Drug Conjugates Market for Maleimidocaproyl Linker, till 2035
- 23.3.3.6.Antibody Drug Conjugates Market for Valine-Alanine Linker, till 2035
- 23.3.3.7.Antibody Drug Conjugates Market for Hydrazone (4-(4-acetylphenoxy) butanoic acid (AcBut) Linker, till 2035
- 23.3.3.8.Antibody Drug Conjugates Market for Other Linkers, till 2035
- 23.3.4.Antibody Drug Conjugates Market: Distribution by Type of Payload, Current Year and 2035
- 23.3.4.1.Antibody Drug Conjugates Market for Monomethyl Auristatin E Payloads, till 2035
- 23.3.4.2.Antibody Drug Conjugates Market for DM1 Payloads, till 2035
- 23.3.4.3.Antibody Drug Conjugates Market for SN-38 / Irinotecan Payloads, till 2035
- 23.3.4.4.Antibody Drug Conjugates Market for Monomethyl Auristatin F Payloads, till 2035
- 23.3.4.5.Antibody Drug Conjugates Market for Duocarmycin Payloads, till 2035
- 23.3.4.6.Antibody Drug Conjugates Market for SG3199 Payloads, till 2035
- 23.3.4.7.Antibody Drug Conjugates Market for Ozogamicin Payloads, till 2035
- 23.3.4.8.Antibody Drug Conjugates Market for DM4 Payloads, till 2035
- 23.3.4.9.Antibody Drug Conjugates Market for Other Payloads, till 2035
- 23.3.5.Global Antibody Drug Conjugates Market: Distribution by Target Antigen, Current Year and 2035
- 23.3.5.1.Antibody Drug Conjugates Market for HER-2 (ERBB2), till 2035
- 23.3.5.2.Antibody Drug Conjugates Market for CD79b, till 2035
- 23.3.5.3.Antibody Drug Conjugates Market for TROP-2, till 2035
- 23.3.5.4.Antibody Drug Conjugates Market for BCMA (TNFRSF17 / BCM), till 2035
- 23.3.5.5.Antibody Drug Conjugates Market for CD19, till 2035
- 23.3.5.6.Antibody Drug Conjugates Market for Nectin 4, till 2035
- 23.3.5.7.Antibody Drug Conjugates Market for Tissue Factor, till 2035
- 23.3.5.8.Antibody Drug Conjugates Market for CD22, till 2035
- 23.3.5.9.Antibody Drug Conjugates Market for CD30, till 2035
- 23.3.5.10.Antibody Drug Conjugates Market for CEACAM5, till 2035
- 23.3.5.11.Antibody Drug Conjugates Market for Other Target Antigens, till 2035
- 23.3.6.Antibody Drug Conjugates Market: Distribution by Geographical Regions, Current Year and 2035
- 23.3.6.1.Antibody Drug Conjugates Market in North America, till 2035
- 23.3.6.1.1.Antibody Drug Conjugates Market in US, till 2035
- 23.3.6.1.2.Antibody Drug Conjugates Market in Canada, till 2035
- 23.3.6.2.Antibody Drug Conjugates Market in Europe, till 2035
- 23.3.6.2.1.Antibody Drug Conjugates Market in Germany, till 2035
- 23.3.6.2.2.Antibody Drug Conjugates Market in UK, till 2035
- 23.3.6.2.3.Antibody Drug Conjugates Market in France, till 2035
- 23.3.6.2.4.Antibody Drug Conjugates Market in Italy, till 2035
- 23.3.6.2.5.Antibody Drug Conjugates Market in Spain, till 2035
- 23.3.6.3.Antibody Drug Conjugates Market in Asia-Pacific, till 2035
- 23.3.6.3.1.Antibody Drug Conjugates Market in China, till 2035
- 23.3.6.3.2.Antibody Drug Conjugates Market in Australia, till 2035
- 23.3.6.3.3.Antibody Drug Conjugates Market in Japan, till 2035
- 23.3.6.1.Antibody Drug Conjugates Market in North America, till 2035
- 23.3.1.Global Antibody Drug Conjugates Market: Distribution by Target Disease Indication, 2023 and 2035
- 23.4.Antibody Drug Conjugates Market: Product-wise Sales Forecast, till 2035
- 23.4.1.Adcetris
- 23.4.1.1.Sales Forecast (USD Billion)
- 23.4.1.2.Net Present Value (USD Billion)
- 23.4.1.3.Value Creation Analysis
- 23.4.2.Aidixi
- 23.4.2.1.Sales Forecast (USD Billion)
- 23.4.2.2.Net Present Value (USD Billion)
- 23.4.2.3.Value Creation Analysis
- 23.4.3.Besponsa
- 23.4.3.1.Sales Forecast (USD Billion)
- 23.4.3.2.Net Present Value (USD Billion)
- 23.4.3.3.Value Creation Analysis
- 23.4.4.Blenrep
- 23.4.4.1.Sales Forecast (USD Billion)
- 23.4.4.2.Net Present Value (USD Billion)
- 23.4.4.3.Value Creation Analysis
- 23.4.5.Elahere
- 23.4.5.1.Sales Forecast (USD Billion)
- 23.4.5.2.Net Present Value (USD Billion)
- 23.4.5.3.Value Creation Analysis
- 23.4.6.Enhertu
- 23.4.6.1.Sales Forecast (USD Billion)
- 23.4.6.2.Net Present Value (USD Billion)
- 23.4.6.3.Value Creation Analysis
- 23.4.7.Kadcyla
- 23.4.7.1.Sales Forecast (USD Billion)
- 23.4.7.2.Net Present Value (USD Billion)
- 23.4.7.3.Value Creation Analysis
- 23.4.8.Padcev
- 23.4.8.1.Sales Forecast (USD Billion)
- 23.4.8.2.Net Present Value (USD Billion)
- 23.4.8.3.Value Creation Analysis
- 23.4.9.Polivy
- 23.4.9.1.Sales Forecast (USD Billion)
- 23.4.9.2.Net Present Value (USD Billion)
- 23.4.9.3.Value Creation Analysis
- 23.4.10. Tivdak
- 23.4.10.1.Sales Forecast (USD Billion)
- 23.4.10.2.Net Present Value (USD Billion)
- 23.4.10.3.Value Creation Analysis
- 23.4.11. Trodelvy
- 23.4.11.1.Sales Forecast (USD Billion)
- 23.4.11.2.Net Present Value (USD Billion)
- 23.4.11.3.Value Creation Analysis
- 23.4.12. Zynlonta
- 23.4.12.1.Sales Forecast (USD Billion)
- 23.4.12.2.Net Present Value (USD Billion)
- 23.4.12.3.Value Creation Analysis
- 23.4.13. Datopotamab Deruxtecan
- 23.4.13.1.Sales Forecast (USD Billion)
- 23.4.13.2.Net Present Value (USD Billion)
- 23.4.13.3.Value Creation Analysis
- 23.4.14. Patritumab Deruxtecan
- 23.4.14.1.Sales Forecast (USD Billion)
- 23.4.14.2.Net Present Value (USD Billion)
- 23.4.14.3.Value Creation Analysis
- 23.4.15. SHR-A1811
- 23.4.15.1.Sales Forecast (USD Billion)
- 23.4.15.2.Net Present Value (USD Billion)
- 23.4.15.3.Value Creation Analysis
- 23.4.16. SKB264
- 23.4.16.1.Sales Forecast (USD Billion)
- 23.4.16.2.Net Present Value (USD Billion)
- 23.4.16.3.Value Creation Analysis
- 23.4.17. TAA013
- 23.4.17.1.Sales Forecast (USD Billion)
- 23.4.17.2.Net Present Value (USD Billion)
- 23.4.17.3.Value Creation Analysis
- 23.4.18. Telisotuzumab Vedotin
- 23.4.18.1.Sales Forecast (USD Billion)
- 23.4.18.2.Net Present Value (USD Billion)
- 23.4.18.3.Value Creation Analysis
- 23.4.19. Trastuzumab Duocarmazine
- 23.4.19.1.Sales Forecast (USD Billion)
- 23.4.19.2.Net Present Value (USD Billion)
- 23.4.19.3.Value Creation Analysis
- 23.4.20. Tusamitamab Ravtansine
- 23.4.20.1.Sales Forecast (USD Billion)
- 23.4.20.2.Net Present Value (USD Billion)
- 23.4.20.3.Value Creation Analysis
- 23.4.21. Upifitamab Rilsodotin
- 23.4.21.1.Sales Forecast (USD Billion)
- 23.4.21.2.Net Present Value (USD Billion)
- 23.4.21.3.Value Creation Analysis
- 23.4.1.Adcetris
24.EXECUTIVE INSIGHTS
- 24.1.Chapter Overview
- 24.2.Oxford Biotherapeutics
- 24.2.1.Company Snapshot
- 24.2.2.Interview Transcript: Christian Rohlff, Founder and Chief Executive Officer
- 24.3.Angiex
- 24.3.1.Company Snapshot
- 24.3.2.Interview Transcript: Paul Jaminet, Founder and Chief Operating Officer
- 24.4.Syndivia
- 24.4.1.Company Snapshot
- 24.4.2.Interview Transcript: Sasha Koniev, Co-Founder and Chief Executive Officer
- 24.5.BSP Pharmaceuticals
- 24.5.1.Company Snapshot
- 24.5.2.Interview Transcript: Aldo Braca, President and Chief Executive Officer and Giorgio Salciarini, Technical Business Development Senior Manager
- 24.6.PolyTherics (an Abzena company)
- 24.6.1.Company Snapshot
- 24.6.2.Interview Transcript: John Burt, Former Chief Executive Officer
- 24.7.CureMeta
- 24.7.1.Company Snapshot
- 24.7.2.Interview Transcript: Michael Schopperle, Founder and Chief Executive Officer
- 24.8.CytomX Therapeutics
- 24.8.1.Company Snapshot
- 24.8.2.Interview Transcript: Jeff Landau, Chief Business Officer and Head of Strategy
- 24.9.NBE-Therapeutics
- 24.9.1.Company Snapshot
- 24.9.2.Interview Transcript: Wouter Verhoeven, Former Chief Business Officer
- 24.10.Cerbios-Pharma
- 24.10.1. Company Snapshot
- 24.10.2. Interview Transcript: Denis Angioletti, Chief Commercial Officer
- 24.11.Eisai
- 24.11.1. Company Snapshot
- 24.11.2. Interview Transcript: Toshimitsu Uenaka, President and Takashi Owa, Senior Vice President and Chief Scientific Officer
- 24.12.AbTis
- 24.12.1. Company Snapshot
- 24.12.2. Interview Transcript: Justin Oh, Chief Business Officer
- 24.13.AmbrX
- 24.13.1. Company Snapshot
- 24.13.2. Interview Transcript: Sukumar Sakamuri, Former Vice President and Head of Chemistry
- 24.14.Synaffix
- 24.14.1. Company Snapshot
- 24.14.2. Interview Transcript: Anthony DeBoer, Vice President, Business Development
- 24.15.Pierre Fabre
- 24.15.1. Company Snapshot
- 24.15.2. Interview Transcript: Christian Bailly, Former Director
- 24.16.Catalent Pharma Solutions
- 24.16.1. Company Snapshot
- 24.16.2. Interview Transcript: Jennifer L. Mitcham, Former Director, SMARTag ADCs and Bioconjugates and Stacy McDonald, Former Group Product Manager
- 24.17.Lonza
- 24.17.1. Company Snapshot
- 24.17.2. Interview Transcript: Laurent Ducry, Former Head of Bioconjugates Commercial Development
- 24.18.Piramal Healthcare
- 24.18.1. Company Snapshot
- 24.18.2. Interview Transcript: Mark Wright, Former Site Head
- 24.19.Ajinomoto Bio-Pharma Services
- 24.19.1. Company Snapshot
- 24.19.2. Interview Transcript: Tatsuya Okuzumi, General Manager, Business Development, CDMO Business
- 24.20.Cardiff University
- 24.20.1. Company Snapshot
- 24.20.2. Interview Transcript: Alan Burnett, Professor, School of Medicine
- 24.21.Anonymous, Director, Business Development, Leading CMO
- 24.22.Anonymous, Chief Executive Officer, Leading CMO
