
|
市場調査レポート
商品コード
1787843
6Gの世界市場(~2035年):コンポーネントタイプ別、通信インフラタイプ別、用途タイプ別、エンドユーザタイプ別、地域別、産業動向、予測6G Market, Till 2035: Distribution by Type of Component, Type of Communication Infrastructure, Type of Application, Type of End User, and Geographical Regions: Industry Trends and Global Forecasts |
||||||
カスタマイズ可能
|
|||||||
| 6Gの世界市場(~2035年):コンポーネントタイプ別、通信インフラタイプ別、用途タイプ別、エンドユーザタイプ別、地域別、産業動向、予測 |
|
出版日: 2025年08月11日
発行: Roots Analysis
ページ情報: 英文 172 Pages
納期: 7~10営業日
|

全表示
- 概要
- 目次
6G市場の概要
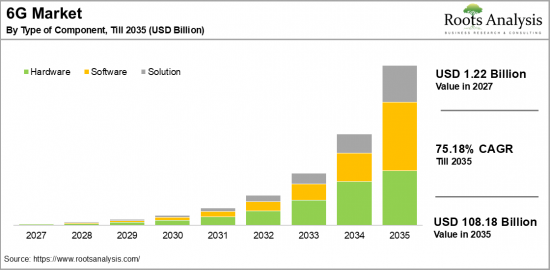
世界の6Gの市場規模は、2027年の12億2,000万米ドルから2035年までに1,081億8,000万米ドルに達すると予測され、2035年までの予測期間にCAGRで75.18%の成長が見込まれます。
6G市場:成長と動向
1990年代の2Gの開始から2019年の5Gサービスの開始まで、世界の導入が進むにつれて通信部門は大きく変化しており、6G技術は無線通信情勢に革命をもたらすと予測されています。6G、つまり第6世代無線技術は、これまで使われていなかった無線周波数で運用されるセルラーネットワークを表し、AIに似たコグニティブ技術を採用しています。この技術革新は、5Gネットワークと比較して、より速い速度、通信の待ち時間の短縮、より信頼性の高い接続性を約束します。現在、6Gネットワークはまだ模索の初期段階にあり、まだ展開されていません。しかし、AR、VR、ホログラフィック通信などの先進の用途をサポートするように設計されています。
5Gと6Gネットワークの主な違いは、無線スペクトラムの利用の強化、AIの組み込み、機械学習によるエアインターフェース、信頼性とデータ転送速度を高める洗練されたアンテナ設計にあります。6Gの際立った特徴は、5Gの最大100倍の速度を実現し、待ち時間をほぼなくす可能性があることで、このことが世界の6G市場の成長を加速させています。加えて、通信部門で進行中の技術革新と、デバイス、個人、ネットワークが流動的に相互作用できるスマート接続性に対する需要の増加です。
6G技術はM2M通信をサポートし、スマートシティのインフラなどのさまざまな部門に恩恵をもたらすと予測されます。IoTやスマートシティに対する6Gの影響は、リアルタイムのデータ処理能力によって大幅に強化され、公共安全を強化し、資源管理を向上させます。さらに、6G技術を活用した医療用途は、遠隔医療や遠隔患者モニタリングの大幅な進歩をもたらし、最終的に健康転帰の向上につながると予測されています。同様に、この技術は次世代接続規格をサポートすることでコンシューマーエレクトロニクスを強化し、よりリッチなマルチメディア体験とよりスマートなデバイスインタラクションを可能にします。
結果として、ステークホルダーは有利な機会を生かすため、6Gネットワークの開発にますます投資を向けています。上記の要因から、6G市場は予測期間に安定したペースで増大する見込みです。
当レポートでは、世界の6G市場について調査分析し、市場規模の推計と機会の分析、競合情勢、企業プロファイル、メガトレンドなどの情報を提供しています。
目次
セクション1 レポートの概要
第1章 序文
第2章 調査手法
第3章 市場力学
第4章 マクロ経済指標
セクション2 定性的な知見
第5章 エグゼクティブサマリー
第6章 イントロダクション
第7章 規制シナリオ
セクション3 市場の概要
第8章 主要企業の包括的なデータベース
第9章 競合情勢
第10章 ホワイトスペース分析
第11章 企業の競争力の分析
第12章 6G市場におけるスタートアップエコシステム
セクション4 企業プロファイル
第13章 企業プロファイル
- 章の概要
- Airtel
- AT&T
- China Mobile
- China Unicorn
- Ciena
- Deepsig
- Deutsche Telekom
- Ericsson
- Hewlett Packard Enterprise
- Jio
- KDDI
- KT
- MediaTek
- National Instruments
- NTT DoCoMo
- Orange
- Qualcomm
- Rakuten Mobile
- Singtel
- SK Telecom
- Telefonica
- T-Mobile
- Verizon
- Vodafone
セクション5 市場動向
第14章 メガトレンドの分析
第15章 アンメットニーズの分析
第16章 特許分析
第17章 近年の発展
セクション6 市場機会の分析
第18章 世界の6G市場
第19章 市場機会:コンポーネントタイプ別
第20章 市場機会:通信インフラタイプ別
第21章 市場機会:用途タイプ別
第22章 市場機会:エンドユーザータイプ別
第23章 北米の6G市場の機会
第24章 欧州の6G市場の機会
第25章 アジアの6G市場の機会
第26章 中東・北アフリカ(MENA)の6G市場の機会
第27章 ラテンアメリカの6G市場の機会
第28章 その他の地域の6G市場の機会
第29章 市場集中分析:主要企業別
第30章 隣接市場の分析
セクション7 戦略ツール
第31章 勝利の鍵となる戦略
第32章 ポーターのファイブフォース分析
第33章 SWOT分析
第34章 バリューチェーン分析
第35章 Rootsの戦略的提言
セクション8 その他の独占的知見
第36章 1次調査からの知見
第37章 レポートの結論
セクション9 付録
6G Market Overview
As per Roots Analysis, the global 6G market size is estimated to grow from USD 1.22 billion in 2027 to USD 108.18 billion by 2035, at a CAGR of 75.18% during the forecast period, till 2035.
The opportunity for 6G market has been distributed across the following segments:
Type of Component
- Hardware
- Software
- Service
Type of Communication Infrastructure
- Fixed
- Mobile Broadband
- Mobile Cellular
Type of Application
- Blockchain and DLT
- Connected Robotics and Autonomous Systems
- Digital Twins
- Holographic Communication
- Internet of Everything
- Smart Cities
- Wireless Brain-Computer Interactions
- Others
Type of End User
- Consumer
- Enterprise
- Government
- Industrial
Geographical Regions
- North America
- US
- Canada
- Mexico
- Other North American countries
- Europe
- Austria
- Belgium
- Denmark
- France
- Germany
- Ireland
- Italy
- Netherlands
- Norway
- Russia
- Spain
- Sweden
- Switzerland
- UK
- Other European countries
- Asia
- China
- India
- Japan
- Singapore
- South Korea
- Other Asian countries
- Latin America
- Brazil
- Chile
- Colombia
- Venezuela
- Other Latin American countries
- Middle East and North Africa
- Egypt
- Iran
- Iraq
- Israel
- Kuwait
- Saudi Arabia
- UAE
- Other MENA countries
- Rest of the World
- Australia
- New Zealand
- Other countries
6G MARKET: GROWTH AND TRENDS
From the initiation of 2G in the 1990s to the launch of 5G services in 2019, the telecommunications sector is experiencing a significant transformation as the global implementation unfolds, with 6G technology expected to revolutionize the wireless communication landscape. 6G, or the sixth generation of wireless technology, represents a cellular network operating in previously unused radio frequencies and employs cognitive technologies akin to artificial intelligence. This innovation promises quicker speeds, reduced latency in communication, and more reliable connectivity compared to the 5G network. Currently, 6G networks are still in the initial phases of exploration and have not yet been deployed. However, they are designed to support advanced applications such as augmented reality, virtual reality, and holographic communication.
The primary distinction between 5G and 6G networks lies in the enhanced utilization of the radio spectrum, the incorporation of artificial intelligence, machine learning-driven air interfaces, and sophisticated antenna designs that enhance reliability and data transfer rates. A standout feature of 6G is its potential to deliver speeds up to 100 times faster than 5G and nearly eliminate latency, positioning it to accelerate growth in the global 6G market. Additionally, the ongoing innovations in the telecommunications sector and the increasing demand for smart connectivity, where devices, individuals, and networks can interact fluidly.
6G technology is anticipated to support machine-to-machine communication, benefiting various sectors, including the infrastructure of smart cities. The influence of 6G on the Internet of Things (IoT) and smart cities will be significantly bolstered by its capacity for real-time data processing, enhancing public safety and improving resource management. Furthermore, healthcare applications utilizing 6G technology are expected to yield substantial advancements in telemedicine and remote patient monitoring, ultimately improving health outcomes. Similarly, this technology will enhance consumer electronics by supporting next-generation connectivity standards, enabling richer multimedia experiences and smarter device interactions.
As a result, stakeholders are increasingly channeling investments into the development of 6G networks to capitalize on lucrative opportunities. Owing to the abovementioned factors, the 6G market is expected to increase at a steady pace during the forecast period.
6G MARKET: KEY SEGMENTS
Market Share by Type of Component
Based on type of component, the global 6G market is segmented into hardware, software, and services. According to our estimates, by 2035, hardware segment captures the majority share of the market. This can be attributed to the extensive array of communication systems associated with 6G, including base stations, modems, routers, chipsets, antennas, and more. These components are specifically engineered to address the increased demand for high-speed data transmission and uninterrupted connectivity across various sectors, ranging from multisensory extended reality to digital twins.
However, software segment is anticipated to grow at a relatively higher CAGR during the forecast period, owing to its crucial role in the 6G network by incorporating AI and automation for smooth operation.
Market Share by Type of Communication Infrastructure
Based on type of communication infrastructure, the 6G market is segmented into fixed, mobile broadband, and mobile cellular. According to our estimates, by 2035, the mobile cellular segment captures the majority of the market. This can be attributed to its ability to support widespread applications and the special capabilities required for advanced connectivity. Additionally, it is expected to enable high-speed connections and improved bandwidth for crucial applications like autonomous systems and the Internet of Everything (IoE).
However, the fixed communication infrastructure is anticipated to grow at a relatively higher CAGR during the forecast period, owing to its ability in delivering stable and high-performance connections, especially in industrial and enterprise settings.
Market Share by Type of Application
Based on type of application, the 6G market is segmented into blockchain and DTL, connected robotics and autonomous systems, digital twins, holographic communication, internet of everything, smart cities, wireless brain-computer interactions, and others. According to our estimates, by 2035, holographic application segment captures the majority share of the market. This can be attributed to the capabilities of the 6G network, which has the potential to transform various sectors by providing ultra-fast data speeds and reduced latency. However, connected robotics and autonomous systems segment is anticipated to grow at a relatively higher CAGR during the forecast period.
Market Share by Type of End User
Based on type of end user, the 6G market is segmented into consumer, enterprise, government, and industrial. According to our estimates, by 2035, the government segment captures the majority share of the market. 6G technology has the potential to revolutionize various areas within the government sectors, including law enforcement, military, and defense among others.
As government organizations are currently experiencing enhanced operational efficiency and accuracy through high-speed connectivity enabled by 5G, the introduction of 6G is expected to offer improved security through advanced encryption and AI-driven security solutions. However, the consumer segment is expected to witness a higher CAGR during the forecast period.
Market Share by Geographical Regions
Based on geographical regions, the 6G market is segmented into North America, Europe, Asia, Latin America, Middle East and North Africa, and the rest of the world. According to our estimates, by 2035, North America captures the majority share of the market. Additionally, market in Asia is expected to grow at a relatively higher CAGR during the forecast period, owing to China's increasing efforts toward advancements in 6G technology. By launching the world's first satellite to test a 6G architecture that incorporates AI, China aims to establish itself as a leader within the telecommunications sector.
Example Players in 6G Market
- Airtel
- AT&T
- China Mobile
- China Unicorn
- Ciena
- Deepsig
- Deutsche Telekom
- Ericsson
- HPE
- Jio
- KDDI
- KT
- Media Tek
- National Instruments
- NTT DoCoMo
- Orange
- Qualcomm Technology
- Rakuten Mobile
- Singtel
- SK Telecom
- Telefonica
- T-Mobile
- Verizon
- Vodafone
6G MARKET: RESEARCH COVERAGE
The report on the 6G market features insights on various sections, including:
- Market Sizing and Opportunity Analysis: An in-depth analysis of the 6G market, focusing on key market segments, including [A] type of component, [B] type of communication infrastructure, [C] type of application, [D] type of end user, and [E] geographical regions.
- Competitive Landscape: A comprehensive analysis of the companies engaged in the 6G market, based on several relevant parameters, such as [A] year of establishment, [B] company size, [C] location of headquarters and [D] ownership structure.
- Company Profiles: Elaborate profiles of prominent players engaged in the 6G market, providing details on [A] location of headquarters, [B]company size, [C] company mission, [D] company footprint, [E] management team, [F] contact details, [G] financial information, [H] operating business segments, [I] 6G portfolio, [J] moat analysis, [K] recent developments, and an informed future outlook.
- Megatrends: An evaluation of ongoing megatrends in 6G industry.
- Patent Analysis: An insightful analysis of patents filed / granted in the 6G domain, based on relevant parameters, including [A] type of patent, [B] patent publication year, [C] patent age and [D] leading players.
- Recent Developments: An overview of the recent developments made in the 6G market, along with analysis based on relevant parameters, including [A] year of initiative, [B] type of initiative, [C] geographical distribution and [D] most active players.
- Porter's Five Forces Analysis: An analysis of five competitive forces prevailing in the 6G market, including threats of new entrants, bargaining power of buyers, bargaining power of suppliers, threats of substitute products and rivalry among existing competitors.
- SWOT Analysis: An insightful SWOT framework, highlighting the strengths, weaknesses, opportunities and threats in the domain. Additionally, it provides Harvey ball analysis, highlighting the relative impact of each SWOT parameter.
- Value Chain Analysis: A comprehensive analysis of the value chain, providing information on the different phases and stakeholders involved in the 6G market.
KEY QUESTIONS ANSWERED IN THIS REPORT
- How many companies are currently engaged in 6G market?
- Which are the leading companies in this market?
- What factors are likely to influence the evolution of this market?
- What is the current and future market size?
- What is the CAGR of this market?
- How is the current and future market opportunity likely to be distributed across key market segments?
REASONS TO BUY THIS REPORT
- The report provides a comprehensive market analysis, offering detailed revenue projections of the overall market and its specific sub-segments. This information is valuable to both established market leaders and emerging entrants.
- Stakeholders can leverage the report to gain a deeper understanding of the competitive dynamics within the market. By analyzing the competitive landscape, businesses can make informed decisions to optimize their market positioning and develop effective go-to-market strategies.
- The report offers stakeholders a comprehensive overview of the market, including key drivers, barriers, opportunities, and challenges. This information empowers stakeholders to stay abreast of market trends and make data-driven decisions to capitalize on growth prospects.
ADDITIONAL BENEFITS
- Complimentary Excel Data Packs for all Analytical Modules in the Report
- 15% Free Content Customization
- Detailed Report Walkthrough Session with Research Team
- Free Updated report if the report is 6-12 months old or older
TABLE OF CONTENTS
SECTION I: REPORT OVERVIEW
1. PREFACE
- 1.1. Introduction
- 1.2. Market Share Insights
- 1.3. Key Market Insights
- 1.4. Report Coverage
- 1.5. Key Questions Answered
- 1.6. Chapter Outlines
2. RESEARCH METHODOLOGY
- 2.1. Chapter Overview
- 2.2. Research Assumptions
- 2.3. Database Building
- 2.3.1. Data Collection
- 2.3.2. Data Validation
- 2.3.3. Data Analysis
- 2.4. Project Methodology
- 2.4.1. Secondary Research
- 2.4.1.1. Annual Reports
- 2.4.1.2. Academic Research Papers
- 2.4.1.3. Company Websites
- 2.4.1.4. Investor Presentations
- 2.4.1.5. Regulatory Filings
- 2.4.1.6. White Papers
- 2.4.1.7. Industry Publications
- 2.4.1.8. Conferences and Seminars
- 2.4.1.9. Government Portals
- 2.4.1.10. Media and Press Releases
- 2.4.1.11. Newsletters
- 2.4.1.12. Industry Databases
- 2.4.1.13. Roots Proprietary Databases
- 2.4.1.14. Paid Databases and Sources
- 2.4.1.15. Social Media Portals
- 2.4.1.16. Other Secondary Sources
- 2.4.2. Primary Research
- 2.4.2.1. Introduction
- 2.4.2.2. Types
- 2.4.2.2.1. Qualitative
- 2.4.2.2.2. Quantitative
- 2.4.2.3. Advantages
- 2.4.2.4. Techniques
- 2.4.2.4.1. Interviews
- 2.4.2.4.2. Surveys
- 2.4.2.4.3. Focus Groups
- 2.4.2.4.4. Observational Research
- 2.4.2.4.5. Social Media Interactions
- 2.4.2.5. Stakeholders
- 2.4.2.5.1. Company Executives (CXOs)
- 2.4.2.5.2. Board of Directors
- 2.4.2.5.3. Company Presidents and Vice Presidents
- 2.4.2.5.4. Key Opinion Leaders
- 2.4.2.5.5. Research and Development Heads
- 2.4.2.5.6. Technical Experts
- 2.4.2.5.7. Subject Matter Experts
- 2.4.2.5.8. Scientists
- 2.4.2.5.9. Doctors and Other Healthcare Providers
- 2.4.2.6. Ethics and Integrity
- 2.4.2.6.1. Research Ethics
- 2.4.2.6.2. Data Integrity
- 2.4.3. Analytical Tools and Databases
- 2.4.1. Secondary Research
3. MARKET DYNAMICS
- 3.1. Forecast Methodology
- 3.1.1. Top-Down Approach
- 3.1.2. Bottom-Up Approach
- 3.1.3. Hybrid Approach
- 3.2. Market Assessment Framework
- 3.2.1. Total Addressable Market (TAM)
- 3.2.2. Serviceable Addressable Market (SAM)
- 3.2.3. Serviceable Obtainable Market (SOM)
- 3.2.4. Currently Acquired Market (CAM)
- 3.3. Forecasting Tools and Techniques
- 3.3.1. Qualitative Forecasting
- 3.3.2. Correlation
- 3.3.3. Regression
- 3.3.4. Time Series Analysis
- 3.3.5. Extrapolation
- 3.3.6. Convergence
- 3.3.7. Forecast Error Analysis
- 3.3.8. Data Visualization
- 3.3.9. Scenario Planning
- 3.3.10. Sensitivity Analysis
- 3.4. Key Considerations
- 3.4.1. Demographics
- 3.4.2. Market Access
- 3.4.3. Reimbursement Scenarios
- 3.4.4. Industry Consolidation
- 3.5. Robust Quality Control
- 3.6. Key Market Segmentations
- 3.7. Limitations
4. MACRO-ECONOMIC INDICATORS
- 4.1. Chapter Overview
- 4.2. Market Dynamics
- 4.2.1. Time Period
- 4.2.1.1. Historical Trends
- 4.2.1.2. Current and Forecasted Estimates
- 4.2.2. Currency Coverage
- 4.2.2.1. Overview of Major Currencies Affecting the Market
- 4.2.2.2. Impact of Currency Fluctuations on the Industry
- 4.2.3. Foreign Exchange Impact
- 4.2.3.1. Evaluation of Foreign Exchange Rates and Their Impact on Market
- 4.2.3.2. Strategies for Mitigating Foreign Exchange Risk
- 4.2.4. Recession
- 4.2.4.1. Historical Analysis of Past Recessions and Lessons Learnt
- 4.2.4.2. Assessment of Current Economic Conditions and Potential Impact on the Market
- 4.2.5. Inflation
- 4.2.5.1. Measurement and Analysis of Inflationary Pressures in the Economy
- 4.2.5.2. Potential Impact of Inflation on the Market Evolution
- 4.2.6. Interest Rates
- 4.2.6.1. Overview of Interest Rates and Their Impact on the Market
- 4.2.6.2. Strategies for Managing Interest Rate Risk
- 4.2.7. Commodity Flow Analysis
- 4.2.7.1. Type of Commodity
- 4.2.7.2. Origins and Destinations
- 4.2.7.3. Values and Weights
- 4.2.7.4. Modes of Transportation
- 4.2.8. Global Trade Dynamics
- 4.2.8.1. Import Scenario
- 4.2.8.2. Export Scenario
- 4.2.9. War Impact Analysis
- 4.2.9.1. Russian-Ukraine War
- 4.2.9.2. Israel-Hamas War
- 4.2.10. COVID Impact / Related Factors
- 4.2.10.1. Global Economic Impact
- 4.2.10.2. Industry-specific Impact
- 4.2.10.3. Government Response and Stimulus Measures
- 4.2.10.4. Future Outlook and Adaptation Strategies
- 4.2.11. Other Indicators
- 4.2.11.1. Fiscal Policy
- 4.2.11.2. Consumer Spending
- 4.2.11.3. Gross Domestic Product (GDP)
- 4.2.11.4. Employment
- 4.2.11.5. Taxes
- 4.2.11.6. R&D Innovation
- 4.2.11.7. Stock Market Performance
- 4.2.11.8. Supply Chain
- 4.2.11.9. Cross-Border Dynamics
- 4.2.1. Time Period
SECTION II: QUALITATIVE INSIGHTS
5. EXECUTIVE SUMMARY
6. INTRODUCTION
- 6.1. Chapter Overview
- 6.2. Overview of 6G Market
- 6.2.1. Type of Component
- 6.2.2. Type of Communication Infrastructure
- 6.2.3. Type of Application
- 6.2.4. Type of End User
- 6.3. Future Perspective
7. REGULATORY SCENARIO
SECTION III: MARKET OVERVIEW
8. COMPREHENSIVE DATABASE OF LEADING PLAYERS
9. COMPETITIVE LANDSCAPE
- 9.1. Chapter Overview
- 9.2. 6G: Overall Market Landscape
- 9.2.1. Analysis by Year of Establishment
- 9.2.2. Analysis by Company Size
- 9.2.3. Analysis by Location of Headquarters
- 9.2.4. Analysis by Ownership Structure
10. WHITE SPACE ANALYSIS
11. COMPANY COMPETITIVENESS ANALYSIS
12. STARTUP ECOSYSTEM IN THE 6G MARKET
- 12.1. 6G: Market Landscape of Startups
- 12.1.1. Analysis by Year of Establishment
- 12.1.2. Analysis by Company Size
- 12.1.3. Analysis by Company Size and Year of Establishment
- 12.1.4. Analysis by Location of Headquarters
- 12.1.5. Analysis by Company Size and Location of Headquarters
- 12.1.6. Analysis by Ownership Structure
- 12.2. Key Findings
SECTION IV: COMPANY PROFILES
13. COMPANY PROFILES
- 13.1. Chapter Overview
- 13.2. Airtel*
- 13.2.1. Company Overview
- 13.2.2. Company Mission
- 13.2.3. Company Footprint
- 13.2.4. Management Team
- 13.2.5. Contact Details
- 13.2.6. Financial Performance
- 13.2.7. Operating Business Segments
- 13.2.8. Service / Product Portfolio (project specific)
- 13.2.9. MOAT Analysis
- 13.2.10. Recent Developments and Future Outlook
- 13.3. AT&T
- 13.4. China Mobile
- 13.5. China Unicorn
- 13.6. Ciena
- 13.7. Deepsig
- 13.8. Deutsche Telekom
- 13.9. Ericsson
- 13.10. Hewlett Packard Enterprise
- 13.11. Jio
- 13.12. KDDI
- 13.13. KT
- 13.14. MediaTek
- 13.15. National Instruments
- 13.16. NTT DoCoMo
- 13.17. Orange
- 13.18. Qualcomm
- 13.19. Rakuten Mobile
- 13.20. Singtel
- 13.21. SK Telecom
- 13.22. Telefonica
- 13.23. T-Mobile
- 13.24. Verizon
- 13.25. Vodafone
SECTION V: MARKET TRENDS
14. MEGA TRENDS ANALYSIS
15. UNMEET NEED ANALYSIS
16. PATENT ANALYSIS
17. RECENT DEVELOPMENTS
- 17.1. Chapter Overview
- 17.2. Recent Funding
- 17.3. Recent Partnerships
- 17.4. Other Recent Initiatives
SECTION VI: MARKET OPPORTUNITY ANALYSIS
18. GLOBAL 6G MARKET
- 18.1. Chapter Overview
- 18.2. Key Assumptions and Methodology
- 18.3. Trends Disruption Impacting Market
- 18.4. Demand Side Trends
- 18.5. Supply Side Trends
- 18.6. Global 6G Market, Forecasted Estimates (Till 2035)
- 18.7. Multivariate Scenario Analysis
- 18.7.1. Conservative Scenario
- 18.7.2. Optimistic Scenario
- 18.8. Investment Feasibility Index
- 18.9. Key Market Segmentations
19. MARKET OPPORTUNITIES BASED ON TYPE OF COMPONENT
- 19.1. Chapter Overview
- 19.2. Key Assumptions and Methodology
- 19.3. Revenue Shift Analysis
- 19.4. Market Movement Analysis
- 19.5. Penetration-Growth (P-G) Matrix
- 19.6. 6G Market for Hardware: Forecasted Estimates (Till 2035)
- 19.7. 6G Market for Software: Forecasted Estimates (Till 2035)
- 19.8. 6G Market for Service: Forecasted Estimates (Till 2035)
- 19.9. Data Triangulation and Validation
- 19.9.1. Secondary Sources
- 19.9.2. Primary Sources
- 19.9.3. Statistical Modeling
20. MARKET OPPORTUNITIES BASED ON TYPE OF COMMUNICATION INFRASTRUCTURE
- 20.1. Chapter Overview
- 20.2. Key Assumptions and Methodology
- 20.3. Revenue Shift Analysis
- 20.4. Market Movement Analysis
- 20.5. Penetration-Growth (P-G) Matrix
- 20.6. 6G Market for Fixed: Forecasted Estimates (Till 2035)
- 20.7. 6G Market for Mobile Broadband: Forecasted Estimates (Till 2035)
- 20.8. 6G Market for Mobile Cellular: Forecasted Estimates (Till 2035)
- 20.9. Data Triangulation and Validation
- 20.9.1. Secondary Sources
- 20.9.2. Primary Sources
- 20.9.3. Statistical Modeling
21. MARKET OPPORTUNITIES BASED ON TYPE OF APPLICATION
- 21.1. Chapter Overview
- 21.2. Key Assumptions and Methodology
- 21.3. Revenue Shift Analysis
- 21.4. Market Movement Analysis
- 21.5. Penetration-Growth (P-G) Matrix
- 21.6. 6G Market for Blockchain and DLT: Forecasted Estimates (Till 2035)
- 21.7. 6G Market for Connected Robotics and Autonomous Systems: Forecasted Estimates (Till 2035)
- 21.8. 6G Market for Digital Twins: Forecasted Estimates (Till 2035)
- 21.9. 6G Market for Holographic Communication: Forecasted Estimates (Till 2035)
- 21.10. 6G Market for Internet of Everything: Forecasted Estimates (Till 2035)
- 21.11. 6G Market for Smart Cities: Forecasted Estimates (Till 2035)
- 21.12. 6G Market for Wireless Brain-Computer Interactions: Forecasted Estimates (Till 2035)
- 21.13. 6G Market for Others: Forecasted Estimates (Till 2035)
- 21.14. Data Triangulation and Validation
- 21.14.1. Secondary Sources
- 21.14.2. Primary Sources
- 21.14.3. Statistical Modeling
22. MARKET OPPORTUNITIES BASED ON TYPE OF END USER
- 22.1. Chapter Overview
- 22.2. Key Assumptions and Methodology
- 22.3. Revenue Shift Analysis
- 22.4. Market Movement Analysis
- 22.5. Penetration-Growth (P-G) Matrix
- 22.6. 6G Market for Consumer: Forecasted Estimates (Till 2035)
- 22.7. 6G Market for Enterprise: Forecasted Estimates (Till 2035)
- 22.8. 6G Market for Government: Forecasted Estimates (Till 2035)
- 22.9. 6G Market for Industrial: Forecasted Estimates (Till 2035)
- 22.10. Data Triangulation and Validation
- 22.10.1. Secondary Sources
- 22.10.2. Primary Sources
- 22.10.3. Statistical Modeling
23. MARKET OPPORTUNITIES FOR 6G IN NORTH AMERICA
- 23.1. Chapter Overview
- 23.2. Key Assumptions and Methodology
- 23.3. Revenue Shift Analysis
- 23.4. Market Movement Analysis
- 23.5. Penetration-Growth (P-G) Matrix
- 23.6. 6G Market in North America: Forecasted Estimates (Till 2035)
- 23.6.1. 6G Market in the US: Forecasted Estimates (Till 2035)
- 23.6.2. 6G Market in Canada: Forecasted Estimates (Till 2035)
- 23.6.3. 6G Market in Mexico: Forecasted Estimates (Till 2035)
- 23.6.4. 6G Market in Other North American Countries: Forecasted Estimates (Till 2035)
- 23.7. Data Triangulation and Validation
24. MARKET OPPORTUNITIES FOR 6G IN EUROPE
- 24.1. Chapter Overview
- 24.2. Key Assumptions and Methodology
- 24.3. Revenue Shift Analysis
- 24.4. Market Movement Analysis
- 24.5. Penetration-Growth (P-G) Matrix
- 24.6. 6G Market in Europe: Forecasted Estimates (Till 2035)
- 24.6.1. 6G Market in Austria: Forecasted Estimates (Till 2035)
- 24.6.2. 6G Market in Belgium: Forecasted Estimates (Till 2035)
- 24.6.3. 6G Market in Denmark: Forecasted Estimates (Till 2035)
- 24.6.4. 6G Market in France: Forecasted Estimates (Till 2035)
- 24.6.5. 6G Market in Germany: Forecasted Estimates (Till 2035)
- 24.6.6. 6G Market in Ireland: Forecasted Estimates (Till 2035)
- 24.6.7. 6G Market in Italy: Forecasted Estimates (Till 2035)
- 24.6.8. 6G Market in Netherlands: Forecasted Estimates (Till 2035)
- 24.6.9. 6G Market in Norway: Forecasted Estimates (Till 2035)
- 24.6.10. 6G Market in Russia: Forecasted Estimates (Till 2035)
- 24.6.11. 6G Market in Spain: Forecasted Estimates (Till 2035)
- 24.6.12. 6G Market in Sweden: Forecasted Estimates (Till 2035)
- 24.6.13. 6G Market in Sweden: Forecasted Estimates (Till 2035)
- 24.6.14. 6G Market in Switzerland: Forecasted Estimates (Till 2035)
- 24.6.15. 6G Market in the UK: Forecasted Estimates (Till 2035)
- 24.6.16. 6G Market in Other European Countries: Forecasted Estimates (Till 2035)
- 24.7. Data Triangulation and Validation
25. MARKET OPPORTUNITIES FOR 6G IN ASIA
- 25.1. Chapter Overview
- 25.2. Key Assumptions and Methodology
- 25.3. Revenue Shift Analysis
- 25.4. Market Movement Analysis
- 25.5. Penetration-Growth (P-G) Matrix
- 25.6. 6G Market in Asia: Forecasted Estimates (Till 2035)
- 25.6.1. 6G Market in China: Forecasted Estimates (Till 2035)
- 25.6.2. 6G Market in India: Forecasted Estimates (Till 2035)
- 25.6.3. 6G Market in Japan: Forecasted Estimates (Till 2035)
- 25.6.4. 6G Market in Singapore: Forecasted Estimates (Till 2035)
- 25.6.5. 6G Market in South Korea: Forecasted Estimates (Till 2035)
- 25.6.6. 6G Market in Other Asian Countries: Forecasted Estimates (Till 2035)
- 25.7. Data Triangulation and Validation
26. MARKET OPPORTUNITIES FOR 6G IN MIDDLE EAST AND NORTH AFRICA (MENA)
- 26.1. Chapter Overview
- 26.2. Key Assumptions and Methodology
- 26.3. Revenue Shift Analysis
- 26.4. Market Movement Analysis
- 26.5. Penetration-Growth (P-G) Matrix
- 26.6. 6G Market in Middle East and North Africa (MENA): Forecasted Estimates (Till 2035)
- 26.6.1. 6G Market in Egypt: Forecasted Estimates (Till 205)
- 26.6.2. 6G Market in Iran: Forecasted Estimates (Till 2035)
- 26.6.3. 6G Market in Iraq: Forecasted Estimates (Till 2035)
- 26.6.4. 6G Market in Israel: Forecasted Estimates (Till 2035)
- 26.6.5. 6G Market in Kuwait: Forecasted Estimates (Till 2035)
- 26.6.6. 6G Market in Saudi Arabia: Forecasted Estimates (Till 2035)
- 26.6.7. Neuromorphic Computing Marke in United Arab Emirates (UAE): Forecasted Estimates (Till 2035)
- 26.6.8. 6G Market in Other MENA Countries: Forecasted Estimates (Till 2035)
- 26.7. Data Triangulation and Validation
27. MARKET OPPORTUNITIES FOR 6G IN LATIN AMERICA
- 27.1. Chapter Overview
- 27.2. Key Assumptions and Methodology
- 27.3. Revenue Shift Analysis
- 27.4. Market Movement Analysis
- 27.5. Penetration-Growth (P-G) Matrix
- 27.6. 6G Market in Latin America: Forecasted Estimates (Till 2035)
- 27.6.1. 6G Market in Argentina: Forecasted Estimates (Till 2035)
- 27.6.2. 6G Market in Brazil: Forecasted Estimates (Till 2035)
- 27.6.3. 6G Market in Chile: Forecasted Estimates (Till 2035)
- 27.6.4. 6G Market in Colombia Forecasted Estimates (Till 2035)
- 27.6.5. 6G Market in Venezuela: Forecasted Estimates (Till 2035)
- 27.6.6. 6G Market in Other Latin American Countries: Forecasted Estimates (Till 2035)
- 27.7. Data Triangulation and Validation
28. MARKET OPPORTUNITIES FOR 6G IN REST OF THE WORLD
- 28.1. Chapter Overview
- 28.2. Key Assumptions and Methodology
- 28.3. Revenue Shift Analysis
- 28.4. Market Movement Analysis
- 28.5. Penetration-Growth (P-G) Matrix
- 28.6. 6G Market in Rest of the World: Forecasted Estimates (Till 2035)
- 28.6.1. 6G Market in Australia: Forecasted Estimates (Till 2035)
- 28.6.2. 6G Market in New Zealand: Forecasted Estimates (Till 2035)
- 28.6.3. 6G Market in Other Countries
- 28.7. Data Triangulation and Validation
29. MARKET CONCENTRATION ANALYSIS: DISTRIBUTION BY LEADING PLAYERS
- 29.1. Leading Player 1
- 29.2. Leading Player 2
- 29.3. Leading Player 3
- 29.4. Leading Player 4
- 29.5. Leading Player 5
- 29.6. Leading Player 6
- 29.7. Leading Player 7
- 29.8. Leading Player 8
