
細胞リプログラミング市場:業界動向と世界の予測 - 技術タイプ別、由来細胞タイプ別、応用タイプ別、主要地域別
Cell Reprogramming Market: Industry Trends and Global Forecasts - Distribution by Type of Technology, Type of Source Cell, Type of Application and Key Geographical Regions- 発行日
- ページ情報
- 英文 293 Pages
- 納期
- 7~10営業日
- 商品コード
- 1771303
- カスタマイズ可能 お客様のご希望に応じて、既存データの加工や未掲載情報(例:国別セグメント)の追加などの対応が可能です。詳細はお問い合わせください。
- 翻訳ツール提供対象 PDF対応AI翻訳ツールの無料貸し出しサービスのご利用が可能です
- 医薬品関連専門 医薬品関連専門を専門とする市場調査会社です。
概要
世界の細胞リプログラミング市場:概要
世界の細胞リプログラミングの市場規模は、今年11億6,000万米ドルとなりました。同市場は、予測期間中に8%のCAGRで拡大すると予測されています。
市場セグメンテーションと機会分析は、以下のパラメータでセグメント化されています:
技術タイプ
- センダイウイルスベースのリプログラミング
- mRNAリプログラミング
- エピソーム・リプログラミング
- その他のリプログラミング技術
由来細胞タイプ
- 線維芽細胞
- 末梢血単核細胞
- 不特定体細胞
- その他
応用タイプ
- 研究
- 治療
主要地域
- 北米
- 欧州
- アジア太平洋およびその他の地域
世界の細胞リプログラミング市場:成長と動向
長年にわたる幹細胞生物学と再生医療の開発により、様々な幹細胞を用いた治療法が発見・開発されてきました。しかし、複雑な製造プロセス、健康な細胞ドナーの不足、ドナーとレシピエントのハプロタイプの不一致に関連する懸念など、細胞療法の開発と使用に関する課題は依然として残っています。さらに、ヒト幹細胞を研究目的に使用することには、いくつかの倫理的障壁があります。その結果、前述の問題を克服し、安全で効果的な細胞ベースの治療介入を開発する手段の一つとして、細胞リプログラミングの概念が浮上してきました。
バイオテクノロジー分野の技術開発と再生医療に関連する市場開拓に後押しされ、世界中の多くの研究グループが現在、細胞を初期化する革新的な方法を開発しています。さらに、様々な新興企業や大学のスピンオフ企業が、この新たな治療分野のパイオニアとして台頭しており、今後数年間も研究の勢いを維持すると予想されていることは注目に値します。
世界の細胞リプログラミング市場:主要インサイト
当レポートでは、世界の細胞リプログラミング市場の現状を掘り下げ、業界内の潜在的成長機会を特定しています。当レポートの主な調査結果は以下の通りです。
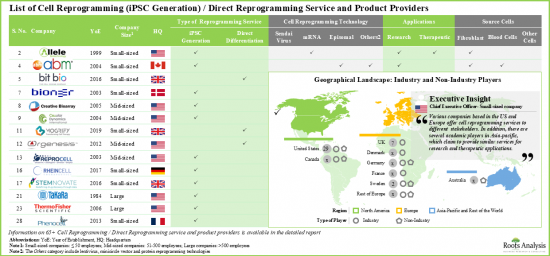
- 細胞リプログラミングの進歩は、多くの先進的な治療・研究用途への道を開き、その結果、業界および非業界のサービスプロバイダー企業に有利なビジネスチャンスをもたらしています。
- 30社以上の企業が細胞リプログラミングのサービスや製品を提供していると主張しています。このうち70%近くが小規模企業(従業員50人未満)です。
- 現在、サービス・プロバイダーの大半(~75%)は、エピソーム初期化技術を用いたiPSC作製サービスを提供しており、様々な種類の細胞を扱うことができると主張しています。これに続くのが、直接初期化サービスを提供する企業(30%)です。
- 利害関係者の大半がiPS細胞の作製にエピソーム初期化法を使用していると主張していることは注目に値します。他の一般的な細胞リプログラミングアプローチには、センダイウイルスやmRNAベースの技術が含まれます。
- 多数の企業が、iPS細胞の作製に2つ以上の技術を使用していると主張しています。その例としては、Applied StemCell、Applied Biological Materials、Creative Bioarray、Lonza、Stemnovateなどが挙げられます。
- 入手のしやすさ、増殖速度の速さ、細胞の頑健性など、線維芽細胞に関連する様々な利点を考慮すると、これらの細胞は細胞リプログラミングにおいて最大(40%以上)利用されています。
- 複数の中小企業が存在することが特徴で、細胞リプログラミングの状況は様々な地域にうまく分散しており、参入企業は顧客のニーズに応えるために複数の施設を設立しています。
- 北米は細胞リプログラミングの主要サービス拠点です。細胞リプログラミングに携わる企業の55%以上が北米に本社を置いています。次いで欧州に本社を置く企業(45%)です。
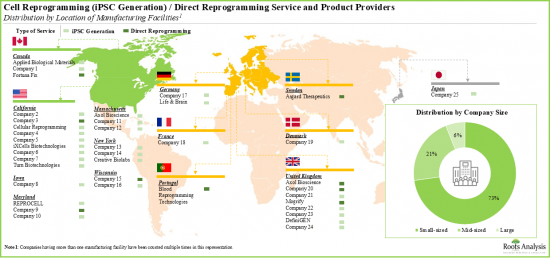
- 欧州の主要施設には、英国、ドイツ、デンマーク、スイス、フランス、ポルトガル、スウェーデンが含まれます。利害関係者は、それぞれの細胞リプログラミングサービスのポートフォリオを充実させ、それ別この先の業界における競争力を維持するために、積極的に能力を拡大しています。
- この分野への関心の高まりは、過去に締結された様々な種類の細胞を含むパートナーシップの数に反映されています。
- 2016年以降、提携活動はCAGR 7%で増加しています。幹細胞に対する需要の増加に伴い、産学双方の参入企業が細胞リプログラミングのために複数の提携を結ぶ可能性が高いです。
- 既存企業も新規参入企業も、ここ数年で複数の戦略的提携を結んでいます。取引の大半(30%超)は主にiPS細胞の作製を目的としたもので、顧客の要求に応じてさらに差別化が図られています。
- 多くの企業が細胞の初期化に関して複数の契約を結んでいます。4件以上の契約を結んだ企業の例としては、Cellaria、BlueRock Therapeutics、FUJIFILM Cellular Dynamics、STEMCELL Technologiesなどがあります。
- ここ数年で、様々な種類の幹細胞治療を評価する540以上の臨床試験が開始されました。このことは、iPS細胞作製と直接リプログラミング戦略に対する需要の高まりを強調しています。
- >これらの臨床試験の70%以上は、中小企業がスポンサーとなって行われており、幹細胞治療の可能性を追求しています。
- 幹細胞治療の開発に携わる300以上の利害関係者を調査した結果、細胞リプログラミングサービスプロバイダーにとって戦略的パートナーとなりそうな企業が、さまざまな地域にわたって存在することが明らかになっています。
- 同市場は2030年までCAGR 8%で成長すると予測されており、その機会は様々な種類の技術、応用分野、主要な地域にわたって分散している可能性が高いです。
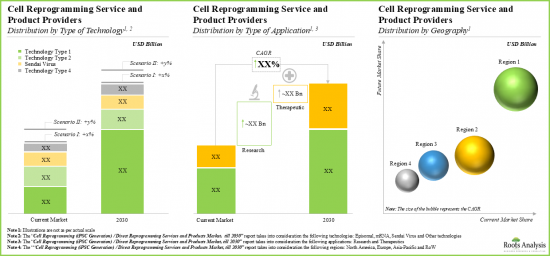
- 現在、サービス収益の大半はエピソーム再プログラミング技術を含むプロジェクトから生み出されています。
- 2030年には、エピソームの初期化に焦点を当てたプロジェクトが全体の40%以上を占めると予想され、これにセンダイウイルスベースの初期化(30%)とmRNA(25%)を含むプロジェクトからの収益が続くと予想されます。
細胞リプログラミング市場の参入企業例
- Allele Biotechnology
- ALSTEM
- Applied Biological Materials
- Axol Bioscience
- Creative Bioarray
- DefiniGEN
- FUJIFILM Cellular Dynamics
- Lonza
- Mogrify
- REPROCELL
- Stemnovate
- Thermo Fisher Scientific
当レポートでは、世界の細胞リプログラミング市場について調査し、市場の概要とともに、技術タイプ別、由来細胞タイプ別、応用タイプ別動向、地域別の動向、および市場に参入する企業のプロファイルなどを提供しています。
目次
第1章 序文
第2章 エグゼクティブサマリー
第3章 イントロダクション
- 章の概要
- 幹細胞の概要
- 細胞リプログラミングイントロダクション
- 細胞リプログラミングの応用
- 主要な成長要因と抑制要因
第4章 現在の市場情勢
- 章の概要
- 細胞リプログラミングサービスおよび製品プロバイダー:業界参入企業一覧
- 細胞リプログラミングサービスおよび製品プロバイダー:業界外の参入企業のリスト
- 細胞リプログラミング:関連製品プロバイダーのリスト
第5章 企業競争力分析
- 章の概要
- 前提と主要なパラメータ
- 調査手法
- 競争力分析:iPSC生成サービスおよび製品プロバイダー
- 競争力分析:ダイレクトリプログラミングサービスおよび製品プロバイダー
第6章 企業プロファイル
- 章の概要
- Allele Biotechnology
- ALSTEM
- Applied Biological Materials
- Axol Bioscience
- Creative Bioarray
- DefiniGEN
- FUJIFILM Cellular Dynamics International
- Lonza
- Mogrify
- REPROCELL
- Stemnovate
- Thermo fisher Scientific
第7章 ケーススタディ:幹細胞治療開発における臨床試験活動
- 章の概要
- 範囲と調査手法
- 幹細胞療法:臨床試験分析
第8章 パートナーシップとコラボレーション
- 章の概要
- 範囲と調査手法
- 細胞リプログラミングサービスおよび製品市場:パートナーシップとコラボレーションのリスト
第9章 パートナーシップの可能性
- 章の概要
- 範囲と調査手法
- 採点基準と主要な前提
- 幹細胞療法の開発者:細胞リプログラミングサービスおよび製品プロバイダーの有望なパートナー
- 幹細胞療法の受託製造業者:細胞リプログラミングサービスおよび製品プロバイダーの有望なパートナー
第10章 市場予測
- 章の概要
- 範囲と調査手法
- 予測調査手法と主要な前提条件
- 2035年までの世界の細胞リプログラミングサービスおよび製品市場
- 世界の細胞リプログラミングサービスおよび製品市場:技術タイプ別(2035年まで)
- 世界の細胞リプログラミングサービスおよび製品市場:由来細胞タイプ別(2035年まで)
- 世界の細胞リプログラミングサービスおよび製品市場:応用タイプ別(2035年まで)
- 世界の細胞リプログラミングサービスおよび製品市場:主要地域別分布(2035年まで)
第11章 エグゼクティブ洞察
第12章 結論
第13章 付録1:表形式データ
第14章 付録2:企業・団体一覧
図表
List of Tables
- Table 3.1 Differences between Stem Cell Therapies and Other Biologics
- Table 4.1 Cell Reprogramming Services and Products: List of Industry Players
- Table 4.2 Cell Reprogramming Services and Products: List of Non-Industry Players
- Table 4.3 Cell Reprogramming Services and Products: List of Affiliated Product Providers
- Table 6.1 Cell Reprogramming Service and Product Providers: List of Profiled Companies
- Table 6.2 ALSTEM: Company Snapshot
- Table 6.3 ALSTEM: Recent Developments and Future Outlook
- Table 6.4 Applied Biological Materials: Company Snapshot
- Table 6.5 Applied Biological Materials: Recent Developments and Future Outlook
- Table 6.6 Axol Bioscience: Company Snapshot
- Table 6.7 Axol Bioscience: Recent Developments and Future Outlook
- Table 6.8 Creative Bioarray: Company Snapshot
- Table 6.9 Creative Bioarray: Recent Developments and Future Outlook
- Table 6.10 DefiniGEN: Company Snapshot
- Table 6.11 DefiniGEN: Recent Developments and Future Outlook
- Table 6.12 FUJIFILM Cellular Dynamics International: Company Snapshot
- Table 6.13 FUJIFILM Cellular Dynamics International: Recent Developments and Future Outlook
- Table 6.14 Lonza: Company Snapshot
- Table 6.15 Lonza: Recent Developments and Future Outlook
- Table 6.16 Mogrify: Company Snapshot
- Table 6.17 Mogrify: Recent Developments and Future Outlook
- Table 6.18 REPROCELL: Company Snapshot
- Table 6.19 REPROCELL: Recent Developments and Future Outlook
- Table 6.20 Stemnovate: Company Snapshot
- Table 6.21 Stemnovate: Recent Developments and Future Outlook
- Table 6.22 Thermo Fisher Scientific: Company Snapshot
- Table 6.23 Thermo Fisher Scientific: Recent Developments and Future Outlook
- Table 7.1 Cell Reprogramming Services: List of Partnerships and Collaborations
- Table 9.1 Likely Partners for Cell Reprogramming Service and Product Providers in North America
- Table 9.2 Likely Partners for Cell Reprogramming Service and Product Providers in Europe
- Table 9.3 Likely Partners for Cell Reprogramming Service and Product Providers in Asia-Pacific and Rest of the World
- Table 9.4 Likely Partners for Cell Reprogramming Service and Product Providers in North America
- Table 9.5 Likely Partners for Cell Reprogramming Service and Product Providers in Europe
- Table 9.6 Likely Partners for Cell Reprogramming Service and Product Providers in Asia-Pacific and Rest of the World
- Table 11.1 Asgard Therapeutics: Company Snapshot
- Table 11.2 Phenocell: Company Snapshot
- Table 13.1 Cell Reprogramming Service and Product Providers (Industry Players): Distribution by Year of Establishment
- Table 13.2 Cell Reprogramming Service and Product Providers (Industry Players): Distribution by Company Size
- Table 13.3 Cell Reprogramming Service and Product Providers (Industry Players): Distribution by Geographical Location
- Table 13.4 Cell Reprogramming Service and Product Providers (Industry Players): Distribution by Location of Manufacturing Facilities
- Table 13.5 Cell Reprogramming Service and Product Providers (Industry Players): Distribution by Type of Service
- Table 13.6 Cell Reprogramming Service and Product Providers (Industry Players): Distribution by Type of Offering
- Table 13.7 Cell Reprogramming Service and Product Providers (Industry Players): Distribution by Type of Technology
- Table 13.8 Cell Reprogramming Service and Product Providers (Industry Players): Distribution by Type of Technology and Year of Establishment
- Table 13.9 Cell Reprogramming Service and Product Providers (Industry Players): Distribution by Type of Vector Used
- Table 13.10 Cell Reprogramming Service and Product Providers (Industry Players): Distribution by Source Cell for iPSC Generation
- Table 13.11 Cell Reprogramming Service and Product Providers (Industry Players): Distribution by Type of Source Cell for iPSC Generation and company size
- Table 13.12 Cell Reprogramming Service and Product Providers (Industry Players): Distribution by Target Indication
- Table 13.13 Cell Reprogramming Service and Product Providers (Industry Players): Distribution by Type of directly reprogrammed cell
- Table 13.14 Cell Reprogramming Service and Product Providers (Industry Players): Distribution by Type of Application
- Table 13.15 Cell Reprogramming Service and Product Providers (Industry Players): Distribution by Type of Additional Service(s) Offered
- Table 13.16 Cell Reprogramming Service and Product Providers (Non-Industry Players): Distribution by Geographical Location
- Table 13.17 Cell Reprogramming Service and Product Providers (Non-Industry Players): Distribution by Type of Technology
- Table 13.18 Cell Reprogramming Service and Product Providers (Non-Industry Players): Distribution by Type of Vector Used
- Table 13.19 Cell Reprogramming Service and Product Providers (Non-Industry Players): Distribution by Source Cell for iPSC Generation
- Table 13.20 Clinical Trial Analysis: Distribution by Trial Status
- Table 13.21 Clinical Trial Analysis: Cumulative Distribution of Trials by Registration Year, Since Pre-2010
- Table 13.22 Clinical Trial Analysis: Distribution by Trial Phase
- Table 13.23 Clinical Trial Analysis: Distribution by Number of Patients Enrolled by Trial Registration Year, Since 2011
- Table 13.24 Clinical Trial Analysis: Distribution by Study Design
- Table 13.25 Clinical Trial Analysis: Cumulative Year-wise Trend by Trial Recruitment Status
- Table 13.26 Clinical Trial Analysis: Distribution by Type of Sponsor / Collaborator
- Table 13.27 Clinical Trial Analysis: Leading Industry Players
- Table 13.28 Clinical Trial Analysis: Analysis by Type of Stem Cell
- Table 13.29 Clinical Trial Analysis: Cumulative Distribution by Type of Stem Cell and Trial Registration Year
- Table 13.30 Clinical Trial Analysis: Distribution by Therapeutic Area
- Table 13.31 Clinical Trial Analysis: Year-Wise Trend in Activity for Popular Therapeutic Areas
- Table 13.32 Clinical Trial Analysis: Distribution by Patient Enrollment and Therapeutic Area
- Table 13.33 Clinical Trial Analysis: Year-Wise Trend in Patient Enrollment (in thousands) for Popular Therapeutic Areas
- Table 13.34 Clinical Trial Analysis: Distribution by Type of Stem Cell and Therapeutic Area
- Table 13.35 Clinical Trial Analysis: Geographical Distribution by Number of Trials
- Table 13.36 Clinical Trial Analysis: Geographical Distribution by Trial Registration Year and Recruitment Status
- Table 13.37 Clinical Trial Analysis: Geographical Distribution by Enrolled Patient
- Table 13.38 Partnerships and Collaborations: Analysis by Year of Partnership
- Table 13.39 Partnerships and Collaborations: Analysis by Type of Partnership
- Table 13.40 Partnerships and Collaborations: Analysis by Year of Partnership and Type of Partner
- Table 13.41 Partnerships and Collaborations: Analysis by Type of Partnership and Type of Partner
- Table 13.42 Partnerships and Collaborations: Analysis by Type of Stem Cell
- Table 13.43 Partnerships and Collaborations: Analysis by Target Therapeutic Area
- Table 13.44 Partnerships and Collaborations: Analysis by Application
- Table 13.45 Most Active Players: Distribution by Number of Partnerships
- Table 13.46 Partnerships and Collaborations: Regional Analysis
- Table 13.47 Partnerships and Collaborations: Intercontinental and Intracontinental Agreements
- Table 13.48 Global Cell Reprogramming Services and Products Market, Till 2035 (USD Million)
- Table 13.49 Global Cell Reprogramming Services and Products Market: Distribution by Type of Technology, Till 2035
- Table 13.50 Cell Reprogramming Services and Products Market for Episomal Reprogramming, Till 2035 (USD Million)
- Table 13.51 Cell Reprogramming Services and Products Market for mRNA Reprogramming, Till 2035 (USD Million)
- Table 13.52 Cell Reprogramming Services and Products Market for Sendai Virus-based Reprogramming, Till 2035 (USD Million)
- Table 13.53 Cell Reprogramming Services and Products Market for Other Reprogramming Technologies, Till 2035 (USD Million)
- Table 13.54 Global Cell Reprogramming Services and Products Market: Distribution by Source Cell for iPSC Generation, Till 2035
- Table 13.55 Cell Reprogramming Services and Products Market for Fibroblasts, Till 2035 (USD Million)
- Table 13.56 Cell Reprogramming Services and Products Market for Peripheral Blood Mononuclear Cells, Till 2035 (USD Million)
- Table 13.57 Cell Reprogramming Services and Products Market for Unspecified Somatic Cells, Till 2035 (USD Million)
- Table 13.58 Cell Reprogramming Services and Products Market for Other Cells, Till 2035 (USD Million)
- Table 13.59 Global Cell Reprogramming Services and Products Market: Distribution by Application, Till 2035
- Table 13.60 Cell Reprogramming Services and Products Market for Research, Till 2035 (USD Million)
- Table 13.61 Cell Reprogramming Services and Products Market for Therapeutic Use, Till 2035 (USD Million)
- Table 13.62 Global Cell Reprogramming Services and Products Market: Distribution by Key Geographical Regions, Till 2035
- Table 13.63 Cell Reprogramming Services and Products Market in North America, Till 2035 (USD Million)
- Table 13.64 Cell Reprogramming Services and Products Market in Europe, Till 2035 (USD Million)
- Table 13.65 Cell Reprogramming Services and Products Market in Asia-Pacific and Rest of the World, Till 2035 (USD Million)
List of Figures
- Figure 3.1 Cellular Lineages used for Isolation of Stem Cells
- Figure 3.2 Steps Involved in the Development and Administration of Stem Cells
- Figure 3.3 Classification of Stem Cells
- Figure 3.4 Classification based on Source of Stem Cell
- Figure 3.5 Differences between Allogeneic and Autologous Stem Cell Therapies
- Figure 3.6 Classification of Stem Cells based on Origin
- Figure 3.7 Classification of Adult Stem Cells
- Figure 3.8 Classification based on Potency of Stem Cell
- Figure 3.9 Key Application Areas for Stem Cell Therapies
- Figure 3.10 Potential Applications of Cell Reprogramming
- Figure 3.11 Key Growth Drivers and Constraints to Cell Reprogramming
- Figure 4.1 Cell Reprogramming Service and Product Providers (Industry Players): Distribution by Year of Establishment
- Figure 4.2 Cell Reprogramming Service and Product Providers (Industry Players): Distribution by Company Size
- Figure 4.3 Cell Reprogramming Service and Product Providers (Industry Players): Distribution by Geographical Location
- Figure 4.4 Cell Reprogramming Service and Product Providers (Industry Players): Distribution by Location of Manufacturing Facilities
- Figure 4.5 Cell Reprogramming Service and Product Providers (Industry Players): Distribution by Type of Service
- Figure 4.6 Cell Reprogramming Service and Product Providers (Industry Players): Distribution by Type of Offering
- Figure 4.7 Cell Reprogramming Service and Product Providers (Industry Players): Distribution by Type of Technology
- Figure 4.8 Cell Reprogramming Service and Product Providers (Industry Players): Distribution by Type of Technology and Year of Establishment
- Figure 4.9 Cell Reprogramming Service and Product Providers (Industry Players): Distribution by Type of Vector Used
- Figure 4.10 Cell Reprogramming Service and Product Providers (Industry Players): Distribution by Source Cell for iPSC Generation
- Figure 4.11 Cell Reprogramming Service and Product Providers (Industry Players): Distribution by Source Cell for iPSC Generation and Company size
- Figure 4.12 Cell Reprogramming Service and Product Providers (Industry Players): Distribution by Target Indication
- Figure 4.13 Cell Reprogramming Service and Product Providers (Industry Players): Distribution by Type of Directly Reprogrammed cells
- Figure 4.14 Cell Reprogramming Service and Product Providers (Industry Players): Distribution by Type of Application
- Figure 4.15 Cell Reprogramming Service and Product Providers (Industry Players): Distribution by Type of Additional Service(s) Offered
- Figure 4.16 Cell Reprogramming Service and Product Providers (Non-Industry Players): Distribution by Geographical Location
- Figure 4.17 Cell Reprogramming Service and Product Providers (Non-Industry Players): Distribution by Type of Technology
- Figure 4.18 Cell Reprogramming Service and Product Providers (Non-Industry Players): Distribution by Type of Vector Used
- Figure 4.19 Cell Reprogramming Service and Product Providers (Non-Industry Players): Distribution by Source Cell for iPSC Generation
- Figure 5.1 Competitiveness Analysis of iPSCs Generation Service and Product Providers
- Figure 5.2 Competitiveness Analysis of Direct Reprogramming Service and Product Providers
- Figure 7.1 Clinical Trial Analysis: Scope and Methodology
- Figure 7.2 Clinical Trial Analysis: Distribution by Trial Status
- Figure 7.3 Clinical Trial Analysis: Cumulative Distribution of Trials by Registration Year, Since Pre-2010
- Figure 7.4 Clinical Trial Analysis: Distribution by Trial Phase
- Figure 7.5 Clinical Trial Analysis: Distribution by Number of Patients Enrolled and Trial Registration Year, Since 2011
- Figure 7.6 Clinical Trial Analysis: Distribution by Study Design
- Figure 7.7 Clinical Trial Analysis: Cumulative Year-wise Trend by Trial Recruitment Status
- Figure 7.8 Clinical Trial Analysis: Distribution by Type of Sponsor / Collaborator
- Figure 7.9 Clinical Trial Analysis: Leading Industry Players
- Figure 7.10 Clinical Trial Analysis: Distribution by Focus Area
- Figure 7.11 Clinical Trial Analysis: Distribution by Type of Stem Cell
- Figure 7.12 Clinical Trial Analysis: Cumulative Distribution by Type of Stem Cell and Trial Registration Year
- Figure 7.13 Clinical Trial Analysis: Distribution by Therapeutic Area
- Figure 7.14 Clinical Trial Analysis: Year-Wise Trend in Activity for Popular Therapeutic Areas
- Figure 7.15 Clinical Trial Analysis: Distribution by Patient Enrollment and Therapeutic Area
- Figure 7.16 Clinical Trial Analysis: Year-Wise Trend in Patient Enrollment (in thousands) for Popular Therapeutic Areas
- Figure 7.17 Clinical Trial Analysis: Distribution by Type of Stem Cell and Therapeutic Area
- Figure 7.18 Clinical Trial Analysis: Geographical Distribution by Number of Trials
- Figure 7.19 Clinical Trial Analysis: Geographical Distribution by Trial Registration Year and Recruitment Status
- Figure 7.20 Clinical Trial Analysis: Geographical Distribution by Enrolled Patient Population
- Figure 8.1 Partnerships and Collaborations: Distribution by Year of Partnership
- Figure 8.2 Partnerships and Collaborations: Distribution by Type of Partnership
- Figure 8.3 Partnerships and Collaborations: Distribution by Year of Partnership and Type of Partner
- Figure 8.4 Partnerships and Collaborations: Distribution by Type of Partnership and Type of Partner
- Figure 8.5 Partnerships and Collaborations: Distribution by Type of Stem Cell
- Figure 8.6 Partnerships and Collaborations: Distribution by Target Therapeutic Area
- Figure 8.7 Partnerships and Collaborations: Distribution by Application
- Figure 8.8 Most Active Players: Distribution by Number of Partnerships
- Figure 8.9 Partnerships and Collaborations: Regional Analysis
- Figure 8.10 Partnerships and Collaborations: Intercontinental and Intracontinental Agreement
- Figure 10.1 Global Cell Reprogramming Services and Products Market, Till 2035 (USD Million)
- Figure 10.2 Global Cell Reprogramming Services and Products Market: Distribution by Type of Technology, Till 2035
- Figure 10.3 Cell Reprogramming Services and Products Market for Episomal Reprogramming, Till 2035 (USD Million)
- Figure 10.4 Cell Reprogramming Services and Products Market for mRNA Reprogramming, Till 2035 (USD Million)
- Figure 10.5 Cell Reprogramming Services and Products Market for Sendai Virus-based Reprogramming, Till 2035 (USD Million)
- Figure 10.6 Cell Reprogramming Services and Products Market for Other Reprogramming Technologies, Till 2035 (USD Million)
- Figure 10.7 Global Cell Reprogramming Services and Products Market: Distribution by Source Cell for iPSC Generation, Till 2035
- Figure 10.8 Cell Reprogramming Services and Products Market for Fibroblasts, Till 2035 (USD Million)
- Figure 10.9 Cell Reprogramming Services and Products Market for Peripheral Blood Mononuclear Cells, Till 2035 (USD Million)
- Figure 10.10 Cell Reprogramming Services and Products Market for Unspecified Somatic Cells, Till 2035 (USD Million)
- Figure 10.11 Cell Reprogramming Services and Products Market for Other Cells, Till 2035 (USD Million)
- Figure 10.12 Global Cell Reprogramming Services and Products Market: Distribution by Application, Till 2035
- Figure 10.13 Cell Reprogramming Services and Products Market for Research, Till 2035 (USD Million)
- Figure 10.14 Cell Reprogramming Services and Products Market for Therapeutic Use, Till 2035 (USD Million)
- Figure 10.15 Global Cell Reprogramming Services and Products Market: Distribution by Key Geographical Regions, Till 2035
- Figure 10.16 Cell Reprogramming Services and Products Market in North America, Till 2035 (USD Million)
- Figure 10.17 Cell Reprogramming Services and Products Market in Europe, Till 2035 (USD Million)
- Figure 10.18 Cell Reprogramming Services and Products Market in Asia-Pacific and Rest of the World, Till 2035 (USD Million)
目次
GLOBAL CELL REPROGRAMMING MARKET: OVERVIEW
As per Roots Analysis, the global cell reprogramming market valued at USD 1.16 billion in the current year is anticipated to grow at a CAGR of 8% during the forecast period.
The market sizing and opportunity analysis has been segmented across the following parameters:
Type of Technology
- Sendai Virus-based Reprogramming
- mRNA Reprogramming
- Episomal Reprogramming
- Other Reprogramming Technologies
Type of Source Cell
- Fibroblasts
- Peripheral Blood Mononuclear Cells
- Unspecified Somatic Cells
- Other Cells
Type of Application
- Research
- Therapeutic
Key Geographical Regions
- North America
- Europe
- Asia-Pacific and Rest of the World
GLOBAL CELL REPROGRAMMING MARKET: GROWTH AND TRENDS
Progress in stem cell biology and regenerative medicine over the years has led to the discovery and development of various stem cell-based therapies. However, prevalent challenges concerning the development and use of cell therapies persist, including complex production process, scarcity of healthy cell donors, and concerns associated with donor-recipient haplotype mismatch. Moreover, there are still several ethical barriers when it comes to using human stem cells for research purposes. Consequently, the concept of cell reprogramming has emerged as one of the means to overcome the aforementioned issues and develop safe and effective cell-based therapeutic interventions.
Empowered by technical developments in the field of biotechnology and the market opportunity associated with regenerative medicine, a number of research groups across the world are presently developing innovative ways to reprogram cells. Further, it is worth noting that various start-ups and university spin-offs have emerged as pioneers in this emerging field of therapeutics and are anticipated to maintain the research momentum in the coming years as well.
GLOBAL CELL REPROGRAMMING MARKET: KEY INSIGHTS
The report delves into the current state of global cell reprogramming market and identifies potential growth opportunities within industry. Some key findings from the report include:
- Advances in cell reprogramming have paved way for a plethora of advanced therapeutic and research applications, resulting in lucrative business opportunities for industry and non-industry service provider firms.
- More than 30 companies claim to offer cell reprogramming services and products. Of these, close to 70% are small firms (having less than 50 employees).
- Presently, the majority (~75%) of the service providers claim to offer iPSC generation services, using episomal reprogramming technologies, and are capable of working with various types of cells. This is followed by the companies offering direct reprogramming services (30%).
- It is worth mentioning that majority of stakeholders claim to be using episomal reprogramming for generating iPSCs; other popular cell reprograming approaches include Sendai virus and mRNA-based technologies.
- Numerous companies claim to use more than two technologies for the generation of iPSCs; examples include Applied StemCell, Applied Biological Materials, Creative Bioarray, Lonza and Stemnovate.
- Given the various advantages associated with fibroblasts, such as easy availability, faster proliferation rate and cell robustness, these cells have found maximum (>40%) usage in cell reprogramming.
- Featuring the presence of several small and mid-sized firms, the cell reprogramming landscape is well distributed across various regions; players have established multiple facilities to cater to the needs of their clients.
- North America is a key services hub for cell reprogramming. More than 55% of companies engaged in cell reprogramming are headquartered in North America. This is followed by players based in Europe (45%).
- Prominent facilities within Europe include the UK, Germany, Denmark, Switzerland, France, Portugal and Sweden. Stakeholders are actively expanding their capabilities in order to enhance their respective cell reprogramming service portfolios and, thereby, maintain a competitive edge in this upcoming industry.
- The rising interest in this field is reflected in the number of partnerships, involving a varied range of cell types, inked in the recent past; the maximum partnering activity has been observed in the US.
- Since 2016, the partnership activity has increased at a CAGR of 7%; with the increasing demand for stem cells, both industry and academic players are likely to enter into multiple alliances for cell reprogramming.
- Both established players and new entrants have forged several strategic partnerships in the recent past; majority (>30%) of the deals have primarily been inked for generations of iPSCs, which are further differentiated based on the client's requirement.
- A number of companies have signed multiple deals for cell reprogramming; examples of the firms that have signed over four deals include Cellaria, BlueRock Therapeutics, FUJIFILM Cellular Dynamics and STEMCELL Technologies.
- In the last few years, over 540 clinical trials, evaluating various types of stem cell therapies have been initiated; this highlights the rising demand for iPSC generation and direct reprogramming strategies.
- >70% of these trials were / are being sponsored by small / mid-sized companies to exploit the potential of stem cell therapies to cater to the unmet need in this domain.
- An evaluation of more than 300+ stakeholders engaged in the development of stem cell therapies reveals several likely strategic partners for cell reprogramming service providers, across different geographical regions.
- The market is anticipated to grow at a CAGR of 8% till 2030, and the opportunity is likely to be distributed across different types of technologies, applications and key geographical regions.
- Presently, the majority share of service revenues is generated from projects involving episomal reprogramming technologies.
- In 2030, episomal reprogramming focused projects are anticipated to contribute over 40% of the overall share; it is expected to be followed by revenues generated from projects involving Sendai virus-based reprogramming (30%) and mRNA (25%).
Example Players in the Cell Reprogramming Market
- Allele Biotechnology
- ALSTEM
- Applied Biological Materials
- Axol Bioscience
- Creative Bioarray
- DefiniGEN
- FUJIFILM Cellular Dynamics
- Lonza
- Mogrify
- REPROCELL
- Stemnovate
- Thermo Fisher Scientific
GLOBAL CELL REPROGRAMMING MARKET: RESEARCH COVERAGE
- Market Sizing and Opportunity Analysis: The report features an in-depth analysis of the global cell reprogramming market, focusing on key market segments, including [A] type of technology, [B] type of source cell, [C] type of application and [D] key geographical regions.
- Market Landscape: A comprehensive evaluation of cell reprogramming market, considering various parameters, such as [A] year of establishment, [B] company size, [C] geographical location, [D] location of manufacturing facilities, [E] type of service, [F] type of offering, [G] type of technology, [H] type of vector used, [I] source cell for iPSC generation, [J] target indication(s), [K] type of application and [L] additional service(s) offered.
- Company Competitiveness Analysis: A comprehensive company competitive analysis of iPSC generation and direct reprogramming service providers, examining factors, such as [A] supplier strength and [B] service strength.
- Company Profiles: In-depth profiles of the players that offer cell reprogramming services and products, focusing on [A] company overview, [B] financial information (if available), [C] details on cell reprogramming approaches, [D] types of cell(s) utilized and differentiated, [E] target indication(s), [F] other drug discovery services offered and [G] recent developments and an informed future outlook.
- Clinical Trial Analysis: An insightful analysis more than 540 completed, ongoing and planned clinical studies of various stem cell therapies, based on several parameters, such as [A] trial registration year, [B] phase of development, [C] study design, [D] current trial status, [E] leading industry sponsors, [F] study focus, [G] type of stem cells, [H] target indication(s), [I] target therapeutic area(s), [J] enrolled patient population and [K] regional distribution of trials.
- Partnerships and Collaborations: An insightful analysis of the deals inked by stakeholders in the cell reprogramming market, based on several parameters, such as [A] year of partnership, [B] type of partnership, [C] type of stem cell, [D] target therapeutic area, [E] application, [F] most active players (in terms of the number of partnerships signed) and [G] geography.
- Likely Partnership Opportunities: A detailed discussion on the stem cell therapy developers / manufacturers that are anticipated to partner with cell reprogramming service and product providers in the foreseen future, based on various relevant parameters, such as [A] company size, [B] type of cell (s), [C] indication counts and [D] existing partnership(s).
KEY QUESTIONS ANSWERED IN THIS REPORT
- How many companies are currently engaged in this market?
- Which are the leading companies in this market?
- What factors are likely to influence the evolution of this market?
- What is the current and future market size?
- What is the CAGR of this market?
- How is the current and future market opportunity likely to be distributed across key market segments?
REASONS TO BUY THIS REPORT
- The report provides a comprehensive market analysis, offering detailed revenue projections of the overall market and its specific sub-segments. This information is valuable to both established market leaders and emerging entrants.
- Stakeholders can leverage the report to gain a deeper understanding of the competitive dynamics within the market. By analyzing the competitive landscape, businesses can make informed decisions to optimize their market positioning and develop effective go-to-market strategies.
- The report offers stakeholders a comprehensive overview of the market, including key drivers, barriers, opportunities, and challenges. This information empowers stakeholders to stay abreast of market trends and make data-driven decisions to capitalize on growth prospects.
ADDITIONAL BENEFITS
- Complimentary PPT Insights Packs
- Complimentary Excel Data Packs for all Analytical Modules in the Report
- 15% Free Content Customization
- Detailed Report Walkthrough Session with Research Team
- Free Updated report if the report is 6-12 months old or older
TABLE OF CONTENTS
1. PREFACE
- 1.1. Scope of the Report
- 1.2. Research Methodology
- 1.2.1. Research Assumptions
- 1.2.2. Project Methodology
- 1.2.3. Forecast Methodology
- 1.2.4. Robust Quality Control
- 1.2.5. Key Considerations
- 1.2.5.1. Demographics
- 1.2.5.2. Economic Factors
- 1.2.5.3. Government Regulations
- 1.2.5.4. Supply Chain
- 1.2.5.5. COVID Impact / Related Factors
- 1.2.5.6. Market Access
- 1.2.5.7. Healthcare Policies
- 1.2.5.8. Industry Consolidation
- 1.3 Key Questions Answered
- 1.4. Chapter Outlines
2. EXECUTIVE SUMMARY
3. INTRODUCTION
- 3.1. Chapter Overview
- 3.2. Overview of Stem Cells
- 3.2.1. Classification of Stem Cells
- 3.2.1.1. Based on Source of Stem Cell
- 3.2.1.2. Based on Origin of Stem Cell
- 3.2.1.3. Based on Potency of Stem Cell
- 3.2.2. Routes of Administration of Stem Cell Therapies
- 3.2.3. Applications of Stem Cell Therapies
- 3.2.1. Classification of Stem Cells
- 3.3. Introduction to Cell Reprogramming
- 3.3.1. Cell Reprogramming Approaches and Affiliated Technologies
- 3.4. Applications of Cell Reprogramming
- 3.5. Key Growth Drivers and Constraints
4. CURRENT MARKET LANDSCAPE
- 4.1. Chapter Overview
- 4.2. Cell Reprogramming Service and Product Providers: List of Industry Players
- 4.2.1. Analysis by Year of Establishment
- 4.2.2. Analysis by Company Size
- 4.2.3. Analysis by Geographical Location
- 4.2.4. Analysis by Location of Stem Cell Research Facilities
- 4.2.5. Analysis by Type of Service
- 4.2.6. Analysis by Type of Technology
- 4.2.7. Analysis by Target Indication
- 4.2.8. Analysis by Source Cell
- 4.2.9. Analysis by Application Area
- 4.2.10. Analysis by Additional Service(s) Offered
- 4.2.11. Analysis by Type of Offering
- 4.3. Cell Reprogramming Service and Product Providers: List of Non-Industry Players
- 4.3.1. Analysis by Geographical Location
- 4.3.2. Analysis by Type of Technology Used
- 4.3.3. Analysis by Source Cell for iPSC Generation
- 4.3.4. Analysis by Type of Offering
- 4.4. Cell Reprogramming: List of Affiliated Products Providers
5. COMPANY COMPETITIVENESS ANALYSIS
- 5.1. Chapter Overview
- 5.2. Assumptions and Key Parameters
- 5.3. Methodology
- 5.4. Competitiveness Analysis: iPSC Generation Service and Product Providers
- 5.5. Competitiveness Analysis: Direct Reprogramming Service and Product Providers
6. COMPANY PROFILES
- 6.1. Chapter Overview
- 6.2. Allele Biotechnology
- 6.2.1. Company Overview
- 6.2.2. Recent Developments and Future Outlook
- 6.3. ALSTEM
- 6.3.1. Company Overview
- 6.3.2. Recent Developments and Future Outlook
- 6.4. Applied Biological Materials
- 6.4.1. Company Overview
- 6.4.2. Recent Developments and Future Outlook
- 6.5. Axol Bioscience
- 6.5.1. Company Overview
- 6.5.2. Recent Developments and Future Outlook
- 6.6. Creative Bioarray
- 6.6.1. Company Overview
- 6.6.1.1. Recent Developments and Future Outlook
- 6.6.1. Company Overview
- 6.7. DefiniGEN
- 6.7.1. Company Overview
- 6.7.2. Recent Developments and Future Outlook
- 6.8. FUJIFILM Cellular Dynamics International
- 6.8.1. Company Overview
- 6.8.2. Recent Developments and Future Outlook
- 6.9. Lonza
- 6.9.1. Company Overview
- 6.9.2. Recent Developments and Future Outlook
- 6.10. Mogrify
- 6.10.1. Company Overview
- 6.10.2. Recent Developments and Future Outlook
- 6.11. REPROCELL
- 6.11.1. Company Overview
- 6.11.1.1. Recent Developments and Future Outlook
- 6.11.1. Company Overview
- 6.12. Stemnovate
- 6.12.1. Company Overview
- 6.12.2. Recent Developments and Future Outlook
- 6.14. Thermo fisher Scientific
- 6.14.1. Company Overview
- 6.14.1.1. Recent Developments and Future Outlook
- 6.14.1. Company Overview
7. CASE STUDY: CLINICAL TRIAL ACTIVITY IN STEM CELL THERAPY DEVELOPMENT
- 7.1. Chapter Overview
- 7.2. Scope and Methodology
- 7.3. Stem Cell Therapies: Clinical Trial Analysis
- 7.3.1. Analysis by Trial Registration Year
- 7.3.2. Analysis by Trial Phase
- 7.3.3. Analysis by Number of Patients Enrolled by Trial Registration Year
- 7.3.4. Analysis by Study Design
- 7.3.5. Analysis by Trial Recruitment Status
- 7.3.6. Analysis by Sponsor / Collaborator
- 7.3.7. Leading Industry Sponsors: Analysis by Number of Registered Trials
- 7.3.8. Analysis by Trial Focus
- 7.3.9. Analysis by Type of Stem Cell
- 7.3.10. Analysis by Therapeutic Area
- 7.3.11. Analysis by Type of Stem Cell and Therapeutic Area
- 7.3.12. Geographical Analysis by Number of Clinical Trials
- 7.3.13. Geographical Analysis by Trial Recruitment Status
- 7.3.14. Geographical Analysis by Enrolled Patient Population
8. PARTNERSHIPS AND COLLABORATIONS
- 8.1. Chapter Overview
- 8.2. Scope and Methodology
- 8.3. Cell Reprogramming Services and Products Market: List of Partnerships and Collaborations
- 8.3.1. Analysis by Year of Partnership
- 8.3.2. Analysis by Type of Partnership
- 8.3.3. Analysis by Year of Partnership and Type of Partner
- 8.3.4. Analysis by Type of Partnership and Type of Partner
- 8.3.5. Analysis by Type of Stem Cell
- 8.3.6. Analysis by Target Therapeutic Area
- 8.3.7. Analysis by Application
- 8.3.8. Most Active Players: Analysis by Number of Partnerships
- 8.3.9. Regional Analysis
- 8.3.10. Intercontinental and Intracontinental Agreements
9. LIKELY PARTNERSHIP OPPORTUNITIES
- 9.1. Chapter Overview
- 9.2. Scope and Methodology
- 9.3. Scoring Criteria and Key Assumptions
- 9.4. Stem Cell Therapy Developers: Likely Partners for Cell Reprogramming Service and Product Providers
- 9.4.1. Likely Partners for Cell Reprogramming Service and Product Providers in North America
- 9.4.2. Likely Partners for Cell Reprogramming Service and Product Providers in Europe
- 9.4.3. Likely Partners for Cell Reprogramming Service and Product Providers in Asia-Pacific and Rest of the World
- 9.5. Stem Cell Therapy Contract Manufacturers: Likely Partners for Cell Reprogramming Service and Product Providers
- 9.5.1. Likely Partners for Cell Reprogramming Service and Product Providers in North America
- 9.5.2. Likely Partners for Cell Reprogramming Service and Product Providers in Europe
- 9.5.3. Likely Partners for Cell Reprogramming Service and Product Providers in Asia-Pacific and Rest of the World
10. MARKET FORECAST
- 10.1. Chapter Overview
- 10.2. Scope and Methodology
- 10.3. Forecast Methodology and Key Assumptions
- 10.4. Global Cell Reprogramming Services and Products Market, Till 2035
- 10.4.1. Global Cell Reprogramming Services and Products Market: Distribution by Type of Technology, Till 2035
- 10.4.1.1. Cell Reprogramming Services and Products Market for Episomal Reprogramming, Till 2035
- 10.4.1.2. Cell Reprogramming Services and Products Market for mRNA Reprogramming, Till 2035
- 10.4.1.3. Cell Reprogramming Services and Products Market for Sendai Virus-based Reprogramming, Till 2035
- 10.4.1.4. Cell Reprogramming Services and Products Market for Other Reprogramming Technologies, Till 2035
- 10.4.2. Global Cell Reprogramming Services and Products Market: Distribution by Type of Source Cell, Till 2035
- 10.4.2.1. Cell Reprogramming Services and Products Market for Fibroblasts, Till 2035
- 10.4.2.2. Cell Reprogramming Services and Products Market for Peripheral Blood Mononuclear Cells, Till 2035
- 10.4.2.3. Cell Reprogramming Services and Products Market for Unspecified Somatic Cells, Till 2035
- 10.4.2.4. Cell Reprogramming Services and Products Market for Other Cells, Till 2035
- 10.4.3. Global Cell Reprogramming Services and Products Market: Distribution by Type of Application, Till 2035
- 10.4.3.1. Cell Reprogramming Services and Products Market for Research, Till 2035
- 10.4.3.2. Cell Reprogramming Services and Products Market for Therapeutic, Till 2035
- 10.4.4. Global Cell Reprogramming Services and Products Market: Distribution by Key Geographical Regions, Till 2035
- 10.4.4.1. Cell Reprogramming Services and Products Market in North America, Till 2035
- 10.4.4.2. Cell Reprogramming Services and Products Market in Europe, Till 2035
- 10.4.4.3. Cell Reprogramming Services and Products Market in Asia-Pacific and Rest of the World, Till 2035
- 10.4.1. Global Cell Reprogramming Services and Products Market: Distribution by Type of Technology, Till 2035
11. EXECUTIVE INSIGHTS
- 11.1. Chapter Overview
- 11.2. Company A
- 11.2.1. Company Snapshot
- 11.2.2. Interview Transcript: Co-Founder and Chief Executive Officer
- 11.3. Company B
- 11.3.1. Company Snapshot
- 11.3.2. Interview Transcript: Chief Scientific Officer
12. CONCLUDING REMARKS
13. APPENDIX 1: TABULATED DATA
14. APPENDIX 2: LIST OF COMPANIES AND ORGANIZATIONS
- 発行日
- 発行
- Roots Analysis
- ページ情報
- 英文 293 Pages
- 納期
- 7~10営業日


