
|
市場調査レポート
商品コード
1771293
KRAS市場:業界動向と世界の予測 - 適応症別、分子タイプ別、治療タイプ別、投与経路別、主要地域別KRAS Market: Industry Trends and Global Forecasts - Distribution by Type of Indication, Type of Molecule, Type of Therapy, Route of Administration and Key Geographical Regions |
||||||
カスタマイズ可能
|
|||||||
| KRAS市場:業界動向と世界の予測 - 適応症別、分子タイプ別、治療タイプ別、投与経路別、主要地域別 |
|
出版日: 2025年07月15日
発行: Roots Analysis
ページ情報: 英文 131 Pages
納期: 即日から翌営業日
|

全表示
- 概要
- 図表
- 目次
世界のKRAS市場:概要
世界のKRASの市場規模は今年7,300万米ドルとなりました。同市場は、予測期間中に53.6%のCAGRで拡大する見込みです。
市場セグメンテーションと機会分析は、以下のパラメータでセグメント化されています:
適応症タイプ
- 急性骨髄性白血病
- 大腸がん
- 頭頸部がん
- 肺がん
- 卵巣がん
- 膵臓がん
- フェラン・マクダーミド症候群
- 皮膚がん
分子タイプ
- 生物学的製剤
- 低分子
治療タイプ
- 単剤療法
- 併用療法
投与経路
- 静脈内投与
- 筋肉内投与
- 皮内
- 眼内
- 腹腔内
- 経口
- 皮下
主な地域
- 北米
- 欧州
- アジア太平洋
- 中東・北アフリカ
- ラテンアメリカ
世界のKRA市場:成長と動向
がんは心血管系疾患に次ぐ死亡原因の第2位であり、世界で報告されている死亡原因の6分の1を占めています。国際がん研究機関(IARC)によると、2040年までに新たに発生するがん患者数は、全世界で2,750万人に増加すると予想されています。この疾患による死亡率が高い主な要因は、診断が遅れがちなことであり、その結果、治療が遅れ、患者の生存の可能性が著しく低下します。
従来の治療法ではRAS変異がんの治療に大きな効果を示すことができなかったことから、RAS遺伝子を特異的に標的とする新規薬剤が有望な選択肢として浮上してきました。実際、この分野の薬剤開発者たちは、疾患の発症と進行の主な原因となる特定のがん遺伝子変異を標的とする治療法の開発にますます力を注いでいます。注目すべきは、かつては治療不可能な標的と考えられていたRASが、ヒトのがんの30%に関連していることです。長年にわたり、RAS変異遺伝子を特異的に標的とする数多くの薬剤候補が研究されてきました。さらに、有望な臨床試験結果、多額の資金援助、標的治療法に対する需要の高まりに後押しされ、RAS標的治療薬市場は今後10年間で着実に成長すると予想されています。
世界のKRA市場:主要インサイト
当レポートでは、世界のKRAS市場の現状を調査し、潜在的な成長機会を特定しています。当レポートの主な調査結果は以下の通りです。
- 現在、複数の企業がRAS変異に起因する様々ながんの治療のための新薬候補の開発に従事していると主張しています。
- ほとんどの新薬候補は開発の初期段階で評価されており、単剤または他の製品との併用で、さまざまな投与経路で投与されます。
- 70%以上の治療薬が、単剤または他の製品との併用で、前臨床段階および臨床段階にわたって評価されています。RASを標的とする治療薬の大部分(79%)は経口投与用に設計されています。
- 競争優位性を獲得するため、各地域の企業は、資源と資本の両面で積極的に投資し、自社開発製品の研究開発を行っています。
- ここ数年、この新しいクラスの治療薬に関連する臨床試験の数は、さまざまな地域で大幅に増加しています。
- 臨床研究活動は、登録された試験数で見ると、過去3年間にCAGR5%で増加したと報告されています。総試験数のうち、25%近くはすでに終了していますが、60%は活動中で、現在も患者を募集中です。
- 最近の動向では、多くの企業が新規低分子化合物候補の開発のために戦略的提携を結んでいます。
- その大半は製品ライセンス契約であり、全体の30%以上を占めています。
- 有利なリターンを期待して、多くの公的・民間投資家が過去5年間に数回の資金調達ラウンドにわたって投資を行ってきました。
- そのうち6億米ドル近くがベンチャー・キャピタルによる資金調達で、全体の約40%を占めています。一方、5件以上のIPO/売出しが報告され、これらの企業は合計で7億7,500万米ドル以上の資金を調達しました。
- 過去および現在進行中の研究は、がんを適応症とする治療に焦点を当てたものです。
- みなし大学に所属する著者の大半(80%)は、昨年、KRASに焦点を当てた論文を発表しています。
- 過去数年間で、RAS標的療法に焦点を当てた調査論文を含む論文数は急激に増加しています。
- 発表された論文/記事から、現在の研究活動はRASアイソフォーム、主に変異KRAS遺伝子を標的とすることに集中していることがわかります。
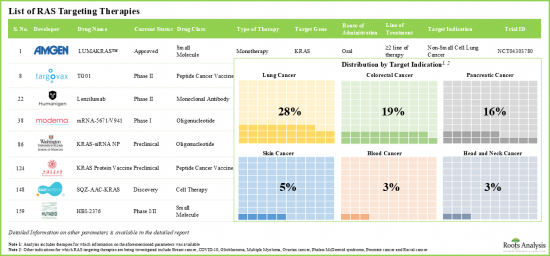
- 出版物の大半は、大腸がん、肺がん、膵臓がんを対象としたRAS標的療法に焦点を当てています。
- 独自の製品を適切に収益化するため、医薬品開発企業は、製品上市サイクルの様々な段階において、多様な商業化戦略を積極的に模索しています。
- がん負担の増大と標的薬物療法に対するニーズの高まりに牽引され、RAS標的療法市場は今後10年間、有利な成長率を示すと予測されています。
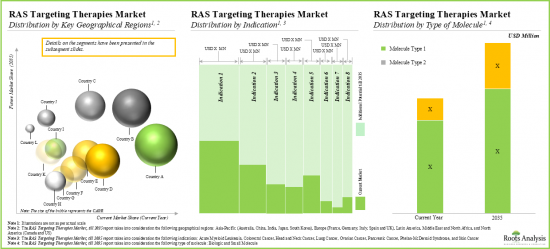
- 全体的な市場機会は、さまざまなタイプの治療薬や投与経路に分散するとみられます。
KRAS市場の参入企業例
- Amgen
- GlobeImmune
- Jacobio Pharmaceuticals
- Mirati Therapeutics
- Novartis
- Onconova Therapeutics
- Targovax
- Verastem Oncology.
世界のKRAS市場
- 市場規模と機会分析:当レポートでは、[A]適応症の種類、[B]分子タイプ、[C]治療タイプ、[D]投与経路、[E]主要地域などの主要市場セグメントに焦点を当て、世界のKRAS市場を詳細に分析しています。
- 市場情勢:A]開発の現状、[B]開発のフェーズ、[C]分子のタイプ、[D]治療のタイプ、[E]標的治療領域、[F]標的遺伝子、[G]治療ライン、[H]投与経路などの様々なパラメータを考慮したRAS標的治療の包括的評価。さらに、[A]設立年、[B]従業員数、[C]地理的プレゼンスなど、いくつかの関連パラメータに基づいて、RAS標的治療薬の開発に従事する企業の包括的な評価も含まれています。
- 臨床試験分析:A]臨床試験登録年、[B]臨床試験フェーズ、[C]臨床試験募集状況、[D]登録患者集団、[E]試験デザイン、[F]主要な業界スポンサー/共同研究者、[G]臨床試験の焦点、[H]標的適応症、[i]最も人気のある適応症、[J]臨床試験の地域分布など、複数の関連パラメータに基づき、様々なRAS標的療法の臨床試験を詳細に分析します。
- 製品の競合分析:A]企業規模、[B]リード分子の開発段階などの要因を検討し、KRAS市場に従事する主要企業の洞察に満ちた競合分析(それぞれの開発ポートフォリオの強さに基づく)。
- 企業プロファイル:A]企業概要、[B]製品ポートフォリオ、[C]最近の動向と情報に基づく将来の見通しに焦点を当て、RAS標的療法を提供する企業の詳細なプロファイル。
- 出版物分析:A]出版年、[B]重点領域、[C]分子タイプ、[D]人気のキーワード、[E]主要ジャーナルに基づき、RAS標的療法の研究に関連する約1,600の査読付き科学論文を包括的に分析。
- パートナーシップと共同研究:A]パートナーシップ締結年、[B]パートナーシップのタイプ、[C]分子のタイプ、[D]最も活発な参入企業(パートナーシップ締結数)、[E]パートナーシップ活動の地域分布など、いくつかのパラメータに基づき、この領域で利害関係者が締結した取引の洞察に満ちた分析。
- 資金調達と投資:A]ベンチャーキャピタルからの資金調達、[B]負債別資金調達、[C]助成金/賞金、[D]IPOによる資金調達、[E]KRAS市場に従事する参入企業が行ったその後の株式公開など、様々な投資の詳細分析。
- 主要な商業化戦略:KRAS市場に参入している医薬品開発企業が、上市前、上市時/上市中、市販後など、市場開拓のさまざまな段階にわたって採用してきたさまざまな商業化戦略について詳述。
当レポートでは、世界のKRAS市場について調査し、市場の概要とともに、適応症別、分子タイプ別、治療タイプ別、投与経路別動向、地域別の動向、および市場に参入する企業のプロファイルなどを提供しています。
目次
第1章 序文
第2章 エグゼクティブサマリー
第3章 イントロダクション
- RAS標的療法の概要
- 変異したRAS遺伝子を標的とするアプローチ
- 歴史的に注目すべき発展
- RAS変異がんにおける顕著な遺伝子ドライバー関連変異
- RAS変異がんの治療における課題と将来展望
第4章 現在の市場情勢
- RAS標的療法:パイプラインレビュー
- RAS標的療法:開発情勢
第5章 臨床試験とエンドポイント分析
- RAS標的療法:臨床試験一覧
第6章 製品競争力分析
- 製品競争力:北米
- 製品競争力:欧州
- 製品競争力:アジア太平洋
第7章 企業プロファイル
- Amgen
- GlobeImmune
- Jacobio Pharmaceuticals
- Mirati Therapeutics
- Novartis
- Onconova Therapeutics
- Targovax
- Verastem Oncology
第8章 出版物の分析
- RAS標的療法:最近の出版物
第9章 パートナーシップとコラボレーション
- RAS標的療法:パートナーシップとコラボレーションのリスト
第10章 資金調達と投資分析
- RAS標的療法:資金調達と投資
第11章 主要な商業化戦略
第12章 市場規模の評価と機会分析
- 予測調査手法と主要な前提条件
- 2035年までの世界のRAS標的療法市場
- 2035年までの世界のRAS標的療法市場:適応症別
- 2035年までの世界のRAS標的療法市場:分子タイプ別
- 2035年までの世界のRAS標的療法市場:治療タイプ別
- 2035年までの世界のRAS標的療法市場:投与経路別
- 2035年までの世界のRAS標的療法市場:地域別
- RAS標的療法:個別製品の売上予測
- LUMAKRASTM(Amgen):売上予測
- アダグラシブ(Mirati Therapeutics):売上予測
- AMO-01(AMO Pharma):売上予測
- アントロキノノール(Golden Biotech):売上予測
- ビニメチニブ(Array Biopharma):売上予測
- CH7126766/VS6766(Verastem Oncology):売上予測
- LXH274(Novartis):売上予測
- リゴセルチブ(Onconova Therapeutics):売上予測
- RMC-4630(Revolution Medicine):売上予測
- TG01(Targovax):売上予測
- ティピファルニブ(Kura Oncology):売上予測
- siG12D(Silenseed):販売予測
第13章 結論
第14章 付録1:表形式データ
第15章 付録2:企業・団体一覧
List of Tables
- Table 4.1 RAS Targeting Therapies: List of Industry and Non-Industry Players
- Table 5.1 RAS Targeting Therapies: List of Clinical Trials
- Table 8.1 RAS Targeting Therapies: List of Recent Publications
- Table 9.1 RAS Targeting Therapies: List of Partnerships and Collaborations
- Table 10.1 RAS Targeting Therapies: List of Funding and Investments
- Table 14.1 RAS Targeting Therapies: Distribution by Phase of Development
- Table 14.2 RAS Targeting Therapies: Distribution by Route of Administration
- Table 14.3 RAS Targeting Therapies: Distribution by Line of Treatment and Type of Therapy
- Table 14.4 RAS Targeting Therapies: Distribution by Type of Molecule
- Table 14.5 RAS Targeting Therapies: Distribution by Phase of Development and Type of Molecule
- Table 14.6 RAS Targeting Therapies: Distribution by Type of Molecule and Route of Administration
- Table 14.7 RAS Targeting Therapies: Distribution by Target Gene and Target Indication
- Table 14.8 Most Active Players: Distribution by Number of Trials Registered
- Table 14.9 RAS Targeting Therapy Developers: Distribution by Year of Establishment
- Table 14.10 RAS Targeting Therapy Developers: Distribution by Company Size
- Table 14.11 RAS Targeting Therapy Developers: Distribution by Location of Headquarters
- Table 14.12 RAS Targeting Therapy Developers: Distribution by Geography
- Table 14.13 Clinical Trial Analysis: Cumulative Distribution of Trials by Trial Registration Year
- Table 14.14 Clinical Trial Analysis: Distribution by Type of Masking and Intervention Model Adopted
- Table 14.15 Clinical Trial Analysis: Distribution by Study Design and Trial Status
- Table 14.16 Clinical Trial Analysis: Distribution by Type of Sponsor
- Table 14.17 Most Active Players: Distribution by Number of Clinical Trials
- Table 14.18 Clinical Trial Analysis: Distribution by Trial Registration Year and Geography
- Table 14.19 Clinical Trial Analysis: Distribution by Target Indication
- Table 14.20 Clinical Trial Analysis: Distribution of Number of Trials by Geography
- Table 14.21 Clinical Trial Analysis: Distribution by Trial Registration Year and Enrolled Patients Population
- Table 14.22 Clinical Trial Analysis: Distribution by Geography, Patients Enrolled and Trial Status
- Table 14.23 Clinical Trial Analysis: Distribution by Patients Enrolled and Phase of Development
- Table 14.24 Product Competitiveness Analysis: North America Scenario
- Table 14.25 Product Competitiveness Analysis: Europe Scenario
- Table 14.26 Product Competitiveness Analysis: Asia-Pacific Scenario
- Table 14.27 Amgen: Financial Information
- Table 14.28 GlobeImmune: Financial Information
- Table 14.29 Jacobio Pharmaceuticals: Financial Information
- Table 14.30 Mirati Therapeutics: Financial Information
- Table 14.31 Novartis: Financial Information
- Table 14.32 Onconova Therapeutics: Financial Information
- Table 14.33 Targovax: Financial Information
- Table 14.34 Verastem Oncology: Financial Information
- Table 14.35 Publication Analysis: Distribution by Year of Publication
- Table 14.36 Publication Analysis: Distribution by Type of Publication
- Table 14.37 Publication Analysis: Distribution by Study Objective
- Table 14.38 Publication Analysis: Distribution by Emerging Focus Area
- Table 14.39 Publication Analysis: Distribution by Target Gene
- Table 14.40 Publication Analysis: Distribution by Target Therapeutic Area
- Table 14.41 Publication Analysis: Distribution by Target Indication
- Table 14.42 Publication Analysis: Distribution by Affiliation of First Author
- Table 14.43 Most Active Players: Distribution by Number of Publications
- Table 14.44 Key Journals: Distribution by Number of Publications
- Table 14.45 Partnerships and Collaborations: Distribution by Year of Partnership
- Table 14.46 Partnerships and Collaborations: Distribution by Type of Partnership
- Table 14.47 Partnerships and Collaborations: Distribution by Type of Partner
- Table 14.48 Partnerships and Collaborations: Distribution by Type of Molecule
- Table 14.49 Most Active Players: Distribution by Number of Partnerships
- Table 14.50 Most Active Partners: Distribution by Number of Partnerships
- Table 14.51 Partnerships and Collaborations: Intercontinental and Intracontinental Agreements
- Table 14.52 Funding and Investment Analysis: Cumulative Year-wise Distribution by Amount Invested, Since 2016
- Table 14.53 Funding and Investment Analysis: Distribution by Type of Funding
- Table 14.54 Funding and Investment Analysis: Distribution by Year and Type of Funding
- Table 14.55 Funding and Investment Analysis: Distribution by Year, Amount Invested and Type of Funding, Since 2016 (USD Million)
- Table 14.56 Funding and Investment Analysis: Distribution of Total Amount Invested by Type of Funding (USD Million)
- Table 14.57 Key Investors: Distribution by Number of Funding Instances
- Table 14.58 Funding and Investment Analysis: Distribution of Amount Invested by Geography (USD Million)
- Table 14.59 Key Commercialization Strategies: Harvey Ball Analysis
- Table 14.60 Successful Drug Launch Strategy: ROOTS Framework
- Table 14.61 Historical Strategies Adopted by the Developer of LUMAKRAS(TM)
- Table 14.62 Successful Drug Launch Strategy: Product Differentiation
- Table 14.63 Commonly Adopted Commercialization Strategies based on Development Stage of the Product
- Table 14.64 Harvey Ball Analysis: Commercialization Strategies Adopted by RAS Targeting Therapy Developers
- Table 14.65 RAS Targeting Therapies Market, Till 2035 (USD Million)
- Table 14.66 RAS Targeting Therapies Market: Distribution by Type of Molecule / Drug Class (USD Million)
- Table 14.67 RAS Targeting Therapies Market: Distribution by Type of Therapy (USD Million)
- Table 14.68 RAS Targeting Therapies Market: Distribution by Route of Administration (USD Million)
- Table 14.69 RAS Targeting Therapies Market: Distribution by Location of Headquarters (USD Million)
- Table 14.70 LUMAKRAS(TM) (Amgen): Estimated Sales, Till 2035 (USD Million)
- Table 14.71 Adagrasib (Mirati Therapeutics): Estimated Sales, Till 2035 (USD Million)
- Table 14.72 AMO-01 (AMO Pharma): Estimated Sales, Till 2035 (USD Million)
- Table 14.73 Antroquinonol (Golden Biotech): Estimated Sales, Till 2035 (USD Million)
- Table 14.74 Binimetinib (Array Biopharma): Estimated Sales, Till 2035 (USD Million)
- Table 14.75 CH7146766/VS6766 (Verastem Oncology): Estimated Sales, Till 2035 (USD Million)
- Table 14.76 LXH274 (Novartis): Estimated Sales, Till 2035 (USD Million)
- Table 14.77 Rigosertib (Onconova Therapeutics): Estimated Sales, Till 2035 (USD Million)
- Table 14.78 RMC-4630 (Revolution Medicine): Estimated Sales, Till 2035 (USD Million)
- Table 14.79 TG01 (Targovax): Estimated Sales, Till 2035 (USD Million)
- Table 14.80 Tipifarnib (Kura Oncology): Estimated Sales, Till 2035 (USD Million)
- Table 14.81 siG14D (Silenseed): Estimated Sales, Till 2035 (USD Million)
- Table 14.82 RAS Targeting Therapies: Distribution by Target Therapeutic Area
- Table 14.83 RAS Targeting Therapies: Distribution by Type of Molecule and Company Size
- Table 14.84 RAS Targeting Therapies: Distribution by Company Size and Region
- Table 14.85 Most Active Players: Distribution by Number of Products
- Table 14.86 Clinical Trial Analysis: Distribution by Trial Registration Year and Trial Status
- Table 14.87 Clinical Trial Analysis: Distribution by Phase of Development, Year and Number of Patients
- Table 14.88 Clinical Trial Analysis: Distribution by Number of Trials, Trial Status and Region
- Table 14.89 Clinical Trial Analysis: Distribution by Primary Purpose
- Table 14.90 Funding and Investment Analysis: Cumulative Number of Funding Instances by Year, Since 2016
- Table 14.91 Funding and Investment Analysis: Cumulative Amount Invested, Since 2016 (USD Million)
- Table 14.92 Funding and Investment Analysis: Distribution by Amount Invested and Type of Funding, Since 2016
- Table 14.93 Funding and Investment Analysis: Distribution of Funding Instances by Geography
- Table 14.94 Funding and Investment Analysis: Distribution by Amount Invested and Type of Funding, Since 2016
- Table 14.95 Most Active Players: Distribution by Number of Funding Instances, Since 2016
- Table 14.96 Funding and Investment Analysis: Distribution of Recipient Companies by Year of Establishment and Type of Funding, Since 2016
List of Figures
- Figure 3.1 Approaches for Targeting Mutated RAS Gene
- Figure 3.2 Notable Developments within the RAS Targeting Therapies Domain
- Figure 3.3 Prominent Gene Driver related Mutations in RAS Mutated Cancers
- Figure 3.4 Key Challenges Associated with Targeting and Treatment of RAS Mutated Cancers
- Figure 3.5 Future Perspectives of RAS Targeting Therapies
- Figure 4.1 RAS Targeting Therapies: Distribution by Phase of Development
- Figure 4.2 RAS Targeting Therapies: Distribution by Route of Administration
- Figure 4.3 RAS Targeting Therapies: Distribution by Line of Treatment and Type of Therapy
- Figure 4.4 RAS Targeting Therapies: Distribution by Type of Molecule
- Figure 4.5 RAS Targeting Therapies: Distribution by Phase of Development and Type of Molecule
- Figure 4.6 RAS Targeting Therapies: Distribution by Type of Molecule and Route of Administration
- Figure 4.7 RAS Targeting Therapies: Distribution by Target Gene and Target Indication
- Figure 4.8 Most Active Players: Distribution by Number of Trials Registered
- Figure 4.9 RAS Targeting Therapy Developers: Distribution by Year of Establishment
- Figure 4.10 RAS Targeting Therapy Developers: Distribution by Company Size
- Figure 4.11 RAS Targeting Therapy Developers: Distribution by Location of Headquarters
- Figure 4.12 RAS Targeting Therapy Developers: Distribution by Geography
- Figure 5.1 Clinical Trial Analysis: Cumulative Distribution of Trials by Trial Registration Year
- Figure 5.2 Clinical Trial Analysis: Distribution by Type of Masking and Intervention Model Adopted
- Figure 5.3 Clinical Trial Analysis: Distribution by Study Design and Trial Status
- Figure 5.4 Clinical Trial Analysis: Distribution by Type of Sponsor
- Figure 5.5 Most Active Players: Distribution by Number of Clinical Trials
- Figure 5.6 Clinical Trial Analysis: Distribution by Trial Registration Year and Geography
- Figure 5.7 Clinical Trial Analysis: Distribution by Target Indication
- Figure 5.8 Clinical Trial Analysis: Distribution of Number of Trials by Geography
- Figure 5.9 Clinical Trial Analysis: Distribution by Trial Registration Year and Enrolled Patients Population
- Figure 5.10 Clinical Trial Analysis: Distribution by Geography, Patients Enrolled and Trial Status
- Figure 5.11 Clinical Trial Analysis: Distribution by Patients Enrolled and Phase of Development
- Figure 6.1 Product Competitiveness Analysis: North America Scenario
- Figure 6.2 Product Competitiveness Analysis: Europe Scenario
- Figure 6.3 Product Competitiveness Analysis: Asia-Pacific Scenario
- Figure 7.1 Amgen: Financial Information
- Figure 7.2 GlobeImmune: Financial Information
- Figure 7.3 Jacobio Pharmaceuticals: Financial Information
- Figure 7.4 Mirati Therapeutics: Financial Information
- Figure 7.5 Novartis: Financial Information
- Figure 7.6 Onconova Therapeutics: Financial Information
- Figure 7.7 Targovax: Financial Information
- Figure 7.8 Verastem Oncology: Financial Information
- Figure 8.1 Publication Analysis: Distribution by Year of Publication
- Figure 8.2 Publication Analysis: Distribution by Type of Publication
- Figure 8.3 Publication Analysis: Distribution by Study Objective
- Figure 8.4 Publication Analysis: Distribution by Emerging Focus Area
- Figure 8.5 Publication Analysis: Distribution by Target Gene
- Figure 8.6 Publication Analysis: Distribution by Target Therapeutic Area
- Figure 8.7 Publication Analysis: Distribution by Target Indication
- Figure 8.8 Publication Analysis: Distribution by Affiliation of First Author
- Figure 8.9 Most Active Players: Distribution by Number of Publications
- Figure 8.10 Key Journals: Distribution by Number of Publications
- Figure 9.1 Partnerships and Collaborations: Distribution by Year of Partnership
- Figure 9.2 Partnerships and Collaborations: Distribution by Type of Partnership
- Figure 9.3 Partnerships and Collaborations: Distribution by Type of Partner
- Figure 9.4 Partnerships and Collaborations: Distribution by Type of Molecule
- Figure 9.5 Most Active Players: Distribution by Number of Partnerships
- Figure 9.6 Most Active Partners: Distribution by Number of Partnerships
- Figure 9.7 Partnerships and Collaborations: Intercontinental and Intracontinental Agreements
- Figure 10.1 Funding and Investment Analysis: Cumulative Year-wise Distribution by Amount Invested, Since 2016
- Figure 10.2 Funding and Investment Analysis: Distribution by Type of Funding
- Figure 10.3 Funding and Investment Analysis: Distribution by Year and Type of Funding
- Figure 10.4 Funding and Investment Analysis: Distribution by Year, Amount Invested and Type of Funding, Since 2016 (USD Million)
- Figure 10.5 Funding and Investment Analysis: Distribution of Total Amount Invested by Type of Funding (USD Million)
- Figure 10.6 Key Investors: Distribution by Number of Funding Instances
- Figure 10.7 Funding and Investment Analysis: Distribution of Amount Invested by Geography (USD Million)
- Figure 11.1 Key Commercialization Strategies: Harvey Ball Analysis
- Figure 11.2 Successful Drug Launch Strategy: ROOTS Framework
- Figure 11.3 Historical Strategies Adopted by the Developer of LUMAKRAS(TM)
- Figure 11.4 Successful Drug Launch Strategy: Product Differentiation
- Figure 11.5 Commonly Adopted Commercialization Strategies based on Development Stage of the Product
- Figure 11.6 Harvey Ball Analysis: Commercialization Strategies Adopted by RAS Targeting Therapy Developers
- Figure 12.1 RAS Targeting Therapies Market, Till 2035 (USD Million)
- Figure 12.2 RAS Targeting Therapies Market: Distribution by Type of Molecule / Drug Class (USD Million)
- Figure 12.3 RAS Targeting Therapies Market: Distribution by Type of Therapy (USD Million)
- Figure 12.4 RAS Targeting Therapies Market: Distribution by Route of Administration (USD Million)
- Figure 12.5 RAS Targeting Therapies Market: Distribution by Location of Headquarters (USD Million)
- Figure 12.6 LUMAKRAS(TM) (Amgen): Estimated Sales, Till 2035 (USD Million)
- Figure 12.7 Adagrasib (Mirati Therapeutics): Estimated Sales, Till 2035 (USD Million)
- Figure 12.8 AMO-01 (AMO Pharma): Estimated Sales, Till 2035 (USD Million)
- Figure 12.9 Antroquinonol (Golden Biotech): Estimated Sales, Till 2035 (USD Million)
- Figure 12.10 Binimetinib (Array Biopharma): Estimated Sales, Till 2035 (USD Million)
- Figure 12.11 CH7126766/VS6766 (Verastem Oncology): Estimated Sales, Till 2035 (USD Million)
- Figure 12.12 LXH274 (Novartis): Estimated Sales, Till 2035 (USD Million)
- Figure 12.13 Rigosertib (Onconova Therapeutics): Estimated Sales, Till 2035 (USD Million)
- Figure 12.14 RMC-4630 (Revolution Medicine): Estimated Sales, Till 2035 (USD Million)
- Figure 12.15 TG01 (Targovax): Estimated Sales, Till 2035 (USD Million)
- Figure 12.16 Tipifarnib (Kura Oncology): Estimated Sales, Till 2035 (USD Million)
- Figure 12.17 siG12D (Silenseed): Estimated Sales, Till 2035 (USD Million)
- Figure 13.1 RAS Targeting Therapies: Distribution by Target Therapeutic Area
- Figure 13.2 RAS Targeting Therapies: Distribution by Type of Molecule and Company Size
- Figure 13.3 RAS Targeting Therapies: Distribution by Company Size and Region
- Figure 13.4 Most Active Players: Distribution by Number of Products
- Figure 13.5 Clinical Trial Analysis: Distribution by Trial Registration Year and Trial Status
- Figure 13.6 Clinical Trial Analysis: Distribution by Phase of Development, Year and Number of Patients
- Figure 13.7 Clinical Trial Analysis: Distribution by Number of Trials, Trial Status and Region
- Figure 13.8 Clinical Trial Analysis: Distribution by Primary Purpose
- Figure 13.9 Funding and Investment Analysis: Cumulative Number of Funding Instances by Year, Since 2016
- Figure 13.10 Funding and Investment Analysis: Cumulative Amount Invested, Since 2016 (USD Million)
- Figure 13.11 Funding and Investment Analysis: Distribution by Amount Invested and Type of Funding, Since 2016
- Figure 13.12 Funding and Investment Analysis: Distribution of Funding Instances by Geography
- Figure 13.13 Funding and Investment Analysis: Distribution by Amount Invested and Type of Funding, Since 2016
- Figure 13.14 Most Active Players: Distribution by Number of Funding Instances, Since 2016
- Figure 13.15 Funding and Investment Analysis: Distribution of Recipient Companies by Year of Establishment and Type of Funding, Since 2016
GLOBAL KRAS MARKET: OVERVIEW
As per Roots Analysis, the global KRAS market valued at USD 73 million in the current year is expected to grow at a CAGR of 53.6% during the forecast period.
The market sizing and opportunity analysis has been segmented across the following parameters:
Type of Indication
- Acute Myeloid Leukemia
- Colorectal Cancer
- Head and Neck Cancer
- Lung Cancer
- Ovarian Cancer
- Pancreatic Cancer
- Phelan-McDermid Syndrome
- Skin Cancer
Type of Molecule
- Biologic
- Small Molecule
Type of Therapy
- Monotherapy
- Combination Therapy
Route of Administration
- Intravenous
- Intramuscular
- Intradermal
- Intraocular
- Intraperitoneal
- Oral
- Subcutaneous
Key Geographical Regions
- North America
- Europe
- Asia-Pacific
- Middle East and North Africa
- Latin America
GLOBAL KRAS MARKET: GROWTH AND TRENDS
Cancer is considered to be the second leading cause of mortality, after cardiovascular diseases, accounting for every sixth reported death in the world. The International Agency for Research on Cancer (IARC) states that the number of new cancer cases is expected to grow to 27.5 million across the globe, by 2040. A major factor contributing to the high mortality rate associated with this condition is the tendency for late diagnosis, which in turn delays treatment and significantly reduces the patient's chances of survival.
Given that conventional therapies have been unable to exhibit significant efficacy in the treatment of RAS mutated cancers, novel drugs, specifically targeting the RAS gene, have emerged as a promising alternative. In fact, drug developers in this field are increasingly focusing on creating therapies that target specific oncogenic mutations primarily responsible for the onset and progression of the disease. Notably, RAS which was once considered to be an undruggable target, has been linked to 30% of human cancer. Over the years, numerous drug candidates have been investigated to specifically target RAS-mutated genes. Additionally, driven by encouraging clinical trial results, substantial financial assistance, and growing demand for targeted therapeutic modalities, the RAS targeting therapies market is anticipated to witness steady growth over the next decade
GLOBAL KRAS MARKET: KEY INSIGHTS
The report delves into the current state of global KRAS market and identifies potential growth opportunities within industry. Some key findings from the report include:
- Presently, several companies claim to be engaged in the development of novel drug candidates for the treatment of various cancers originating due to RAS mutations.
- Most of the drug candidates are being evaluated in early stages of development, either as monotherapies or in combination with other products, for delivery via different administration routes.
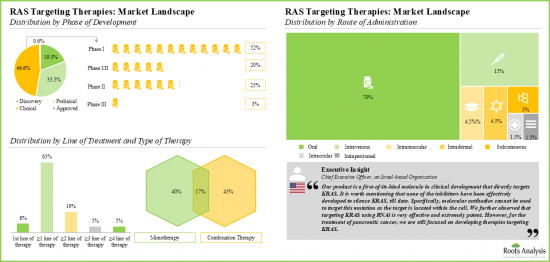
- Over 70% of the therapies are being evaluated across preclinical and clinical stages, either as monotherapies or in combination with other products. Majority of the RAS targeting therapies (79%) are designed for administration via the oral route.
- In pursuit of gaining a competitive edge, firms located in different regions are actively investing, in terms of both resources and capital, to conduct R&D of their proprietary products.
- Over the years, there has been significant increase in number of clinical trials related to this novel class of therapies, across different geographies.
- Clinical research activity, in terms of the number of trials registered, is reported to have increased at a CAGR of 5%, in the past three years. Of the total number of trials, close to 25% of the studies have already been completed, while 60% are active and still recruiting patients.
- In recent years, a large number of companies have recently entered into strategic collaborations for the development of novel small molecule candidates.
- Majority of the deals were reported to be product licensing agreements, representing over 30% of the total number of instances.
- Foreseeing lucrative returns, many public and private investors have made investments across several funding rounds, in the last five years.
- Of the total, close to USD 600 million was raised through venture capital financing, representing around 40% of the overall share. On the other hand, over 5 instances of IPOs / secondary offerings were reported, wherein players collectively raised more than USD 775 million in financing.
- Both industry players and academic institutes have made significant contributions towards expanding the pool of published scientific literature; past and ongoing studies were focused on treatment of cancer indications.
- Majority of the authors affiliated with deemed universities have published articles focused on KRAS (80%), in the last year.
- In the past years, there has been an exponential increase in the number of publications, including research articles focused on RAS targeting therapies.
- Published articles / papers indicate that the current research activity is focused on targeting RAS isoforms, primarily mutated KRAS gene.
- Majority of the publications are focused on RAS targeting therapies intended for colorectal cancer, lung cancer and pancreatic cancer.
- In order to adequately monetize their proprietary offerings, drug developers are actively exploring diverse commercialization strategies across various stages of a product's launch cycle.
- Driven by the growing cancer burden and rising need for targeted drug therapies, the RAS targeted therapies market is projected to grow at a lucrative rate over the coming decade.
- The overall market opportunity is likely to be distributed across different types of therapies and routes of administration.
Example Players in the KRAS Market
- Amgen
- GlobeImmune
- Jacobio Pharmaceuticals
- Mirati Therapeutics
- Novartis
- Onconova Therapeutics
- Targovax
- Verastem Oncology.
GLOBAL KRAS MARKET
- Market Sizing and Opportunity Analysis: The report features an in-depth analysis of the global KRAS market, focusing on key market segments, including [A] type of indication, [B] type of molecule, [C] type of therapy, [D] route of administration and [E] key geographical regions.
- Market Landscape: A comprehensive evaluation of RAS targeting therapies, considering various parameters, such as [A] current status of development, [B] phase of development, [C] type of molecule, [D] type of therapy, [E] target therapeutic area, [F] target gene, [G] line of treatment and [H] route of administration. Additionally, the section includes a comprehensive evaluation of companies engaged in the development of RAS targeting therapies, based on several relevant parameters, such as [A] year of establishment, [B] employee count and [C] geographical presence.
- Clinical Trial Analysis: An in-depth analysis of clinical trials of various RAS targeting therapies, based on several relevant parameters, such as [A] trial registration year, [B] trial phase, [C] trial recruitment status, [D] enrolled patient population, [E] study design, [F] leading industry sponsors / collaborators, [G] trial focus, [H] target indication, [I] most popular indications and [J] regional distribution of trials.
- Product Competitiveness Analysis: An insightful competitive analysis of key players engaged in KRAS market (on the basis of the strength of their respective development portfolios), examining factors, such as [A] company size and [B] stage of development of lead molecules.
- Company Profiles: In-depth profiles of companies engaged in offering RAS targeting therapies, focusing on [A] company overview, [B] product portfolio and [C] recent developments and an informed future outlook.
- Publication Analysis: A comprehensive analysis of close to 1,600 peer-reviewed scientific articles related to research on RAS targeting therapies, based on [A] year of publication, [B] focus areas, [C] type of molecule, [D] popular keywords and [E] key journals.
- Partnerships and Collaborations: An insightful analysis of the deals inked by stakeholders in this domain, based on several parameters, such as [A] year of partnership, [B] type of partnership, [C] type of molecule, [D] most active players (in terms of the number of partnerships signed) and [E] geographical distribution of partnership activity.
- Funding and Investments: An in-depth analysis of various investments, such as [A] venture capital financing, [B] debt financing, [C] grants / awards, [D] capital raised from IPOs and [E] subsequent offerings that were undertaken by players engaged in KRAS market.
- Key Commercialization Strategies: A detailed discussion on the various commercialization strategies that have been adopted by drug developers engaged in KRAS market across different stages of therapy development, including pre-drug launch, at / during drug launch and post-marketing stage.
KEY QUESTIONS ANSWERED IN THIS REPORT
- How many companies are currently engaged in this market?
- Which are the leading companies in this market?
- What factors are likely to influence the evolution of this market?
- What is the current and future market size?
- What is the CAGR of this market?
- How is the current and future market opportunity likely to be distributed across key market segments?
REASONS TO BUY THIS REPORT
- The report provides a comprehensive market analysis, offering detailed revenue projections of the overall market and its specific sub-segments. This information is valuable to both established market leaders and emerging entrants.
- Stakeholders can leverage the report to gain a deeper understanding of the competitive dynamics within the market. By analyzing the competitive landscape, businesses can make informed decisions to optimize their market positioning and develop effective go-to-market strategies.
- The report offers stakeholders a comprehensive overview of the market, including key drivers, barriers, opportunities, and challenges. This information empowers stakeholders to stay abreast of market trends and make data-driven decisions to capitalize on growth prospects.
ADDITIONAL BENEFITS
- Complimentary PPT Insights Packs
- Complimentary Excel Data Packs for all Analytical Modules in the Report
- 15% Free Content Customization
- Detailed Report Walkthrough Session with Research Team
- Free Updated report if the report is 6-12 months old or older
TABLE OF CONTENTS
1. PREFACE
- 1.1. Scope of the Report
- 1.2. Research Methodology
- 1.2.1. Research Assumptions
- 1.2.2. Project Methodology
- 1.2.3. Forecast Methodology
- 1.2.4. Robust Quality Control
- 1.2.5. Key Considerations
- 1.2.5.1. Demographics
- 1.2.5.2. Economic Factors
- 1.2.5.3. Government Regulations
- 1.2.5.4. Supply Chain
- 1.2.5.5. COVID Impact / Related Factors
- 1.2.5.6. Market Access
- 1.2.5.7. Healthcare Policies
- 1.2.5.8. Industry Consolidation
- 1.3 Key Questions Answered
- 1.4. Chapter Outlines
2. EXECUTIVE SUMMARY
3. INTRODUCTION
- 3.1. Overview of RAS Targeting Therapies
- 3.2. Approaches Used to Target Mutated RAS Gene
- 3.3. Historical Notable Developments
- 3.4. Prominent Gene Driver Related Mutations in RAS Mutated Cancers
- 3.5. Challenges and Future Perspectives Associated with Treatment of RAS Mutated Cancers
4. CURRENT MARKET LANDSCAPE
- 4.1. RAS Targeting Therapies: Pipeline Review
- 4.1.1. Analysis by Phase of Development
- 4.1.2. Analysis by Route of Administration
- 4.1.3. Analysis by Line of Treatment
- 4.1.4. Analysis by Type of Therapy
- 4.1.5. Analysis by Type of Molecule
- 4.1.6. Analysis by Target Gene
- 4.1.7. Analysis by Target Therapeutic Area
- 4.1.8. Analysis by Phase of Development and Leading Players
- 4.2. RAS Targeting Therapies: Developer Landscape
- 4.2.1. Analysis by Year of Establishment
- 4.2.2. Analysis by Company Size
- 4.2.3. Analysis by Location of Headquarters
- 4.2.4. Analysis by Geography
5. CLINICAL TRIALS AND ENDPOINT ANALYSIS
- 5.1. RAS Targeting Therapies: List of Clinical Trials
- 5.1.1. Analysis by Trial Status
- 5.1.2. Analysis by Trial Registration Year
- 5.1.3. Analysis by Type of Masking
- 5.1.4. Analysis by Type of Intervention Model
- 5.1.5. Analysis by Study Design
- 5.1.6. Analysis by Type of Sponsor
- 5.1.7. Most Active Players: Analysis by Number of Trials Registered
- 5.1.8. Analysis by Trial Registration Year and Geography
- 5.1.9. Analysis by Type of Target Indication
- 5.1.10. Analysis by Enrolled Patient Population
- 5.1.11. Analysis of Enrolled Patient Population by Geography
- 5.1.12. Analysis of Number of Clinical Trials by Geography
6. PRODUCT COMPETITIVENESS ANALYSIS
- 6.1. Product Competitiveness: North America
- 6.2. Product Competitiveness: Europe
- 6.3. Product Competitiveness: Asia-Pacific
7. COMPANY PROFILES
- 7.1. Amgen
- 7.1.1. Company Overview
- 7.1.2. Financial Information
- 7.1.3. Portfolio of RAS Targeting Therapies
- 7.1.4. Recent Developments and Future Outlook
- 7.2. GlobeImmune
- 7.2.1. Company Overview
- 7.2.2. Financial Information
- 7.2.3. Portfolio of RAS Targeting Therapies
- 7.2.4. Recent Developments and Future Outlook
- 7.3. Jacobio Pharmaceuticals
- 7.3.1. Company Overview
- 7.3.2. Financial Information
- 7.3.3. Portfolio of RAS Targeting Therapies
- 7.3.4. Recent Developments and Future Outlook
- 7.4. Mirati Therapeutics
- 7.4.1. Company Overview
- 7.4.2. Financial Information
- 7.4.3. Portfolio of RAS Targeting Therapies
- 7.4.4. Recent Developments and Future Outlook
- 7.5. Novartis
- 7.5.1. Company Overview
- 7.5.2. Financial Information
- 7.5.3. Portfolio of RAS Targeting Therapies
- 7.5.4. Recent Developments and Future Outlook
- 7.6. Onconova Therapeutics
- 7.6.1. Company Overview
- 7.6.2. Financial Information
- 7.6.3. Portfolio of RAS Targeting Therapies
- 7.6.4. Recent Developments and Future Outlook
- 7.7. Targovax
- 7.7.1. Company Overview
- 7.7.2. Financial Information
- 7.7.3. Portfolio of RAS Targeting Therapies
- 7.7.4. Recent Developments and Future Outlook
- 7.8. Verastem Oncology
- 7.8.1. Company Overview
- 7.8.2. Financial Information
- 7.8.3. Portfolio of RAS Targeting Therapies
- 7.8.4. Recent Developments and Future Outlook
8. PUBLICATION ANALYSIS
- 8.1. RAS Targeting Therapies: Recent Publications
- 8.1.1. Analysis by Year of Publication
- 8.1.2. Analysis by Type of Publication
- 8.1.3. Analysis by Study Objective
- 8.1.4. Analysis by Emerging Focus Areas
- 8.1.5. Analysis by Target Therapeutic Area
- 8.1.6. Analysis by Target Gene
- 8.1.7. Analysis by Target Indication
- 8.1.8. Analysis by Affiliation of First Author
- 8.1.9. Leading Players: Analysis by Number of Publications
- 8.1.10. Key Journals: Analysis by Number of Publications
9. PARTNERHSIPS AND COLLABORATIONS
- 9.1. RAS Targeting Therapies: List of Partnerships and Collaborations
- 9.1.1. Analysis by Year of Partnership
- 9.1.2. Analysis by Type of Partnership
- 9.1.3. Analysis by Type of Partner
- 9.1.4. Analysis by Type of Molecule
- 9.1.5. Most Active Players: Analysis by Number of Partnerships
- 9.1.6. Most Active Partners: Analysis by Number of Partnerships
- 9.1.7. Regional Analysis
- 9.1.8. Intercontinental and Intracontinental Agreements
10. FUNDING AND INVESTMENT ANALYSIS
- 10.1. RAS Targeting Therapies: Funding and Investments
- 10.1.1. Analysis by Number of Funding Instances
- 10.1.2. Analysis by Amount Invested
- 10.1.3. Analysis by Type of Funding
- 10.1.4. Most Active Players: Analysis by Amount Raised
- 10.1.5. Most Active Investors: Analysis by Number of Instances
- 10.1.6. Analysis by Geography
11. KEY COMMERCIALIZATION STRATEGIES
- 11.1. Successful Drug Launch Strategy: ROOTS Framework
- 11.2. Successful Drug Launch Strategy: Product Differentiation
- 11.3. Commonly Adopted Commercialization Strategies based on the Development Stage of the Product
- 11.4. Key Commercialization Strategies Adopted by Companies Focused on RAS Targeting Therapies
- 11.4.1. Strategies Adopted Before Therapy Approval
- 11.5. Strategies Adopted During / Post Therapy Approval
- 11.6. Analysis by Ease of Implementation, Value Addition and Current Adoption (Harvey Ball Framework)
12. MARKET SIZING AND OPPORTUNITY ANALYSIS
- 12.1. Forecast Methodology and Key Assumptions
- 12.2. Global RAS Targeting Therapies Market, Till 2035
- 12.3. Global RAS Targeting Therapies Market, Till 2035: Distribution by Target Indication
- 12.4. Global RAS Targeting Therapies Market, Till 2035: Distribution by Type of Molecule
- 12.5. Global RAS Targeting Therapies Market, Till 2035: Distribution by Type of Therapy
- 12.6. Global RAS Targeting Therapies Market, Till 2035: Distribution by Route of Administration
- 12.7. Global RAS Targeting Therapies Market, Till 2035: Distribution by Geography
- 12.8. RAS Targeting Therapies: Individual Product Sales Forecasts
- 12.8.1. LUMAKRASTM (Amgen): Sales Forecast
- 12.8.2. Adagrasib (Mirati Therapeutics): Sales Forecast
- 12.8.3. AMO-01 (AMO Pharma): Sales Forecast
- 12.8.4. Antroquinonol (Golden Biotech): Sales Forecast
- 12.8.5. Binimetinib (Array Biopharma): Sales Forecast
- 12.8.6. CH7126766/VS6766 (Verastem Oncology): Sales Forecast
- 12.8.7. LXH274 (Novartis): Sales Forecast
- 12.8.8. Rigosertib (Onconova Therapeutics): Sales Forecast
- 12.8.9. RMC-4630 (Revolution Medicine): Sales Forecast
- 12.8.10. TG01 (Targovax): Sales Forecast
- 12.8.11. Tipifarnib (Kura Oncology): Sales Forecast
- 12.8.12. siG12D (Silenseed): Sales Forecast

