
|
市場調査レポート
商品コード
1771292
Fc融合タンパク質市場:業界動向と世界の予測 - 標的適応症別、融合分子タイプ別、投与経路別、主要地域別Fc Fusion Protein Market: Industry Trends and Global Forecasts - Distribution by Target Indications, Type of Fusion Molecule, Route of Administration and Key Geographical Regions |
||||||
カスタマイズ可能
|
|||||||
| Fc融合タンパク質市場:業界動向と世界の予測 - 標的適応症別、融合分子タイプ別、投与経路別、主要地域別 |
|
出版日: 2025年07月15日
発行: Roots Analysis
ページ情報: 英文 150 Pages
納期: 7~10営業日
|

全表示
- 概要
- 図表
- 目次
Fc融合タンパク質の世界市場:概要
世界のFc融合タンパク質の市場規模は今年155億米ドルとなりました。同市場は、予測期間中に10%のCAGRで拡大すると予測されています。
市場セグメンテーションと機会分析は、以下のパラメータでセグメント化されています。
標的適応症
- 好中球減少症
- 移植片対宿主病
- 乳がん
- 関節リウマチ
- 非小細胞肺がん
- 新生血管性(ウェット)加齢黄斑変性(AMD)
- 血友病A
- 視神経脊髄炎スペクトラム障害
- 全身性エリテマトーデス
融合分子タイプ
- 抗体
- サイトカイン
- 成長因子
- レセプターECD
- その他
投与経路
- 皮下
- 静脈内投与
- 硝子体内
主要地域
- 北米
- 欧州
- アジア太平洋
- その他の地域
Fc融合タンパク質の世界市場:成長と動向
1998年に関節リウマチ治療薬Enbrel(R)(CD4-Fc融合蛋白)が承認されて以来、Fc融合蛋白療法は著名な治療薬となっています。現在、Fc融合蛋白質をベースとした13種類の薬剤が市販されており、さらに約50種類の分子が様々な疾患適応のために開発中です。これらの治療薬は、生物学的に活性なリガンドの有利な薬理学的特性と、免疫グロブリンG(IgG)の結晶化可能なフラグメント(Fc)ドメインのユニークな特性を組み合わせたものです。さらに、生物学的に活性なタンパク質の血清中半減期を延長する能力により、これらの疾患修飾療法は様々な治療分野で利用されています。その中には、腫瘍、神経、呼吸器、希少遺伝性疾患などが含まれます。
現在、数多くの医薬品開発者が、有効性を向上させた新規Fc融合療法の開発に積極的に取り組んでいます。実際、この分野における開発者の研究努力の中心は、薬理学的に活性な成分の安定性と溶解性を高めることであり、最終的には治療の可能性を高めることを目指しています。その結果、Fc融合療法市場は予測期間中、健全な市場成長が見込まれます。
Fc融合タンパク質の世界市場:主要インサイト
当レポートでは、世界のFc融合タンパク質市場の現状を調査し、業界内の潜在的な成長機会を特定しています。当レポートの主な調査結果は以下の通りです。
- 現在、世界中の約40の企業が、幅広い適応症の治療に対するFc融合治療薬の潜在的利益の評価に取り組んでいます。
- パイプラインには、異なる開発段階において単剤または他の治療薬との併用で評価されている115以上の薬物療法があり、これらのほとんどは非経口投与用に設計されています。
- 承認された治療薬や後期段階の候補薬の大部分は、様々な腫瘍疾患、遺伝性疾患、血液疾患、免疫疾患の治療を目的としています。
- fc融合の治療上の利点を考慮すると、これらの介入は主に単剤療法として評価されています。単剤療法として研究されている後期段階の薬剤の例としては、ACE-011やRC18があります。
- fc融合治療薬の約50%は皮下投与用であり、さまざまなドラッグデリバリーシステムを用いて患者が自己投与できます。
- 様々な地域にわたり、120近いfc融合ベースの治療薬候補の評価のために実施されている臨床試験には、200万人以上の患者が登録されています。
- この分野での研究努力を支援するために、いくつかの組織が財政的支援を行っています。現在、支出された資金という点では、主にSBIR/STTR以外の目的での薬剤の調査支援に重点が置かれています。
- この分野の利害関係者に授与される助成金の数はここ数年増加しており、総額の60%以上が研究プロジェクトに授与されています。
- この分野にはNIHの様々な管理機関が関与しているが、中でもNCI、NIAID、NHLBIの参加が比較的目立ちます。
- 時間の経過とともに、Fc融合治療薬に関連する知的財産は、産業界と非産業界の両方から特許が出願され、称賛に値するペースで成長しています。
- この領域で出願/付与された特許の数は、所定の期間中にCAGR 17%で増加しており、その大半は過去2年間に出願/付与されたものです。
- 業界関係者に加え、スタンフォード大学やINSERMなどの学術機関もfc融合治療薬に関する特許を出願しています。
- 価値の高い特許は、受容体ECD、酵素、ペプチドなど、さまざまな融合分子別Fc領域の修飾に焦点を当てています。
- 発表された科学文献は、この分野における研究の進行ペースを示しています。過去および現在進行中の研究の焦点は、抗がん治療薬の開発に集中しているようです。
- 過去数年間、fc融合治療薬に関連する論文数は着実に増加しています。これらには、抗体のFc領域に融合した生物学的部位の種類に焦点を当てた論文も含まれます。
- 発表された論文の大部分(~70%)は、様々ながんや血液疾患におけるFc融合タンパク質の治療可能性を評価することに焦点を当てた調査研究に関するものです。
- Fc融合治療薬に関連する論文は、インパクトの高い複数のジャーナルに掲載されているが、PLoS OneとMAbsが30以上の論文を掲載する主要ジャーナルとして浮上しています。
- 開発の中期から後期段階にある複数のパイプライン候補で、これらの介入は主に腫瘍性疾患を対象としており、これらの大半はFcタンパク質を操作した抗体です。
- Fasenra、Gazyva、Margenza、Skyriziのような多くの上市された薬剤は、現在、他の腫瘍学的適応症でもその有効性が評価されています。
- 後期段階の候補薬の大部分(~60%)は、固形がん、非ホジキンリンパ腫、非小細胞肺がんを含む腫瘍学的適応症を対象としています。
- パイプラインにある後期段階の治療薬の増加に牽引され、収益の面では、将来的な機会は年率10%近くで成長すると予想されます。
- 推定される市場機会は、さまざまな種類の治療法、標的適応症、融合分子タイプ、投与経路、主要地域にわたって十分に分散していると予想されます。
創薬プラットフォーム市場の参入企業例
- Abzena
- Creative Biolabs
- Distributed Bio(Subsidiary of Charles River)
- ImmunoPrecise Antibodies
- IONTAS
- LakePharma
- Leading Biology
- Sino Biological
- XOMA
FC融合タンパク質の世界市場
- 市場規模と機会分析:この調査レポートは、世界のFc融合タンパク質市場を詳細に分析し、[A]標的適応症、[B]融合分子タイプ、[C]投与経路、[D]主要地域などの主要市場セグメントに焦点を当てています。
- 市場情勢:A]リード候補の開発段階、[B]融合分子タイプ、[C]標的遺伝子、[D]治療領域、[E]標的疾患の適応症、[F]治療法のタイプ、[G]投与経路、[H]投与回数など、様々なパラメータを考慮したFc融合治療薬の包括的評価。さらに、[A]設立年、[B]企業規模、[C]本社所在地に基づいて、医薬品開発企業を詳細に評価します。
- 企業プロファイル:A]企業概要、[B]財務情報(入手可能な場合)、[C]製品ポートフォリオ、[D]最近の動向と情報に基づく将来の見通しに焦点を当てた、Fc融合治療薬の開発に携わる企業の詳細なプロファイル。
- 臨床試験分析:A]試験登録年、[B]試験フェーズ、[C]試験デザイン、[D]マスキングのタイプ、[E]介入モデルのタイプ、[F]新たな重点領域、[G]主要な業界スポンサー/共同研究者、[H]人気のある適応症、[i]人気のある介入、[J]試験の地域分布など、いくつかの関連するパラメータに基づいて、様々なFc融合治療薬の臨床試験の詳細な分析。
- 助成金分析:A]助成金授与年、[B]授与額、[C]管理機関センター、[D]支援期間、[E]助成金申請のタイプ、[F]助成金授与の目的、[G]活動コード、[H]新たな重点領域など、様々な関連パラメータに基づき、Fc融合治療薬に関連するプロジェクトを実施する研究機関に授与された助成金を詳細に分析。
- 出版物の分析:A]発表年、[B]新たな重点領域、[C]標的治療領域、[D]主要著者、[E]主要ジャーナルに基づき、Fc融合治療薬に関連する査読付き科学論文1,135件近くを包括的に分析。
- 特許分析:A]公開年、[B]地域、[C]CPCシンボル、[D]新たな重点領域、[E]出願人のタイプ、[F]主要な業界参入企業、[G]特許評価分析など、様々な関連パラメータに基づき、Fc融合治療薬に関連する出願/付与された特許を詳細に分析します。
- パートナーシップとコラボレーションA]パートナーシップ締結年、[B]パートナーシップのタイプ、[C]重点分野、[D]パートナーのタイプ、[E]最も活発な参入企業(パートナーシップ締結数)、[F]パートナーシップ活動の地域分布など、いくつかのパラメータに基づいて、この分野の利害関係者が締結した取引の洞察に満ちた分析。
- ケーススタディA]開発段階、[B]対象疾患、[C]治療領域、[D]Fcエンジニアリングのタイプ、[E]Fcエンジニアリングのインパクト、[F]投与経路、[G]治療のタイプなど、複数の関連パラメータに基づいて、上市済みまたは開発中のFcタンパク質改変抗体および糖鎖改変抗体に関する詳細な考察。
当レポートでは、世界のFc融合タンパク質市場について調査し、市場の概要とともに、標的適応症別、融合分子タイプ別、投与経路別動向、地域別の動向、および市場に参入する企業のプロファイルなどを提供しています。
目次
第1章 序文
第2章 エグゼクティブサマリー
第3章 イントロダクション
- Fc融合治療薬の概要
- Fc融合治療薬の成分
- 作用機序
- Fc融合治療薬の種類
- Fc融合治療薬の応用
- Fc融合治療薬が他の生物学的分子に対して持つ利点
- 将来の展望
第4章 パイプラインレビュー:市販薬と臨床薬
- 分析調査手法と主要パラメータ
- Fc融合治療薬:医薬品パイプライン
- Fc融合治療薬:パイプライン分析
- Fc融合治療薬:医薬品開発企業一覧
第5章 企業プロファイル
- 章の概要
- Alphamab Oncology
- Amgen
- Acceleron Pharmaceuticals
- Bristol Myers Squibb
- Sanofi
第6章 臨床試験の分析
- 分析調査手法と主要パラメータ
- Fc融合治療薬:臨床試験リスト
第7章 学術助成金分析
- 分析調査手法と主要パラメータ
- Fc融合治療薬:学術助成金の分析
第8章 出版物の分析
第9章 特許分析
- 分析調査手法と主要パラメータ
- Fc融合治療薬:特許分析
第10章 パートナーシップとコラボレーション
- 分析調査手法と主要パラメータ
- パートナーシップモデル
- Fc融合治療薬:パートナーシップとコラボレーションのリスト
第11章 市場規模の評価と機会分析
- 予測調査手法と主要な前提条件
- 世界のFC融合治療薬市場(2035年まで)
- 2035年までの世界のFC融合治療薬市場:標的適応症別
- 2035年までの世界のFC融合治療薬市場:融合分子タイプ別
- 2035年までの世界のFC融合治療薬市場:治療タイプ別
- 2035年までの世界のFC融合治療薬市場:投与経路別
- 2035年までの世界のFC融合治療薬市場:地域別
- Fc融合治療薬:個別製品の売上予測
- ABP 938(Amgen)
- アルプロリックス(R)(Sanofi)
- 安百諾(R)(Hisun Pharmaceuticals)
- Arcalyst(R)(Kiniska Pharmaceuticals)
- BIVV001(Sanofi)
- CD24Fc(Merck)
- エロクテート(R)(Biogen)
- アイリーア(TM)(Regeneron Pharmaceuticals)
- FRSW107(Zhengzhou Gensciences)
- KN035(Alphamab Oncology)
- KN046(Alphamab Oncology)
- ルミチン(R)(Chengdu Kanghong Biotech)
- レブロジル(R)(Bristol-Myers Squibb)
- RyzneutaTM(Evive Biotech)
- ストレンジック(R)(AstraZeneca)
- テリタシセプト(RemeGen)
第12章 ケーススタディ:FCタンパク質工学および糖鎖工学抗体
- Fcタンパク質改変抗体および糖鎖改変抗体:医薬品パイプライン
- Fcタンパク質改変抗体および糖鎖改変抗体:開発者一覧
第13章 結論
第14章 付録1:表形式データ
第15章 付録2:企業・団体一覧
List of Tables
- Table 4.1 Fc Fusion Therapeutics: Drug Pipeline
- Table 4.2 Fc Fusion Therapeutics: List of Drug Developers
- Table 5.1 Fc Fusion Therapeutics: List of Companies Profiled
- Table 5.2 Drug Profile: KN015
- Table 5.3 Drug Profile: KN046
- Table 5.4 Drug Profile: KN035
- Table 5.5 Drug Profile: KN058
- Table 5.6 Drug Profile: KN055
- Table 5.7 Drug Profile: KN019
- Table 5.8 Alphamab Oncology: Recent Developments and Future Outlook
- Table 5.9 Drug Profile: AMG 386
- Table 5.10 Drug Profile: AMG 592
- Table 5.11 Drug Profile: ABP 938
- Table 5.12 Drug Profile: Enbrel(R)
- Table 5.13 Drug Profile: Nplate(R)
- Table 5.14 Amgen: Recent Developments and Future Outlook
- Table 5.15 Drug Profile: ACE-1334
- Table 5.16 Drug Profile: ACE-011
- Table 5.17 Acceleron Pharmaceuticals: Recent Developments and Future Outlook
- Table 5.18 Drug Profile: AVID200
- Table 5.19 Drug Profile: Orencia(R)
- Table 5.20 Drug Profile: Nulojix(R)
- Table 5.21 Drug Profile: REBLOZYL(R)
- Table 5.22 Bristol-Myers Squibb: Recent Developments and Future Outlook
- Table 5.23 Drug Profile: Alprolix(R)
- Table 5.24 Drug Profile: BIVV001
- Table 5.25 Drug Profile: Zaltrap(R)
- Table 5.26 Sanofi: Recent Developments and Future Outlook
- Table 6.1 Fc Fusion Therapeutics: List of Clinical Trials
- Table 10.1 Fc Fusion Therapeutics: List of Partnerships and Collaborations
- Table 12.1 Fc Protein Engineered and Glycoengineered Antibodies: Drug Pipeline
- Table 12.2 Fc Protein Engineered and Glycoengineered Antibodies: List of Drug Developers
- Table 14.1 Fc Fusion Therapeutics: Distribution by Phase of Development
- Table 14.2 Fc Fusion Therapeutics: Distribution by Type of Fusion Molecule
- Table 14.3 Fc Fusion Therapeutics: Distribution by Target Gene
- Table 14.4 Fc Fusion Therapeutics: Distribution by Therapeutic Area(s)
- Table 14.5 Fc Fusion Therapeutics: Distribution by Target Disease Indication(s)
- Table 14.6 Fc Fusion Therapeutics: Distribution by Type of Therapy
- Table 14.7 Fc Fusion Therapeutics: Distribution by Route of Administration
- Table 14.8 Fc Fusion Therapeutics: Distribution by Dosing Frequency
- Table 14.9 Fc Fusion Therapeutics: Distribution by Year of Establishment
- Table 14.10 Fc Fusion Therapeutics: Distribution by Company Size
- Table 14.11 Fc Fusion Therapeutics: Distribution by Location of Headquarters
- Table 14.12 Fc Fusion Therapeutics: Distribution by Leading Developers
- Table 14.13 Amgen: Annual Revenues, Since 2016 (USD Billion)
- Table 14.14 Acceleron Pharmaceuticals: Annual Revenues, Since 2016 (USD Billion)
- Table 14.15 Bristol Myers Squibb: Annual Revenues, Since 2016 (USD Billion)
- Table 14.16 Sanofi: Annual Revenues, Since 2016 (USD Billion)
- Table 14.17 Clinical Trial Analysis: Distribution by Trial Registration Year
- Table 14.18 Clinical Trial Analysis: Distribution by Trial Phase
- Table 14.19 Clinical Trial Analysis: Distribution by Study Design
- Table 14.20 Clinical Trial Analysis: Distribution by Type of Masking
- Table 14.21 Clinical Trial Analysis: Distribution by Type of Intervention Model
- Table 14.22 Clinical Trial Analysis: Distribution by Trial Registration Year and Geography
- Table 14.23 Clinical Trial Analysis: Distribution by Type of Sponsor
- Table 14.24 Leading Industry Players: Distribution by Number of Trials Registered
- Table 14.25 Leading Non-Industry Players: Distribution by Number of Trials Registered
- Table 14.26 Popular Indications: Analysis by Number of Registered Trials
- Table 14.27 Popular Interventions: Analysis by Number of Registered Trials
- Table 14.28 Popular Indications: Distribution by Number of Registered Trials
- Table 14.29 Popular Interventions: Distribution by Number of Registered Trials
- Table 14.30 Clinical Trial Analysis: Geographical Distribution by Number of Registered Trials
- Table 14.31 Clinical Trial Analysis: Geographical Distribution by Number of Patients Enrolled
- Table 14.32 Grant Analysis: Cumulative Trend by Year of Grant Award, Since 2010
- Table 14.33 Grant Analysis: Cumulative Distribution by Amount Awarded (USD Million), Since 2010
- Table 14.34 Grant Analysis: Distribution by Administering Institute Center
- Table 14.35 Grant Analysis: Distribution by Support Period
- Table 14.36 Grant Analysis: Distribution by Type of Grant Application
- Table 14.37 Grant Analysis: Distribution by Purpose of Grant Award
- Table 14.38 Grant Analysis: Distribution by Activity Code
- Table 14.39 Popular NIH Departments: Distribution by Number of Grants
- Table 14.40 Prominent Program Officers: Distribution by Number of Grants
- Table 14.41 Popular Recipient Organizations: Distribution by Number of Grants
- Table 14.42 Publication Analysis: Cumulative Year-wise Trend, Since 2010
- Table 14.43 Publication Analysis: Distribution by Target Therapeutic Area
- Table 14.44 Leading Authors: Distribution by Number of Publications
- Table 14.45 Key Journals: Distribution by Number of Publications
- Table 14.46 Patent Analysis: Distribution by Publication Year
- Table 14.47 Patent Analysis: Distribution by Type of Patent
- Table 14.48 Patent Analysis: Distribution by Geographical Location
- Table 14.49 Patent Analysis: Distribution by Patent Age
- Table 14.50 Patent Analysis: Distribution by CPC Symbols
- Table 14.51 Leading Patent Assignees: Distribution by Number of Patents
- Table 14.52 Leading Industry Players: Distribution by Number of Patents
- Table 14.53 Patent Analysis: Distribution by Patent Benchmarking
- Table 14.54 Patent Analysis: Distribution by Patent Valuation
- Table 14.55 Partnerships and Collaborations: Cumulative Year-wise Trend, Since 2015
- Table 14.56 Partnerships and Collaborations: Distribution by Type of Partnership
- Table 14.57 Partnerships and Collaborations: Distribution by Type of Partnership and Type of Fusion Molecule
- Table 14.58 Partnerships and Collaborations: Distribution by Year of Partnership and Type of Partner
- Table 14.59 Partnerships and Collaborations: Distribution by Type of Partnership and Type of Partner
- Table 14.60 Most Active Players: Distribution by Number of Partnerships
- Table 14.61 Partnerships and Collaborations: Regional Distribution
- Table 14.62 Global Fc Fusion Therapeutics Market, Till 2035 (USD Million)
- Table 14.63 Global Fc Fusion Therapeutics Market, Till 2035: Distribution by Target Indication (USD Million)
- Table 14.64 Global Fc Fusion Therapeutics Market, Till 2035: Distribution by Type of Therapy (USD Million)
- Table 14.65 Global Fc Fusion Therapeutics Market, Till 2035: Distribution by Route of Administration (USD Million
- Table 14.66 Global Fc Fusion Therapeutics Market, Till 2035: Distribution by Geography (USD Million)
- Table 14.67 ABP 938: Sales Forecast, Till 2035 (USD Million)
- Table 14.68 Alprolix(R): Sales Forecast, Till 2035 (USD Million)
- Table 14.69 AnBaiNuo(R): Sales Forecast, Till 2035 (USD Million)
- Table 14.70 Arcalyst(R): Sales Forecast, Till 2035 (USD Million)
- Table 14.71 BIVV001: Sales Forecast, Till 2035 (USD Million)
- Table 14.72 CD24Fc: Sales Forecast, Till 2035 (USD Million)
- Table 14.73 Eloctate(R): Sales Forecast, Till 2035 (USD Million)
- Table 14.74 Eylea(TM): Sales Forecast, Till 2035 (USD Million)
- Table 14.75 FRSW107: Sales Forecast, Till 2035 (USD Million)
- Table 14.76 KN035: Sales Forecast, Till 2035 (USD Million)
- Table 14.77 KN046: Sales Forecast, Till 2035 (USD Million)
- Table 14.78 Lumitin(R): Sales Forecast, Till 2035 (USD Million)
- Table 14.79 Reblozyl(R): Sales Forecast, Till 2035 (USD Million)
- Table 14.80 RyzneutaTM: Sales Forecast, Till 2035 (USD Million)
- Table 14.81 Strensiq(R): Sales Forecast, Till 2035 (USD Million)
- Table 14.82 Telitacicept: Sales Forecast, Till 2035 (USD Million)
- Table 14.83 Fc Protein Engineered and Glycoengineered Antibodies: Analysis by Phase of Development
- Table 14.84 Fc Protein Engineered and Glycoengineered Antibodies: Analysis by Target Disease Indication
- Table 14.85 Fc Protein Engineered and Glycoengineered Antibodies: Analysis by Therapeutic Area
- Table 14.86 Fc Protein Engineered and Glycoengineered Antibodies: Analysis by Type of Fc Engineering
- Table 14.87 Fc Protein Engineered and Glycoengineered Antibodies: Analysis by Impact of Fc Engineering
- Table 14.88 Fc Protein Engineered and Glycoengineered Antibodies: Analysis by Route of Administration
- Table 14.89 Fc Protein Engineered and Glycoengineered Antibodies: Analysis by Type of Therapy
- Table 14.90 Fc Protein Engineered and Glycoengineered Antibodies Developers: Analysis by Year of Establishment
- Table 14.91 Fc Protein Engineered and Glycoengineered Antibodies Developers Analysis by Company Size
- Table 14.92 Fc Protein Engineered and Glycoengineered Antibodies Developers Analysis by Location of Headquarters
List of Figures
- Figure 2.1 Executive Summary: Overall Market Landscape
- Figure 2.2 Executive Summary: Clinical Trial Analysis
- Figure 2.3 Executive Summary: Academic Grant Analysis
- Figure 2.4 Executive Summary: Publication Analysis
- Figure 2.5 Executive Summary: Patent Analysis
- Figure 2.6 Executive Summary: Partnerships and Collaborations
- Figure 2.7 Executive Summary: Market Forecast
- Figure 3.1 Components of Fc Fusion Therapeutics
- Figure 3.2 Mechanism of Action
- Figure 4.1 Fc Fusion Therapeutics: Distribution by Phase of Development
- Figure 4.2 Fc Fusion Therapeutics: Distribution by Type of Fusion Molecule
- Figure 4.3 Fc Fusion Therapeutics: Distribution by Target Gene
- Figure 4.4 Fc Fusion Therapeutics: Distribution by Therapeutic Area(s)
- Figure 4.5 Fc Fusion Therapeutics: Distribution by Target Disease Indication(s)
- Figure 4.6 Fc Fusion Therapeutics: Distribution by Type of Therapy
- Figure 4.7 Fc Fusion Therapeutics: Distribution by Route of Administration
- Figure 4.8 Fc Fusion Therapeutics: Distribution by Dosing Frequency
- Figure 4.9 Fc Fusion Therapeutics Developers: Distribution by Year of Establishment
- Figure 4.10 Fc Fusion Therapeutics Developers: Distribution by Company Size
- Figure 4.11 Fc Fusion Therapeutics Developers: Distribution by Location of Headquarters
- Figure 4.12 Leading Developers: Distribution by Number of Fc Fusion Therapeutics
- Figure 4.13 Grid Analysis: Distribution by Phase of Development, Company Size and Location of Headquarters
- Figure 5.1 Amgen: Annual Revenues, Since 2016 (USD Billion)
- Figure 5.2 Acceleron Pharmaceuticals: Annual Revenues, Since 2016 (USD Billion)
- Figure 5.3 Bristol Myers Squibb: Annual Revenues, Since 2016 (USD Billion)
- Figure 5.4 Sanofi: Annual Revenues, Since 2016 (USD Billion)
- Figure 6.1 Clinical Trial Analysis: Distribution by Trial Registration Year
- Figure 6.2 Clinical Trial Analysis: Distribution by Trial Phase
- Figure 6.3 Clinical Trial Analysis: Distribution by Study Design
- Figure 6.4 Clinical Trial Analysis: Distribution by Type of Masking
- Figure 6.5 Clinical Trial Analysis: Distribution by Type of Intervention Model
- Figure 6.6 World Cloud Analysis: Emerging Focus Areas
- Figure 6.7 Clinical Trial Analysis: Distribution by Trial Registration Year and Geography
- Figure 6.8 Clinical Trial Analysis: Distribution by Type of Sponsor
- Figure 6.9 Leading Industry Players: Distribution by Number of Trials Registered
- Figure 6.10 Leading Non-Industry Players: Distribution by Number of Trials Registered
- Figure 6.11 Popular Indications: Distribution by Number of Registered Trials
- Figure 6.12 Popular Interventions: Distribution by Number of Registered Trials
- Figure 6.13 Popular Indications: Distribution by Number of Registered Trials
- Figure 6.14 Popular Interventions: Distribution by Number of Registered Trials
- Figure 6.15 Clinical Trial Analysis: Geographical Distribution by Number of Registered Trials
- Figure 6.16 Clinical Trial Analysis: Geographical Distribution by Number of Patients Enrolled
- Figure 7.1 Grant Analysis: Cumulative Trend by Year of Grant Award, Since 2010
- Figure 7.2 Grant Analysis: Cumulative Distribution by Amount Awarded (USD Million), Since 2010
- Figure 7.3 Grant Analysis: Distribution by Administering Institute Center
- Figure 7.4 Grant Analysis: Distribution by Support Period
- Figure 7.5 Grant Analysis: Distribution by Type of Grant Application
- Figure 7.6 Grant Analysis: Distribution by Purpose of Grant Award
- Figure 7.7 Grant Analysis: Distribution by Activity Code
- Figure 7.8 Word Cloud Analysis: Emerging Focus Areas
- Figure 7.9 Popular NIH Departments: Distribution by Number of Grants
- Figure 7.10 Prominent Program Officers: Distribution by Number of Grants
- Figure 7.11 Popular Recipient Organizations: Distribution by Number of Grants
- Figure 8.1 Publication Analysis: Cumulative Year-wise Trend, Since 2010
- Figure 8.2 Word Cloud Analysis: Emerging Focus Areas
- Figure 8.3 Publication Analysis: Distribution by Target Therapeutic Area
- Figure 8.4 Leading Authors: Distribution by Number of Publications
- Figure 8.5 Key Journals: Distribution by Number of Publications
- Figure 9.1 Patent Analysis: Distribution by Publication Year
- Figure 9.2 Patent Analysis: Distribution by Type of Patent
- Figure 9.3 Patent Analysis: Distribution by Geographical Location
- Figure 9.4 Patent Analysis: Distribution by Patent Age
- Figure 9.5 Patent Analysis: Distribution by CPC Symbols
- Figure 9.6 Word Cloud Analysis: Emerging Focus Areas
- Figure 9.7 Leading Patent Assignees: Distribution by Number of Patents
- Figure 9.8 Leading Industry Players: Distribution by Number of Patents
- Figure 9.9 Leading Non-Industry Players: Distribution by Number of Patents
- Figure 9.10 Patent Analysis: Distribution by Patent Benchmarking
- Figure 9.11 Patent Analysis: Distribution by Patent Valuation
- Figure 10.1 Partnerships and Collaborations: Cumulative Year-wise Trend, Since 2015
- Figure 10.2 Partnerships and Collaborations: Distribution by Type of Partnership
- Figure 10.3 Partnerships and Collaborations: Distribution by Type of Partnership and Type of Fusion Molecule
- Figure 10.4 Partnerships and Collaborations: Distribution by Year of Partnership and Type of Partner
- Figure 10.5 Partnerships and Collaborations: Distribution by Type of Partnership and Type of Partner
- Figure 10.6 Most Active Players: Distribution by Number of Partnerships
- Figure 10.7 Partnerships and Collaborations: Regional Distribution
Figure 10.7.1 Partnerships and Collaborations: Intercontinental and Intracontinental Agreements
- Figure 11.1 Global Fc Fusion Therapeutics Market, Till 2035 (USD Million)
- Figure 11.2 Global Fc Fusion Therapeutics Market, Till 2035: Distribution by Target Indication (USD Million)
- Figure 11.3 Global Fc Fusion Therapeutics Market, Till 2035: Distribution by Type of Fusion Molecule (USD Million)
- Figure 11.4 Global Fc Fusion Therapeutics Market, Till 2035: Distribution by Type of Therapy (USD Million)
- Figure 11.5 Global Fc Fusion Therapeutics Market, Till 2035: Distribution by Route of Administration (USD Million
- Figure 11.6 Global Fc Fusion Therapeutics Market, Till 2035: Distribution by Geography (USD Million)
- Figure 11.7 ABP 938: Sales Forecast, Till 2035 (USD Million)
- Figure 11.8 Alprolix(R): Sales Forecast, Till 2035 (USD Million)
- Figure 11.9 AnBaiNuo(R): Sales Forecast, Till 2035 (USD Million)
- Figure 11.10 Arcalyst(R): Sales Forecast, Till 2035 (USD Million)
- Figure 11.11 BIVV001: Sales Forecast, Till 2035 (USD Million)
- Figure 11.12 CD24Fc: Sales Forecast, Till 2035 (USD Million)
- Figure 11.13 Eloctate(R): Sales Forecast, Till 2035 (USD Million)
- Figure 11.14 Eylea(TM): Sales Forecast, Till 2035 (USD Million)
- Figure 11.15 FRSW107: Sales Forecast, Till 2035 (USD Million)
- Figure 11.16 KN035: Sales Forecast, Till 2035 (USD Million)
- Figure 11.17 KN046: Sales Forecast, Till 2035 (USD Million)
- Figure 11.18 Lumitin(R): Sales Forecast, Till 2035 (USD Million)
- Figure 11.19 Reblozyl(R): Sales Forecast, Till 2035 (USD Million)
- Figure 11.20 RyzneutaTM: Sales Forecast, Till 2035 (USD Million)
- Figure 11.21 Strensiq(R): Sales Forecast, Till 2035 (USD Million)
- Figure 11.21 Telitacicept: Sales Forecast, Till 2035 (USD Million)
- Figure 12.1 Fc Protein Engineered and Glycoengineered Antibodies: Analysis by Phase of Development
- Figure 12.2 Fc Protein Engineered and Glycoengineered Antibodies: Analysis by Target Disease Indication
- Figure 12.3 Fc Protein Engineered and Glycoengineered Antibodies: Analysis by Therapeutic Area
- Figure 12.4 Fc Protein Engineered and Glycoengineered Antibodies: Analysis by Type of Fc Engineering
- Figure 12.5 Fc Protein Engineered and Glycoengineered Antibodies: Analysis by Impact of Fc Engineering
- Figure 12.6 Fc Protein Engineered and Glycoengineered Antibodies: Analysis by Route of Administration
- Figure 12.7 Fc Protein Engineered and Glycoengineered Antibodies: Analysis by Type of Therapy
- Figure 12.8 Fc Protein Engineered and Glycoengineered Antibodies Developers: Analysis by Year of Establishment
- Figure 12.9 Fc Protein Engineered and Glycoengineered Antibodies Developers Analysis by Company Size
- Figure 12.10 Fc Protein Engineered and Glycoengineered Antibodies Developers Analysis by Location of Headquarters
- Figure 13.1 Concluding Remarks: Overall market Landscape
- Figure 13.2 Concluding Remarks: Clinical Trial Analysis
- Figure 13.3 Concluding Remarks: Academic Grants Analysis
- Figure 13.4 Concluding Remarks: Publication Analysis
- Figure 13.5 Concluding Remarks: Patent Analysis
- Figure 13.6 Concluding Remarks: Partnerships and Collaborations
- Figure 13.7 Concluding Remarks: Market Forecast
GLOBAL FC FUSION PROTEIN MARKET: OVERVIEW
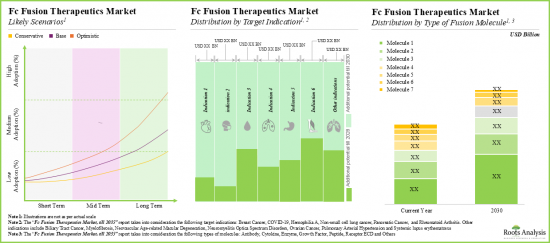
As per Roots Analysis, the global Fc fusion protein market valued at USD 15.5 billion in the current year is anticipated to grow at a CAGR of 10% during the forecast period.
The market sizing and opportunity analysis has been segmented across the following parameters:
Target Indications
- Neutropenia
- Graft Versus Host Disease
- Breast Cancer
- Rheumatoid Arthritis
- Non-Small Cell Lung Cancer
- Neovascular (Wet) Age-related Macular Degeneration (AMD)
- Hemophilia A
- Neuromyelitis Optica Spectrum Disorders
- Systemic Lupus Erythematosus
Type of Fusion Molecule
- Antibody
- Cytokine
- Growth Factor
- Receptor ECD
- Others
Route of Administration
- Subcutaneous
- Intravenous
- Intravitreal
Key Geographical Regions
- North America
- Europe
- Asia-Pacific
- Rest of the World
GLOBAL FC FUSION PROTEIN MARKET: GROWTH AND TRENDS
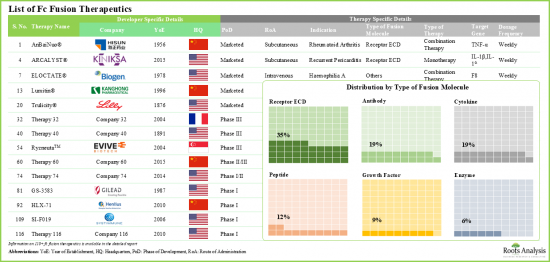
Since the approval of Enbrel(R) (a CD4-Fc fusion protein for the treatment of rheumatoid arthritis) in 1998, Fc fusion protein therapies have become a prominent class of therapeutics. At present, 13 Fc fusion protein-based drugs are commercially available, and approximately 50 additional molecules are in development for a range of disease indications. These therapies combine the advantageous pharmacological properties of biologically active ligands with the unique characteristics of the crystallizable fragment (Fc) domain of immunoglobulin G (IgG). Moreover, due to their ability to prolong the serum half-life of biologically active proteins, these disease-modifying therapies are utilized in a variety of therapeutic areas. Some of these include oncological, neurological, respiratory, and rare genetic disorders.
Currently, numerous drug developers are actively involved in the development of novel Fc fusion therapies with improved efficacy. In fact, the research efforts by developers in this area are centered on enhancing the stability and solubility of the pharmacologically active component, ultimately aiming to boost its therapeutic potential. Consequently, the Fc fusion therapies market is expected to witness healthy market growth during the forecast period.
GLOBAL FC FUSION PROTEIN MARKET: KEY INSIGHTS
The report delves into the current state of global Fc fusion protein market and identifies potential growth opportunities within industry. Some key findings from the report include:
- Presently, around 40 players from across the world, are engaged in evaluating the potential benefits of Fc fusion therapeutics for the treatment of a wide range of disease indications.
- The pipeline features 115+ drug therapies being evaluated either as monotherapies or in combination with other interventions across different stages of development; most of these are designed for parenteral administration.
- Majority of the approved therapies and late-stage candidates are intended for the treatment of various oncological disorders, genetic disorders, hematological disorders and immunological disorders.
- Given the therapeutic benefits of fc fusion, these interventions are primarily evaluated as monotherapies; examples of late-stage drugs being investigated as monotherapy include ACE-011 and RC18.
- Around 50% of the fc fusion therapeutics are meant for subcutaneous administration; these can be self-administered by the patients using different drug delivery systems.
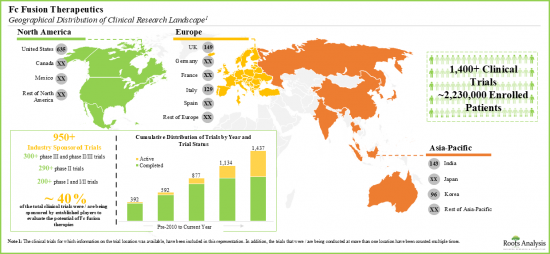
- Over two million patients have been enrolled in the clinical studies being conducted for the evaluation of close to 120 fc fusion-based therapy candidates, across various geographies.
- Several organizations have extended financial support to aid research efforts in this domain; currently, the focus, in terms of funds disbursed, is primarily in support of investigations of drugs for non-SBIR / STTR purposes.
- The number of grants awarded to stakeholders in this domain have increased in the past few years; more than 60% of the total amount was awarded for research projects.
- The field has witnessed the involvement of various administering institutes of the NIH; of all the institutes, participation of the NCI, NIAID, and NHLBI has been relatively more prominent.
- Over time, the intellectual property related to Fc fusion therapeutics has grown at a commendable pace, with patents being filed by both industry and non-industry players.
- Number of patents filed / granted in this domain have increased at a CAGR of 17% during the given time period, with majority of the patents filed / granted in the past two years.
- In addition to industry players, several academic organizations, such as Stanford University and INSERM have also filed patents related to fc fusion therapeutics.
- The high value patents focus on the modification of Fc region with different fusion molecules, such as receptor ECD, enzyme and peptide.
- Published scientific literature is indicative of the ongoing pace of research in this field; the focus of past and ongoing studies seems to be fixated on the development of anti-cancer therapeutics.
- The past few years have seen a steady rise in the number of publications related to fc fusion therapeutics; these include articles highlighting the type of biological moieties fused with the Fc region of the antibodies.
- Majority (~70%) of the published articles are related to the research studies focused on evaluating the therapeutic potential of Fc fusion proteins across various oncological and blood disorders.
- Articles related to Fc fusion therapeutics have been published in several high impact journals; however, PLoS One and MAbs have emerged as the key journals with over 30 articles.
- With multiple pipeline candidates in the mid to late stages of development, these interventions are primarily targeting oncological disorders; majority of these are Fc protein engineered antibodies.
- A number of marketed drugs, such as Fasenra, Gazyva, Margenza and Skyrizi, are now being evaluated for their efficacy across other oncological indications as well.
- Majority (~60%) of the late-stage candidates are targeting oncological indications, including solid tumors, non-Hodgkin lymphoma, and non-small cell lung cancer.
- Driven by an increasing number of late-stage therapies in the pipeline, the future opportunity, in terms of revenues, is anticipated to grow at an annualized rate of nearly 10%.
- The estimated market opportunity is expected to be well-distributed across different types of therapies, target indications, type of fusion molecules, routes of administration and key geographic regions.
Example Players in the Drug Discovery Platforms Market
- Abzena
- Creative Biolabs
- Distributed Bio (Subsidiary of Charles River)
- ImmunoPrecise Antibodies
- IONTAS
- LakePharma
- Leading Biology
- Sino Biological
- XOMA
GLOBAL FC FUSION PROTEIN MARKET
- Market Sizing and Opportunity Analysis: The report features an in-depth analysis of the global Fc fusion protein market, focusing on key market segments, including [A] target indications, [B] type of fusion molecule, [C] route of administration and [D] key geographical regions.
- Market Landscape: A comprehensive evaluation of Fc fusion therapeutics, considering various parameters, such as [A] phase of development of lead candidates, [B] type of fusion molecule, [C] target gene, [D] therapeutic area(s), [E] target disease indication(s), [F] type of therapy, [G] route of administration and [H] dosing frequency. Additionally, a detailed evaluation of the drug developer(s), based on [A] year of establishment, [B] company size, and [C] location of headquarters.
- Company Profiles: In-depth profiles of companies engaged in the development of Fc fusion therapeutics, focusing on [A] company overview, [B financial information (if available), [C] product portfolio and [D] recent developments and an informed future outlook.
- Clinical Trial Analysis: A detailed analysis of clinical studies of various Fc fusion therapeutics, based on several relevant parameters, such as [A] trial registration year, [B] trial phase, [C] study design, [D] type of masking, [E] type of intervention model, [F] emerging focus area, [G] leading industry sponsors / collaborators, [H] popular indications, [I] popular interventions and [J] regional distribution of trials.
- Grant Analysis: An in-depth analysis of grants that have been awarded to research institutes engaged in conducting projects related to Fc fusion therapeutics, based on various relevant parameters, such as [A] year of grant award, [B] amount awarded, [C] administering institute center, [D] support period, [E] type of grant application, [F] purpose of grant award, [G] activity code and [H] emerging focus areas.
- Publication Analysis: A comprehensive analysis of close to 1,135 peer-reviewed scientific articles related to Fc fusion therapeutics, based on [A] year of publication, [B] emerging focus areas, [C] target therapeutic area, [D] leading authors and [E] key journals.
- Patent Analysis: An in-depth analysis of patents filed / granted related to Fc fusion therapeutics, based on various relevant parameters, such as [A] publication year, [B] geography, [C] CPC symbols, [D] emerging focus areas, [E] type of applicant, [F] leading industry players and [G] patent valuation analysis.
- Partnerships and Collaborations: An insightful analysis of the deals inked by stakeholders in this domain, based on several parameters, such as [A] year of partnership, [B] type of partnership, [C] focus area, [D] type of partner, [E] most active players (in terms of the number of partnerships signed) and [F] geographical distribution of partnership activity.
- Case Study: A detailed discussion on the Fc protein engineered and glycoengineered antibodies that are either marketed or being developed based on multiple of relevant parameters, such as [A] phase of development, [B] target disease indication, [C] therapeutic area, [D] type of Fc engineering, [E] impact of Fc engineering, [F] route of administration and [G] type of therapy.
KEY QUESTIONS ANSWERED IN THIS REPORT
- How many companies are currently engaged in this market?
- Which are the leading companies in this market?
- What factors are likely to influence the evolution of this market?
- What is the current and future market size?
- What is the CAGR of this market?
- How is the current and future market opportunity likely to be distributed across key market segments?
REASONS TO BUY THIS REPORT
- The report provides a comprehensive market analysis, offering detailed revenue projections of the overall market and its specific sub-segments. This information is valuable to both established market leaders and emerging entrants.
- Stakeholders can leverage the report to gain a deeper understanding of the competitive dynamics within the market. By analyzing the competitive landscape, businesses can make informed decisions to optimize their market positioning and develop effective go-to-market strategies.
- The report offers stakeholders a comprehensive overview of the market, including key drivers, barriers, opportunities, and challenges. This information empowers stakeholders to stay abreast of market trends and make data-driven decisions to capitalize on growth prospects.
ADDITIONAL BENEFITS
- Complimentary PPT Insights Packs
- Complimentary Excel Data Packs for all Analytical Modules in the Report
- 15% Free Content Customization
- Detailed Report Walkthrough Session with Research Team
- Free Updated report if the report is 6-12 months old or older
TABLE OF CONTENTS
1. PREFACE
- 1.1. Scope of the Report
- 1.2. Research Methodology
- 1.2.1. Research Assumptions
- 1.2.2. Project Methodology
- 1.2.3. Forecast Methodology
- 1.2.4. Robust Quality Control
- 1.2.5. Key Considerations
- 1.2.5.1. Demographics
- 1.2.5.2. Economic Factors
- 1.2.5.3. Government Regulations
- 1.2.5.4. Supply Chain
- 1.2.5.5. COVID Impact / Related Factors
- 1.2.5.6. Market Access
- 1.2.5.7. Healthcare Policies
- 1.2.5.8. Industry Consolidation
- 1.3 Key Questions Answered
- 1.4. Chapter Outlines
2. EXECUTIVE SUMMARY
3. INTRODUCTION
- 3.1. Overview of Fc Fusion Therapeutics
- 3.2. Components of Fc Fusion Therapeutics
- 3.3. Mechanism of Action
- 3.4. Types of Fc Fusion Therapeutics
- 3.4.1. Antibody-based Fc Fusion Therapeutics
- 3.4.2. Cytokine-based Fc Fusion Therapeutics
- 3.4.3. Enzyme-based Fc Fusion Therapeutics
- 3.4.4. Peptide-based Fc Fusion Therapeutics
- 3.4.5. Receptor ECD-based Fc Fusion Therapeutics
- 3.5. Applications of Fc Fusion Therapeutics
- 3.6. Advantages of Fc Fusion Therapeutics over Other Biological Moieties
- 3.7. Future Perspectives
4. PIPELINE REVIEW: MARKETED AND CLINICAL DRUGS
- 4.1. Analysis Methodology and Key Parameters
- 4.2. Fc Fusion Therapeutics: Drug Pipeline
- 4.3. Fc Fusion Therapeutics: Pipeline Analysis
- 4.3.1. Analysis by Phase of Development
- 4.3.2. Analysis by Type of Fusion Molecule
- 4.3.3. Analysis by Target Gene
- 4.3.4. Analysis by Therapeutic Area(s)
- 4.3.5. Analysis by Target Disease Indication(s)
- 4.3.6. Analysis by Type of Therapy
- 4.3.7. Analysis by Route of Administration
- 4.3.8. Analysis by Dosing Frequency
- 4.4. Fc Fusion Therapeutics: List of Drug Developers
- 4.4.1. Analysis by Year of Establishment
- 4.4.2. Analysis by Company Size
- 4.4.3. Analysis by Location of Headquarters
- 4.4.4. Leading Developers
- 4.4.5. Grid Analysis: Distribution by Phase of Development, Company Size and Location of Headquarters
5. COMPANY PROFILES
- 5.1. Chapter Overview
- 5.2. Alphamab Oncology
- 5.2.1. Company Overview
- 5.2.2. Financial Information
- 5.2.3. Product Portfolio
- 5.2.4. Recent Developments and Future Outlook
- 5.3. Amgen
- 5.3.1. Company Overview
- 5.3.2. Financial Information
- 5.3.3. Product Portfolio
- 5.3.4. Recent Developments and Future Outlook
- 5.4. Acceleron Pharmaceuticals
- 5.4.1. Company Overview
- 5.4.2. Financial Information
- 5.4.3. Product Portfolio
- 5.4.4. Recent Developments and Future Outlook
- 5.5. Bristol Myers Squibb
- 5.5.1. Company Overview
- 5.5.2. Financial Information
- 5.5.3. Product Portfolio
- 5.5.4. Recent Developments and Future Outlook
- 5.6. Sanofi
- 5.6.1. Company Overview
- 5.6.2. Financial Information
- 5.6.3. Product Portfolio
- 5.6.4. Recent Developments and Future Outlook
6. CLINICAL TRIAL ANALYSIS
- 6.1. Analysis Methodology and Key Parameters
- 6.2. Fc Fusion Therapeutics: List of Clinical Trials
- 6.2.1. Analysis by Trial Registration Year
- 6.2.2. Analysis by Trial Phase
- 6.2.3. Analysis by Study Design
- 6.2.4. Analysis by Type of Masking
- 6.2.5. Analysis by Type of Intervention Model
- 6.2.6. World Cloud: Emerging Focus Areas
- 6.2.7. Analysis by Trial Registration Year and Geography
- 6.2.8. Analysis by Type of Sponsor
- 6.2.9. Leading Industry Players: Analysis by Number of Trials Registered
- 6.2.10. Leading Non-Industry Players: Analysis by Number of Trials Registered
- 6.2.11. Popular Indications: Analysis by Number of Registered Trials
- 6.2.12. Popular Interventions: Analysis by Number of Registered Trials
- 6.2.13. Geographical Analysis by Number of Registered Trials
- 6.2.14. Geographical Analysis by Number of Patients Enrolled
7. ACADEMIC GRANT ANALYSIS
- 7.1. Analysis Methodology and Key Parameters
- 7.2. Fc Fusion Therapeutics: Analysis of Academic Grants
- 7.2.1. Analysis by Year of Grant Award
- 7.2.2. Analysis by Amount Awarded
- 7.2.3. Analysis by Administering Institute Center
- 7.2.4. Analysis by Support Period
- 7.2.5. Analysis by Type of Grant Application
- 7.2.6. Analysis by Purpose of Grant Award
- 7.2.7. Analysis by Activity Code
- 7.2.8. Word Cloud Analysis: Emerging Focus Areas
- 7.2.9. Popular NIH Departments: Analysis by Number of Grants
- 7.2.10. Prominent Program Officers: Analysis by Number of Grants
- 7.2.11. Popular Recipient Organizations: Analysis by Number of Grants
8. PUBLICATION ANALYSIS
- 8.1. Analysis Methodology and Key Parameters
- 8.2. Fc Fusion Therapeutics: Recent Publications
- 8.3. Analysis by Year of Publication
- 8.4. Word Cloud Analysis: Emerging Focus Areas
- 8.5. Analysis by Target Therapeutic Area
- 8.6. Leading Authors: Analysis by Number of Publications
- 8.7. Key Journals: Analysis by Number of Publications
9. PATENT ANALYSIS
- 9.1. Analysis Methodology and Key Parameters
- 9.2. Fc Fusion Therapeutics: Patent Analysis
- 9.2.1. Analysis by Publication Year
- 9.2.2. Analysis by Type of Patent
- 9.2.3. Analysis by Geographical Location
- 9.2.4. Analysis by Patent Age
- 9.2.5. Analysis by CPC Symbols
- 9.2.6. Word Cloud Analysis: Emerging Focus Areas
- 9.2.7. Leading Patent Assignees: Analysis by Number of Patents
- 9.2.8. Leading Industry Players: Analysis by Number of Patents
- 9.2.9. Leading Non-Industry Players: Analysis by Number of Patents
- 9.2.10. Fc Fusion Therapeutics: Patent Benchmarking Analysis
- 9.2.11. Fc Fusion Therapeutics: Patent Valuation Analysis
10. PARTNERSHIPS AND COLLABORATIONS
- 10.1. Analysis Methodology and Key Parameters
- 10.2. Partnership Models
- 10.3. Fc Fusion Therapeutics: List of Partnerships and Collaborations
- 10.3.1. Analysis by Year of Partnership
- 10.3.2. Analysis by Type of Partnership
- 10.3.3. Analysis by Type of Partnership and Type of Fusion molecule
- 10.3.4. Analysis by Year of Partnership and Type of Partner
- 10.3.5. Analysis by Type of Partnership and Type of Partner
- 10.3.6. Most Active Players: Analysis by Number of Partnerships
- 10.3.7. Regional Analysis
- 10.3.7.1. Intercontinental and Intracontinental Agreements
11. MARKET SIZING AND OPPORTUNITY ANALYSIS
- 11.1. Forecast Methodology and Key Assumptions
- 11.2. Global Fc Fusion Therapeutics Market, Till 2035
- 11.3. Global Fc Fusion Therapeutics Market, Till 2035: Distribution by Target Indication
- 11.4. Global Fc Fusion Therapeutics Market, Till 2035: Distribution by Type of Fusion Molecule
- 11.5. Global Fc Fusion Therapeutics Market, Till 2035: Distribution by Type of Therapy
- 11.6. Global Fc Fusion Therapeutics Market, Till 2035: Distribution by Route of Administration
- 11.7. Global Fc Fusion Therapeutics Market, Till 2035: Distribution by Geography
- 11.8. Fc Fusion Therapeutics: Individual Product Sales Forecasts
- 11.8.1. ABP 938 (Amgen)
- 11.8.2. Alprolix(R) (Sanofi)
- 11.8.3. AnBaiNuo(R) (Hisun Pharmaceuticals)
- 11.8.4. Arcalyst(R) (Kiniska Pharmaceuticals)
- 11.8.5. BIVV001 (Sanofi)
- 11.8.6. CD24Fc (Merck)
- 11.8.7. Eloctate(R) (Biogen)
- 11.8.8. Eylea(TM) (Regeneron Pharmaceuticals)
- 11.8.9. FRSW107 (Zhengzhou Gensciences)
- 11.8.10. KN035 (Alphamab Oncology)
- 11.8.11. KN046 (Alphamab Oncology)
- 11.8.12. Lumitin(R) (Chengdu Kanghong Biotech)
- 11.8.13. Reblozyl(R) (Bristol-Myers Squibb)
- 11.8.14. RyzneutaTM (Evive Biotech)
- 11.8.15. Strensiq(R) (AstraZeneca)
- 11.8.16. Telitacicept (RemeGen)
12. CASE STUDY: FC PROTEIN ENGINEERED AND GLYCOENGINEERED ANTIBODIES
- 12.1. Fc Protein Engineered and Glycoengineered Antibodies: Drug Pipeline
- 12.1.1. Analysis by Phase of Development
- 12.1.2. Analysis by Target Disease Indication
- 12.1.3. Analysis by Therapeutic Area
- 12.1.4. Analysis by Type of Fc Engineering
- 12.1.5. Analysis by Impact of Fc Engineering
- 12.1.6. Analysis by Route of Administration
- 12.1.7. Analysis by Type of Therapy
- 12.2. Fc Protein Engineered and Glycoengineered Antibodies: List of Developers
- 12.2.1. Analysis by Year of Establishment
- 12.2.2. Analysis by Company Size
- 12.2.3. Analysis by Location of Headquarters
