
|
市場調査レポート
商品コード
1762535
Fcおよび糖鎖改変抗体市場:業界動向と世界の予測 - 改変タイプ別、治療タイプ別、治療領域別、投与経路別、主要地域別Fc and Glycoengineered Antibodies Market : Industry Trends and Global Forecasts - Distribution by Type of Engineering, Type of Therapy, Therapeutic Area, Route of Administration and Key Geographical Regions |
||||||
カスタマイズ可能
|
|||||||
| Fcおよび糖鎖改変抗体市場:業界動向と世界の予測 - 改変タイプ別、治療タイプ別、治療領域別、投与経路別、主要地域別 |
|
出版日: 2025年07月04日
発行: Roots Analysis
ページ情報: 英文 293 Pages
納期: 即日から翌営業日
|

全表示
- 概要
- 図表
- 目次
Fcおよび糖鎖改変抗体市場:概要
世界のFcおよび糖鎖改変抗体の市場規模は今年388億米ドルとなりました。同市場は、2035年までの予測期間中に有利なCAGRで成長すると予測されています。
市場セグメンテーションでは、市場規模と機会分析を以下のパラメータで区分しています:
改変タイプ
- Fc改変抗体
- 糖鎖改変抗体
治療タイプ
- 単剤療法
- 併用療法
- 両方
治療領域
- 自己免疫疾患
- 皮膚疾患
- 腫瘍学的疾患
- 希少疾患
- その他
投与経路
- 静脈内投与
- 皮下投与
- 筋肉内投与
主要地域
- 北米
- 欧州
- アジア太平洋
- その他の地域
Fcおよび糖鎖改変抗体市場:成長と動向
100近いモノクローナル抗体が承認され、550以上の分子が臨床パイプラインにあることから、抗体ベースの薬理学的介入はバイオ医薬品業界で最も急速に成長している分野の一つとなっています。さらに、抗体治療薬業界では、フラグメント結晶化(Fc)領域を改変して開発された人工抗体が、ここ数年大きな関心を集めています。抗体のFc融合タンパク質における糖鎖工学的抗体、タンパク質工学、アイソタイプ・キメリズムなどの改変は、抗体依存性細胞細胞傷害性(ADCC)、補体依存性細胞傷害性(CDC)、抗体依存性細胞貪食(ADCP)活性、分子の半減期などの様々なエフェクター機能を増強することが示されています。さらに、いくつかのFc改変技術は、特定の経路におけるエフェクター機能の抑制を可能にし、抗がん抗体の開発に向けて活発に研究されています。
この領域における一貫した研究努力の結果、ガジーバ(慢性リンパ性白血病治療薬)とポテレジオ(セザリー症候群治療薬)という2つの画期的な薬剤が誕生しました。さらに、Margenza、MONJUVI、SKYRIZIなど、いくつかのFc改変抗体製品も過去数年間に承認を取得しています。さらに最近では、エプコリタマブと名付けられたFc改変抗体がびまん性大細胞型B細胞リンパ腫の治療薬として承認を受けた。さらに、開発パイプラインにある医薬品もいくつかあり、さまざまな中小製薬会社や大手製薬会社によって研究が進められています。有望な臨床結果と現在進行中の技術開拓により、Fc改変抗体市場は今後10年間、目覚ましいペースで発展していくと思われます。
Fcおよび糖鎖改変抗体市場:主要インサイト
本レポートでは、Fcおよび糖鎖改変抗体市場の現状を掘り下げ、業界内の潜在的な成長機会を特定しています。本レポートの主な調査結果は以下の通りです。
- Fc抗体のパイプラインには、40以上の上市済み医薬品と131の医薬品開発プログラムがあり、これらは主に中堅・大手企業により開発されています。
- 腫瘍性疾患をターゲットとする介入の大部分(62%)が臨床開発段階にあり、このうち抗体の大部分(81%)がFc改変抗体です。
- Fc改変抗体や糖鎖改変抗体の領域では、過去数年間に150件近い助成金が授与されており、NIAIDはこれらの助成金のトップ機関として浮上しています。
- Fc改変抗体や糖鎖改変抗体に関する知的財産は、産業界と非産業界の両方から特許が申請され、時間の経過とともに目覚ましいペースで成長しています。
- Fc改変抗体や糖鎖改変抗体の評価のために登録された臨床試験において、さまざまな地域にわたって50万人近い被験者を募集/登録しています。
- 2016年以降、医薬品受託製造に関連する製造ポートフォリオをさらに強化するため、様々な業界および非業界の参入企業により70件以上の契約が結ばれています。
- 有望な開発パイプラインに後押しされ、Fc改変抗体および糖鎖改変抗体の市場は今後数年間、安定したペースで成長するとみられます。
- 上市された治療薬や後期段階の治療薬の販売別収益という点では、将来の機会は世界中のさまざまな種類の治療薬にうまく分散すると予想されます。
Fcおよび糖鎖改変抗体市場:主要セグメント
Fcおよび糖鎖改変抗体市場で最大のシェアを占めるFc改変抗体セグメント
Fc改変タイプ別では、市場はFc改変抗体と糖鎖改変抗体に区分されます。現在、世界のFcおよび糖鎖改変抗体市場では、Fc改変抗体分野が最大シェアを占めています。この傾向は、Fc改変がエフェクター機能を強化し、治療効果を向上させるという事実により、今後数年間も変わらないと思われます。
治療タイプ別では、市場は単剤療法、併用療法、およびその両方に区分されます。現在、単剤療法が世界のFc/糖鎖改変抗体市場で最も高い割合を占めているが、これは単剤療法に関連するいくつかの利点、例えば、規制経路の容易さ、潜在的な薬物相互作用の低減、費用対効果の高さなどによるものです。
治療領域別に見ると、市場は自己免疫疾患、皮膚疾患、腫瘍疾患、希少疾患、その他の疾患に区分されます。現在、世界のFc/糖鎖改変抗体市場で最大のシェアを占めているのは腫瘍疾患分野です。しかし、自己免疫疾患セグメントの市場は予測期間中により高いCAGRで成長すると予想されます。
投与経路別では、市場は静脈内投与経路、皮下投与経路、筋肉内投与経路に区分されます。現在、世界のFc/糖鎖改変抗体市場は、静脈内投与用のFc/糖鎖改変抗体が支配的です。これは、静脈内投与により抗体が全身に分布し、治療効果とバイオアベイラビリティが向上するためです。
主要地域別に見ると、市場は北米、欧州、アジア太平洋、その他の地域に区分されます。現在、北米が世界のFc抗体および糖鎖改変抗体市場を独占しており、最大の収益シェアを占めています。さらに、アジア太平洋市場は今後、より高いCAGRで成長する可能性が高いです。
Fcおよび糖鎖改変抗体市場における参入企業例
- AbbVie
- Akesobio
- Alexion Pharmaceuticals
- Amgen
- AstraZeneca
- Boehringer Ingelheim
- Genentech
- MacroGenics
- MorphoSys
- Kyowa Kirin
- Xencor
目次
第1章 序文
第2章 調査手法
第3章 経済的およびその他のプロジェクト特有の考慮事項
- 章の概要
- 市場力学
第4章 エグゼクティブサマリー
- 章の概要
第5章 イントロダクション
- 章の概要
- 抗体の構造
- 抗体開発の歴史的年表
- 抗体アイソタイプ
- 抗体の作用機序
- Fc領域とエフェクター機能
- 将来の展望
第6章 市場情勢
- 章の概要
- Fc改変および糖鎖改変抗体:全体的なパイプライン
- Fc改変および糖鎖改変抗体:開発者の全体的な情勢
第7章 企業プロファイル
- 章の概要
- 主要なFcおよび糖鎖改変抗体薬剤開発企業の詳細なプロファイル
- AbbVie
- Alexion Pharmaceuticals
- AstraZeneca
- Genentech
- MacroGenics
- Kyowa Kirin
- その他の企業のプロファイル
- Akeso Biopharma
- Amgen
- Boehringer Ingelheim
- MorphoSys
- Xemcor
第8章 臨床試験の分析
- 章の概要
- 範囲と調査手法
- Fc改変抗体および糖鎖改変抗体:臨床試験分析
第9章 パートナーシップとコラボレーション
- 章の概要
- パートナーシップモデル
- Fc改変および糖鎖改変抗体:パートナーシップとコラボレーション
第10章 助成金分析
- 章の概要
- 範囲と調査手法
- Fc改変抗体および糖鎖改変抗体:助成金分析
第11章 特許分析
- 章の概要
- 範囲と調査手法
- Fc改変抗体および糖鎖改変抗体:特許分析
第12章 世界のFc改変および糖鎖改変抗体市場
- 章の概要
- 主要な前提と調査手法
- 世界のFc改変および糖鎖改変抗体市場、歴史的動向(2019年以降)および将来予測(2035年まで)
- 主要な市場セグメンテーション
第13章 Fc改変および糖鎖改変抗体市場(改変タイプ別)
- 章の概要
- 主要な前提と調査手法
- Fc修飾および糖鎖修飾抗体市場:改変タイプ別
- データの三角測量と検証
第14章 Fc改変および糖鎖改変抗体市場(治療タイプ別)
- 章の概要
- 主要な前提と調査手法
- Fc改変および糖鎖改変抗体市場:治療タイプ別
- データの三角測量と検証
第15章 Fc改変および糖鎖改変抗体市場(治療領域別)
- 章の概要
- 主要な前提と調査手法
- Fc改変および糖鎖改変抗体市場:治療領域別
- データの三角測量と検証
第16章 Fc改変および糖鎖改変抗体市場(投与経路別)
- 章の概要
- 主要な前提と調査手法
- Fc改変および糖鎖改変抗体市場:投与経路別
- データの三角測量と検証
第17章 Fc改変および糖鎖改変抗体市場(主要地域別)
- 章の概要
- 主要な前提と調査手法
- Fc改変および糖鎖改変抗体市場:主要地域別
- データの三角測量と検証
第18章 Fc改変抗体および糖鎖改変抗体市場、医薬品の売上予測
- 章の概要
- 主要な前提と調査手法
- 市販されているFc改変および糖鎖改変抗体市場:売上予測
- 第III相のFc改変および糖鎖改変抗体市場:売上予測
- データの三角測量と検証
第19章 結論
第20章 付録I:表形式データ
第21章 付録II:企業および組織の一覧
List of Tables
- Table 1.1. Fc and Glycoengineered Antibodies Market: Report Attribute / Market Segment
- Table 5.1. Features of Different Isotypes of Antibodies
- Table 5.2. Features of Engineered Fc Regions
- Table 6.1. Fc Engineered and Glycoengineered Antibodies: Overall Pipeline
- Table 6.2. Fc Engineered and Glycoengineered Antibodies: Information on Type of Engineering, Impact of Engineering and Fc Engineering Technology
- Table 6.3. Fc Engineered and Glycoengineered Antibodies: List of Developers
- Table 7.1. Fc Engineered and Glycoengineered Antibodies: List of Drug Developers Profiled
- Table 7.2. AbbVie: Company Snapshot
- Table 7.3. Drug Profile: Skyrizi
- Table 7.4. AbbVie: Recent Developments and Future Outlook
- Table 7.5. Alexion Pharmaceuticals: Company Snapshot
- Table 7.6. Drug Profile: Soliris
- Table 7.7. Drug Profile: Ultomiris
- Table 7.8. AstraZeneca: Company Snapshot
- Table 7.9. Drug Profile: Beyfortus
- Table 7.10. Drug Profile: Imfinzi
- Table 7.11. Drug Profile: Fasenra
- Table 7.12. Drug Profile: Saphnelo
- Table 7.13. AstraZeneca: Recent Developments and Future Outlook
- Table 7.14. Genentech: Company Snapshot
- Table 7.15. Drug Profile: Gazyva
- Table 7.16. Drug Profile: Ocrevus
- Table 7.17. Drug Profile: Tecentriq
- Table 7.18. Genentech: Recent Developments and Future Outlook
- Table 7.19. MacroGenics: Company Snapshot
- Table 7.20. Drug Profile: Margenza
- Table 7.21. Drug Profile: MGA-271
- Table 7.22. MacroGenics: Recent Developments and Future Outlook
- Table 7.23. Kyowa Kirin: Company Snapshot
- Table 7.24. Drug Profile: POTELIGEO
- Table 7.25. Kyowa Kirin: Recent Developments and Future Outlook
- Table 7.26. Akeso Biopharma: Company Snapshot
- Table 7.27. Drug Profile: Penpulimab
- Table 7.28. Amgen: Company Snapshot
- Table 7.29. Drug Profile: Bmarituzumab
- Table 7.30. Drug Profile: XmAb Antibody
- Table 7.31. Drug Profile: FPA157
- Table 7.32. Boehringer Ingelheim: Company Snapshot
- Table 7.33. Drug Profile: Spesolimab
- Table 7.34. MorphoSys: Company Snapshot
- Table 7.35. Drug Profile: Tafasitamab
- Table 7.36. Xencor: Company Snapshot
- Table 7.37. Drug Profile: Tidutamab
- Table 7.38. Drug Profile: XmAb22841
- Table 7.39. Drug Profile: XmAb23104
- Table 7.40. Drug Profile: Plamotamab
- Table 7.41. Drug Profile: Vibecotamab
- Table 7.42. Drug Profile: RO7310729
- Table 7.43. Drug Profile: XmAb20717
- Table 7.44. Drug Profile: XmAb819
- Table 7.45. Drug Profile: XmAb27564
- Table 7.46. Drug Profile: VRC01LS
- Table 9.1. Fc Engineered and Glycoengineered Antibodies: List of Partnerships and Collaborations, Since 2016
- Table 9.2. Partnerships and Collaborations: Information on Type of Engineering and Therapeutic Area
- Table 11.1. Patent Analysis: Top CPC Sections
- Table 11.2. Patent Analysis: Top CPC Symbols
- Table 11.3. Patent Analysis: Top CPC Codes
- Table 11.4. Patent Analysis: Summary of Benchmarking Analysis
- Table 11.5. Patent Analysis: Categorization based on Weighted Valuation Scores
- Table 11.6. Patent Portfolio: List of Leading Patents (by Highest Relative Valuation)
- Table 11.7. Patent Portfolio: List of Leading Patents (by Number of Citations)
- Table 21.1. Fc Engineered and Glycoengineered Antibodies: Distribution by Stage of Development
- Table 21.2. Fc Engineered and Glycoengineered Antibodies: Distribution by Type of Antibody
- Table 21.3. Fc Engineered and Glycoengineered Antibodies: Distribution by Type of Engineering
- Table 21.4. Fc Engineered and Glycoengineered Antibodies: Distribution by Impact of Engineering
- Table 21.5. Fc Engineered and Glycoengineered Antibodies: Distribution by Biological Target
- Table 21.6. Fc Engineered and Glycoengineered Antibodies: Distribution by Type of Therapy
- Table 21.7. Fc Engineered and Glycoengineered Antibodies: Distribution by Target Disease Indication
- Table 21.8. Fc Engineered and Glycoengineered Antibodies: Distribution by Therapeutic Area
- Table 21.9. Fc Engineered and Glycoengineered Antibodies: Distribution by Route of Administration
- Table 21.10. Popular Fc Engineering Technologies: Distribution by Number of Development Programs
- Table 21.11. Fc Engineered and Glycoengineered Antibodies: Distribution by Year of Establishment
- Table 21.12. Fc Engineered and Glycoengineered Antibodies: Distribution by Company Size
- Table 21.13. Fc Engineered and Glycoengineered Antibodies: Distribution by Location of Headquarters
- Table 21.14. AbbVie: Annual Revenues, Since FY 2019 (USD Billion)
- Table 21.15. AstraZeneca: Annual Revenues, Since FY 2019 (USD Billion)
- Table 21.16. Roche (Parent Company of Genentech): Annual Revenues, Since FY 2019 (CHF Billion)
- Table 21.17. MacroGenics: Annual Revenues, Since FY 2019 (USD Million)
- Table 21.18. Kyowa Kirin: Annual Revenues, Since FY 2019 (YEN Billion)
- Table 21.19. Clinical Trial Analysis: Cumulative Year-wise Trend, Since Pre-2015
- Table 21.20. Clinical Trial Analysis: Year-wise Trend of Patients Enrolled by Trial Registration Year, Since Pre-2015
- Table 21.21. Clinical Trial Analysis: Distribution by Trial Phase
- Table 21.22. Clinical Trial Analysis: Distribution of Number of Patients Enrolled by Trial Phase
- Table 21.23. Clinical Trial Analysis: Distribution by Trial Registration Year and Trial Phase, Since Pre-2015
- Table 21.24. Clinical Trial Analysis: Distribution by Trial Status
- Table 21.25. Clinical Trial Analysis: Distribution by Patient Gender
- Table 21.26. Clinical Trial Analysis: Distribution by Target Indication
- Table 21.27. Clinical Trial Analysis: Distribution by Type of Trial Masking
- Table 21.28. Clinical Trial Analysis: Distribution by Type of Intervention Model
- Table 21.29. Clinical Trial Analysis: Distribution by Trial Purpose
- Table 21.30. Clinical Trial Analysis: Distribution by Design Allocation
- Table 21.31. Leading Industry Players: Distribution by Number of Registered Trials
- Table 21.32. Leading Non-Industry Players: Distribution by Number of Registered Trials
- Table 21.33. Clinical Trial Analysis: Distribution of Clinical Trials by Trial Status and Geography
- Table 21.34. Clinical Trial Analysis: Distribution of Patients Enrolled by Trial Status and Geography
- Table 21.35. Partnerships and Collaborations: Cumulative Year-wise Trend, Since 2016
- Table 21.36. Partnerships and Collaborations: Distribution by Type of Partnership
- Table 21.37. Partnerships and Collaborations: Distribution by Year and Type of Partnership
- Table 21.38. Partnerships and Collaborations: Distribution by Type of Engineering
- Table 21.39. Partnerships and Collaborations: Distribution by Therapeutic Area
- Table 21.40. Most Active Players: Distribution by Number of Partnerships
- Table 21.41. Partnerships and Collaborations: Intracontinental and Intercontinental Agreements
- Table 21.42. Partnerships and Collaborations: Local and International Agreements
- Table 21.43. Grant Analysis: Cumulative Year-wise Trend, Since 2019
- Table 21.44. Grants Analysis: Cumulative Year-wise Trend of Grants by Amount Awarded (USD Million)
- Table 21.45. Grants Analysis: Distribution by Funding Institute Center
- Table 21.46. Grants Analysis: Distribution by Support Period
- Table 21.47. Grants Analysis: Distribution by Funding Institute Center and Support Period
- Table 21.48. Grants Analysis: Distribution by Type of Grant Application
- Table 21.49. Grants Analysis: Distribution by Purpose of Grant Award
- Table 21.50. Grants Analysis: Distribution by Activity Code
- Table 21.51. Grants Analysis: Distribution by Study Section Involved
- Table 21.52. Most Popular Departments: Distribution by Number of Grants
- Table 21.53. Prominent Program Officers: Distribution by Number of Grants
- Table 21.54. Popular Recipient Organizations: Distribution by Number of Grants
- Table 21.55. Popular Recipient Organizations: Distribution by Grant Amount (USD Million)
- Table 21.56. Popular Recipient Organizations: Distribution by States in the US
- Table 21.57. Patent Analysis: Distribution by Type of Patent
- Table 21.58. Patent Analysis: Cumulative Distribution by Patent Publication Year, Since 2019
- Table 21.59. Patent Analysis: Distribution by Patent Application Year, Since 2019
- Table 21.60. Patent Analysis: Year-wise Distribution of Granted Patents and Patent Applications, Since 2019
- Table 21.61. Patent Analysis: Distribution by Patent Jurisdiction
- Table 21.62. Patent Analysis: Cumulative Year-wise Distribution by Type of Applicant
- Table 21.63. Leading Industry Players: Distribution by Number of Patents
- Table 21.64. Leading Non-Industry Players: Distribution by Number of Patents
- Table 21.65. Leading Individual Assignees: Distribution by Number of Patents
- Table 21.66. Patent Analysis: Distribution by Patent Age
- Table 21.67. Fc Engineered and Glycoengineered Antibodies: Patent Valuation
- Table 21.68. Global Fc Engineered and Glycoengineered Antibodies Market, Historical Trends (Since 2019) and Future Estimates (Till 2035) (USD Billion)
- Table 21.69. Global Fc Engineered and Glycoengineered Antibodies Market, Till 2035: Conservative Scenario (USD Billion)
- Table 21.70. Global Fc Engineered and Glycoengineered Antibodies Market, Till 2035: Optimistic Scenario (USD Billion)
- Table 21.71. Fc Engineered and Glycoengineered Antibodies Market: Distribution by Type of Engineering (USD Billion)
- Table 21.72. Fc Engineered and Glycoengineered Antibodies Market for Fc Engineered Antibodies, Till 2035 (USD Billion)
- Table 21.73. Fc Engineered and Glycoengineered Antibodies Market for Glycoengineered Antibodies, Till 2035 (USD Billion)
- Table 21.74. Fc Engineered and Glycoengineered Antibodies Market: Distribution by Type of Therapy (USD Billion)
- Table 21.75. Fc Engineered and Glycoengineered Antibodies Market for Monotherapy, Till 2035 (USD Billion)
- Table 21.76. Fc Engineered and Glycoengineered Antibodies Market for Combination Therapy, Till 2035 (USD Billion)
- Table 21.77. Fc Engineered and Glycoengineered Antibodies Market for Both, Till 2035 (USD Billion)
- Table 21.78. Fc Engineered and Glycoengineered Antibodies Market: Distribution by Therapeutic Area (USD Billion)
- Table 21.79. Fc Engineered and Glycoengineered Antibodies Market for Oncological Disorders, Till 2035 (USD Billion)
- Table 21.80. Fc Engineered and Glycoengineered Antibodies Market for Dermatological Disorders, Till 2035 (USD Billion)
- Table 21.81. Fc Engineered and Glycoengineered Antibodies Market for Autoimmune Disorders, Till 2035 (USD Billion)
- Table 21.82. Fc Engineered and Glycoengineered Antibodies Market for Rare Disorders, Till 2035 (USD Billion)
- Table 21.83. Fc Engineered and Glycoengineered Antibodies Market for Other Disorders, Till 2035 (USD Billion)
- Table 21.84. Fc Engineered and Glycoengineered Antibodies Market: Distribution by Route of Administration (USD Billion)
- Table 21.85. Fc Engineered and Glycoengineered Antibodies Market for Intravenous Route, Till 2035 (USD Billion)
- Table 21.86. Fc Engineered and Glycoengineered Antibodies Market for Subcutaneous Route, Till 2035 (USD Billion)
- Table 21.87. Fc Engineered and Glycoengineered Antibodies Market for Intramuscular Route, Till 2035 (USD Billion)
- Table 21.88. Fc Engineered and Glycoengineered Antibodies Market: Distribution by Key Geographical Regions (USD Billion)
- Table 21.89. Fc Engineered and Glycoengineered Antibodies Market in North America, Till 2035 (USD Billion)
- Table 21.90. Fc Engineered and Glycoengineered Antibodies Market in Europe, Till 2035 (USD Billion)
- Table 21.91. Fc Engineered and Glycoengineered Antibodies Market in Asia-Pacific, Till 2035 (USD Billion)
- Table 21.92. Fc Engineered and Glycoengineered Antibodies Market in Rest of the World, Till 2035 (USD Billion)
- Table 21.93. Commercialized Fc Engineered and Glycoengineered Antibodies Market: AK-105 Sales Forecast, Till 2035 (USD Billion)
- Table 21.94. Commercialized Fc Engineered and Glycoengineered Antibodies Market: BeyfortusTM Sales Forecast, Till 2035 (USD Billion)
- Table 21.95. Commercialized Fc Engineered and Glycoengineered Antibodies Market: Briumvi(R) Sales Forecast, Till 2035 (USD Billion)
- Table 21.96. Commercialized Fc Engineered and Glycoengineered Antibodies Market: Fasenra(R) Sales Forecast, Till 2035 (USD Billion)
- Table 21.97. Commercialized Fc Engineered and Glycoengineered Antibodies Market: Gazyva(R) Sales Forecast, Till 2035 (USD Billion)
- Table 21.98. Commercialized Fc Engineered and Glycoengineered Antibodies Market: Imfinzi(R) Sales Forecast, Till 2035 (USD Billion)
- Table 21.99. Commercialized Fc Engineered and Glycoengineered Antibodies Market: Margenza Sales Forecast, Till 2035 (USD Billion)
- Table 21.100. Commercialized Fc Engineered and Glycoengineered Antibodies Market: Monjuvi(R) Sales Forecast, Till 2035 (USD Billion)
- Table 21.101. Commercialized Fc Engineered and Glycoengineered Antibodies Market: Ocrevus(R) Sales Forecast, Till 2035 (USD Billion)
- Table 21.102. Commercialized Fc Engineered and Glycoengineered Antibodies Market: POTELIGEO(R) Sales Forecast, Till 2035 (USD Billion)
- Table 21.103. Commercialized Fc Engineered and Glycoengineered Antibodies Market: Saphnelo(R) Sales Forecast, Till 2035 (USD Billion)
- Table 21.104. Commercialized Fc Engineered and Glycoengineered Antibodies Market: Skyrizi(R) Sales Forecast, Till 2035 (USD Billion)
- Table 21.105. Commercialized Fc Engineered and Glycoengineered Antibodies Market: Soliris(R) Sales Forecast, Till 2035 (USD Billion)
- Table 21.106. Commercialized Fc Engineered and Glycoengineered Antibodies Market: Tecentriq(R) Sales Forecast, Till 2035 (USD Billion)
- Table 21.107. Commercialized Fc Engineered and Glycoengineered Antibodies Market: Tislelizumab Sales Forecast, Till 2035 (USD Billion)
- Table 21.108. Commercialized Fc Engineered and Glycoengineered Antibodies Market: Tzield(R) Sales Forecast, Till 2035 (USD Billion)
- Table 21.109. Commercialized Fc Engineered and Glycoengineered Antibodies Market: Ultomiris(R) Sales Forecast, Till 2035 (USD Billion)
- Table 21.110. Commercialized Fc Engineered and Glycoengineered Antibodies Market: Uplizna(R) Sales Forecast, Till 2035 (USD Billion)
- Table 21.111. Phase III Fc Engineered and Glycoengineered Antibodies Market: Clazakizumab Sales Forecast, Till 2035 (USD Billion)
- Table 21.112. Phase III Fc Engineered and Glycoengineered Antibodies Market: FPA144 Sales Forecast, Till 2035 (USD Billion)
- Table 21.113. Phase III Fc Engineered and Glycoengineered Antibodies Market: Skyrizi Sales Forecast, Till 2035 (USD Billion)
- Table 21.114. Phase III Fc Engineered and Glycoengineered Antibodies Market: TQ-B2450 Sales Forecast, Till 2035 (USD Billion)
- Table 21.115. Phase III Fc Engineered and Glycoengineered Antibodies Market: VIS649 Sales Forecast, Till 2035 (USD Billion)
List of Figures
- Figure 2.1 Research Methodology: Project Methodology
- Figure 2.2 Research Methodology: Forecast Methodology
- Figure 2.3 Research Methodology: Robust Quality Control
- Figure 2.4 Research Methodology: Key Market Segmentation
- Figure 3.1. Lessons Learnt from Past Recessions
- Figure 4.1. Executive Summary: Overall Market Landscape
- Figure 4.2. Executive Summary: Clinical Trial Analysis
- Figure 4.3. Executive Summary: Partnerships and Collaborations
- Figure 4.4. Executive Summary: Grant Analysis
- Figure 4.5. Executive Summary: Patent Analysis
- Figure 4.6. Executive Summary: Market Sizing and Opportunity Analysis
- Figure 5.1. Structure of an Antibody
- Figure 5.2. Historical Timeline of Antibody Development
- Figure 5.3. Main Functions of Antibodies
- Figure 6.1. Fc Engineered and Glycoengineered Antibodies: Distribution by Stage of Development
- Figure 6.2. Fc Engineered and Glycoengineered Antibodies: Distribution by Type of Antibody
- Figure 6.3. Fc Engineered and Glycoengineered Antibodies: Distribution by Type of Engineering
- Figure 6.4. Fc Engineered and Glycoengineered Antibodies: Distribution by Impact of Engineering
- Figure 6.5. Fc Engineered and Glycoengineered Antibodies: Distribution by Biological Target
- Figure 6.6. Fc Engineered and Glycoengineered Antibodies: Distribution by Type of Therapy
- Figure 6.7. Fc Engineered and Glycoengineered Antibodies: Distribution by Target Disease Indication
- Figure 6.8. Fc Engineered and Glycoengineered Antibodies: Distribution by Therapeutic Area
- Figure 6.9. Fc Engineered and Glycoengineered Antibodies: Distribution by Route of Administration
- Figure 6.10. Popular Fc Engineered Technologies: Distribution by Number of Marketed Drugs Development Programs
- Figure 6.11. Fc Engineered and Glycoengineered Antibodies: Distribution by Year of Establishment
- Figure 6.12. Fc Engineered and Glycoengineered Antibodies: Distribution by Company Size
- Figure 6.13. Fc Engineered and Glycoengineered Antibodies: Distribution by Location of Headquarters
- Figure 6.14. World Map Representation: Analysis by Geography
- Figure 6.15. Leading Developers: Distribution by Number of Drugs
- Figure 7.1. AbbVie: Annual Revenues, Since FY 2019 (USD Billion)
- Figure 7.2. AstraZeneca: Annual Revenues, Since FY 2019 (USD Billion)
- Figure 7.3. Roche (Parent Company of Genentech): Annual Revenues, Since FY 2019 (CHF Billion)
- Figure 7.4. MacroGenics: Annual Revenues, Since FY 2019 (USD Million)
- Figure 7.5. Kyowa Kirin: Annual Revenues, Since FY 2019 (YEN Billion)
- Figure 8.1. Clinical Trial Analysis: Cumulative Year-wise Trend, Since Pre-2015
- Figure 8.2. Clinical Trial Analysis: Year-wise Trend of Patients Enrolled by Trial Registration Year, Since Pre-2015
- Figure 8.3. Clinical Trial Analysis: Distribution by Trial Phase
- Figure 8.4. Clinical Trial Analysis: Distribution of Number of Patients Enrolled by Trial Phase
- Figure 8.5. Clinical Trial Analysis: Distribution by Trial Registration Year and Trial Phase, Since Pre-2015
- Figure 8.6. Clinical Trial Analysis: Distribution by Trial Status
- Figure 8.7. Clinical Trial Analysis: Distribution by Patient Gender
- Figure 8.8. Clinical Trial Analysis: Distribution by Target Indication
- Figure 8.9. Clinical Trial Analysis: Distribution by Type of Trial Masking
- Figure 8.10. Clinical Trial Analysis: Distribution by Type of Intervention Model
- Figure 8.11. Clinical Trial Analysis: Distribution by Trial Purpose
- Figure 8.12. Clinical Trial Analysis: Distribution by Design Allocation
- Figure 8.13. Leading Industry Players: Distribution by Number of Registered Trials
- Figure 8.14. Leading Non-Industry Players: Distribution by Number of Registered Trials
- Figure 8.15. Clinical Trial Analysis: Distribution of Clinical Trials by Trial Status and Geography
- Figure 8.16. Clinical Trial Analysis: Distribution of Patients Enrolled by Trial Status and Geography
- Figure 9.1. Partnerships and Collaborations: Cumulative Year-wise Trend, Since 2016
- Figure 9.2. Partnerships and Collaborations: Distribution by Type of Partnership
- Figure 9.3. Partnerships and Collaborations: Distribution by Year and Type of Partnership
- Figure 9.4. Partnerships and Collaborations: Distribution by Type of Engineering
- Figure 9.5. Partnerships and Collaborations: Distribution by Therapeutic Area
- Figure 9.6. Most Active Players: Distribution by Number of Partnerships
- Figure 9.7. Partnerships and Collaborations: Intracontinental and Intercontinental Agreements
- Figure 9.8. Partnerships and Collaborations: Local and International Agreements
- Figure 10.1. Grant Analysis: Cumulative Year-wise Trend, Since 2019
- Figure 10.2. Grants Analysis: Cumulative Year-wise Trend of Grants by Amount Awarded (USD Million)
- Figure 10.3. Grants Analysis: Distribution by Funding Institute Center
- Figure 10.4. Grants Analysis: Distribution by Support Period
- Figure 10.5. Grants Analysis: Distribution by Funding Institute Center and Support Period
- Figure 10.6. Grants Analysis: Distribution by Type of Grant Application
- Figure 10.7. Grants Analysis: Distribution by Purpose of Grant Award
- Figure 10.8. Grants Analysis: Distribution by Activity Code
- Figure 10.9. Grants Analysis: Distribution by Study Section Involved
- Figure 10.10. Most Popular Departments: Distribution by Number of Grants
- Figure 10.11. Prominent Program Officers: Distribution by Number of Grants
- Figure 10.12. Popular Recipient Organizations: Distribution by Number of Grants
- Figure 10.13. Popular Recipient Organizations: Distribution by Grant Amount (USD Million)
- Figure 10.14. Popular Recipient Organizations: Distribution by States in the US
- Figure 11.1. Patent Analysis: Distribution by Type of Patent
- Figure 11.2. Patent Analysis: Cumulative Distribution by Patent Publication Year, Since 2019
- Figure 11.3. Patent Analysis: Distribution by Patent Application Year, Since Pre-2019
- Figure 11.4. Patent Analysis: Year-wise Distribution of Granted Patents and Patent Applications, Since 2019
- Figure 11.5. Patent Analysis: Distribution by Patent Jurisdiction
- Figure 11.6. Patent Analysis: Distribution by CPC Symbols
- Figure 11.7. Patent Analysis: Cumulative Year-wise Distribution by Type of Applicant
- Figure 11.8. Leading Industry Players: Distribution by Number of Patents
- Figure 11.9. Leading Non-Industry Players: Distribution by Number of Patents
- Figure 11.10. Leading Individual Assignees: Distribution by Number of Patents
- Figure 11.11. Patent Benchmarking Analysis: Distribution of Patent Characteristics (CPC Codes) by Leading Industry Players
- Figure 11.12. Patent Benchmarking Distribution of Leading Industry Players by Patent Characteristics (CPC Codes)
- Figure 11.13. Patent Analysis: Distribution by Patent Age
- Figure 11.14. Fc Engineered and Glycoengineered Antibodies: Patent Valuation
- Figure 12.1. Global Fc Engineered and Glycoengineered Antibodies Market, Historical Trends (Since 2019) and Future Estimates (Till 2035) (USD Billion)
- Figure 12.2. Global Fc Engineered and Glycoengineered Antibodies Market, Till 2035: Conservative Scenario (USD Billion)
- Figure 12.3. Global Fc Engineered and Glycoengineered Antibodies Market, Till 2035: Optimistic Scenario (USD Billion)
- Figure 13.1. Fc Engineered and Glycoengineered Antibodies Market: Distribution by Type of Engineering
- Figure 13.2. Fc Engineered and Glycoengineered Antibodies Market for Fc Engineered Antibodies, Till 2035 (USD Billion)
- Figure 13.3. Fc Engineered and Glycoengineered Antibodies Market for Glycoengineered Antibodies, Till 2035 (USD Billion)
- Figure 14.1. Fc Engineered and Glycoengineered Antibodies Market: Distribution by Type of Therapy
- Figure 14.2. Fc Engineered and Glycoengineered Antibodies Market for Monotherapy, Till 2035 (USD Billion)
- Figure 14.3. Fc Engineered and Glycoengineered Antibodies Market for Combination Therapy, Till 2035 (USD Billion)
- Figure 14.4. Fc Engineered and Glycoengineered Antibodies Market for Both, Till 2035 (USD Billion)
- Figure 15.1. Fc Engineered and Glycoengineered Antibodies Market: Distribution by Therapeutic Area
- Figure 15.2. Fc Engineered and Glycoengineered Antibodies Market for Oncological Disorders, Till 2035 (USD Billion)
- Figure 15.3. Fc Engineered and Glycoengineered Antibodies Market for Dermatological Disorders, Till 2035 (USD Billion)
- Figure 15.4. Fc Engineered and Glycoengineered Antibodies Market for Autoimmune Disorders, Till 2035 (USD Billion)
- Figure 15.5. Fc Engineered and Glycoengineered Antibodies Market for Rare Disorders, Till 2035 (USD Billion)
- Figure 15.6. Fc Engineered and Glycoengineered Antibodies Market for Other Disorders, Till 2035 (USD Billion)
- Figure 16.1. Fc Engineered and Glycoengineered Antibodies Market: Distribution by Route of Administration
- Figure 16.2. Fc Engineered and Glycoengineered Antibodies Market for Intravenous Route, Till 2035 (USD Billion)
- Figure 16.3. Fc Engineered and Glycoengineered Antibodies Market for Subcutaneous Route, Till 2035 (USD Billion)
- Figure 16.4. Fc Engineered and Glycoengineered Antibodies Market for Intramuscular Route, Till 2035 (USD Billion)
- Figure 17.1. Fc Engineered and Glycoengineered Antibodies Market: Distribution by Key Geographical Regions
- Figure 17.2. Fc Engineered and Glycoengineered Antibodies Market in North America, Till 2035 (USD Billion)
- Figure 17.3. Fc Engineered and Glycoengineered Antibodies Market in Europe, Till 2035 (USD Billion)
- Figure 17.4. Fc Engineered and Glycoengineered Antibodies Market in Asia-Pacific, Till 2035 (USD Billion)
- Figure 17.5. Fc Engineered and Glycoengineered Antibodies Market in Rest of the World, Till 2035 (USD Billion)
- Figure 18.1. Commercialized Fc Engineered and Glycoengineered Antibodies Market: AK-105 Sales Forecast, Till 2035 (USD Billion)
- Figure 18.2. Commercialized Fc Engineered and Glycoengineered Antibodies Market: BeyfortusTM Sales Forecast, Till 2035 (USD Billion)
- Figure 18.3. Commercialized Fc Engineered and Glycoengineered Antibodies Market: Briumvi(R) Sales Forecast, Till 2035 (USD Billion)
- Figure 18.4. Commercialized Fc Engineered and Glycoengineered Antibodies Market: Fasenra(R) Sales Forecast, Till 2035 (USD Billion)
- Figure 18.5. Commercialized Fc Engineered and Glycoengineered Antibodies Market: Gazyva(R) Sales Forecast, Till 2035 (USD Billion)
- Figure 18.6. Commercialized Fc Engineered and Glycoengineered Antibodies Market: Imfinzi(R) Sales Forecast, Till 2035 (USD Billion)
- Figure 18.7. Commercialized Fc Engineered and Glycoengineered Antibodies Market: Margenza Sales Forecast, Till 2035 (USD Billion)
- Figure 18.8. Commercialized Fc Engineered and Glycoengineered Antibodies Market: Monjuvi(R) Sales Forecast, Till 2035 (USD Billion)
- Figure 18.9. Commercialized Fc Engineered and Glycoengineered Antibodies Market: Ocrevus(R) Sales Forecast, Till 2035 (USD Billion)
- Figure 18.10. Commercialized Fc Engineered and Glycoengineered Antibodies Market: POTELIGEO(R) Sales Forecast, Till 2035 (USD Billion)
- Figure 18.11. Commercialized Fc Engineered and Glycoengineered Antibodies Market: Saphnelo(R) Sales Forecast, Till 2035 (USD Billion)
- Figure 18.12. Commercialized Fc Engineered and Glycoengineered Antibodies Market: Skyrizi(R) Sales Forecast, Till 2035 (USD Billion)
- Figure 18.13. Commercialized Fc Engineered and Glycoengineered Antibodies Market: Soliris(R) Sales Forecast, Till 2035 (USD Billion)
- Figure 18.14. Commercialized Fc Engineered and Glycoengineered Antibodies Market: Tecentriq(R) Sales Forecast, Till 2035 (USD Billion)
- Figure 18.15. Commercialized Fc Engineered and Glycoengineered Antibodies Market: Tislelizumab Sales Forecast, Till 2035 (USD Billion)
- Figure 18.16. Commercialized Fc Engineered and Glycoengineered Antibodies Market: Tzield(R) Sales Forecast, Till 2035 (USD Billion)
- Figure 18.17. Commercialized Fc Engineered and Glycoengineered Antibodies Market: Ultomiris(R) Sales Forecast, Till 2035 (USD Billion)
- Figure 18.18. Commercialized Fc Engineered and Glycoengineered Antibodies Market: Uplizna(R) Sales Forecast, Till 2035 (USD Billion)
- Figure 18.19. Phase III Fc Engineered and Glycoengineered Antibodies Market: Clazakizumab Sales Forecast, Till 2035 (USD Billion)
- Figure 18.20. Phase III Fc Engineered and Glycoengineered Antibodies Market: FPA144 Sales Forecast, Till 2035 (USD Billion)
- Figure 18.21. Phase III Fc Engineered and Glycoengineered Antibodies Market: Skyrizi Sales Forecast, Till 2035 (USD Billion)
- Figure 18.22. Phase III Fc Engineered and Glycoengineered Antibodies Market: TQ-B2450 Sales Forecast, Till 2035 (USD Billion)
- Figure 18.23. Phase III Fc Engineered and Glycoengineered Antibodies Market: VIS649 Sales Forecast, Till 2035 (USD Billion)
- Figure 19.1. Concluding Remarks: Fc Engineered and Glycoengineered Antibodies: Overall Market Landscape
- Figure 19.2. Concluding Remarks: Fc Engineered and Glycoengineered Antibodies: Clinical Trial Analysis
- Figure 19.3. Concluding Remarks: Fc Engineered and Glycoengineered Antibodies: Partnerships and Collaborations
- Figure 19.4. Concluding Remarks: Fc Engineered and Glycoengineered Antibodies: Grant Analysis
- Figure 19.5. Concluding Remarks: Fc Engineered and Glycoengineered Antibodies: Patent Analysis
- Figure 19.6. Concluding Remarks: Fc Engineered and Glycoengineered Antibodies: Market Sizing and Opportunity Analysis (I/II)
- Figure 19.7. Concluding Remarks: Fc Engineered and Glycoengineered Antibodies: Market Sizing and Opportunity Analysis (II/II)
FC AND GLYCOENGINEERED ANTIBODIES MARKET: OVERVIEW
As per Roots Analysis, the global Fc and glycoengineered antibodies market is valued at USD 38.8 billion in the current year and is expected to grow at a lucrative CAGR during the forecast period, till 2035.
The market sizing and opportunity analysis has been segmented across the following parameters:
Type of Engineering
- Fc Engineered Antibodies
- Glycoengineered Antibodies
Type of Therapy
- Monotherapy
- Combination Therapy
- Both
Therapeutic Area
- Autoimmune Disorders
- Dermatological Disorders
- Oncological Disorders
- Rare Diseases
- Other Disorders
Route of Administration
- Intravenous Route
- Subcutaneous Route
- Intramuscular Route
Key Geographical Regions
- North America
- Europe
- Asia-Pacific
- Rest of the World
FC AND GLYCOENGINEERED ANTIBODIES MARKET: GROWTH AND TRENDS
With close to 100 approved monoclonal antibodies, and over 550 molecules in the clinical pipeline, antibody based pharmacological interventions have become one of the fastest growing segments of the biopharmaceutical industry. Further, within the antibody therapeutics industry, engineered antibodies, developed by modifying the fragment crystallizable (Fc) region, have garnered significant interest over the past few years. The modifications, such as glycoengineered antibodies, protein engineering or isotype chimerism in the Fc fusion protein of an antibody have shown to augment the various effector functions, such as antibody-dependent cellular cytotoxicity (ADCC), complement-dependent cytotoxicity (CDC), antibody-dependent cellular phagocytosis (ADCP) activity and / or the half-life of the molecule. Moreover, several Fc engineering technologies enable the suppression of the effector functions in certain pathways and are being actively explored for development of anti-cancer antibodies.
The consistent research efforts in this domain have resulted into the emergence of two groundbreaking drugs, namely Gazyva (for Chronic Lymphocytic Leukemia) and POTELEGIO (for Sezary syndrome). Further, several other Fc engineered antibody products, including Margenza, MONJUVI and SKYRIZI have also received approval in the past few years. More recently, Fc engineered antibody, named Epcoritamab, received approval for the treatment of diffuse large B-cell lymphoma. Further, there are several drugs in the development pipeline, which are being investigated by various small and established pharmaceutical companies. With the promising clinical results coupled with ongoing technological developments, the market for Fc engineered antibodies is likely to evolve at a commendable pace over the next decade.
FC AND GLYCOENGINEERED ANTIBODIES MARKET: KEY INSIGHTS
The report delves into the current state of the Fc and glycoengineered antibodies market and identifies potential growth opportunities within industry. Some key findings from the report include:
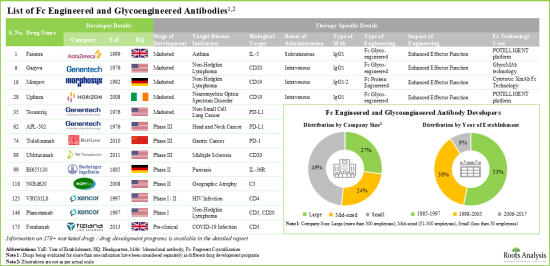
- Fc engineered antibodies pipeline features more than 40 marketed drugs, and 131 drug development programs intended for the treatment of various diseases; these are primarily developed by mid and large-sized players.
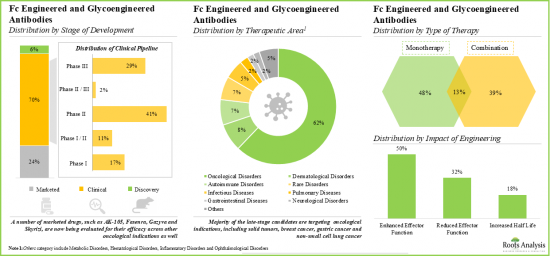
- Majority (62%) of the interventions targeting oncological disorders are in clinical phase of development; of these, most (81%) of the antibodies are Fc engineered.
- Close to 150 grants have been awarded in the past few years in the domain of Fc engineered and glycoengineered antibodies; NIAID emerged as the top funding institute for these grants.
- Over time, the intellectual property related to Fc engineered and glycoengineered antibodies has grown at a commendable pace, with patents being filed by both industry and non-industry players.
- Close to half a million patients have been recruited / enrolled in clinical trials registered for the evaluation of Fc engineered and glycoengineered antibodies, across different geographies.
- Since 2016, more than 70 agreements have been inked by various industry and non-industry players, in order to further enhance their manufacturing portfolio related to pharmaceutical contract manufacturing.
- Driven by the promising development pipeline, the market for Fc engineered and glycoengineered antibodies is likely to grow at a steady pace in the coming years.
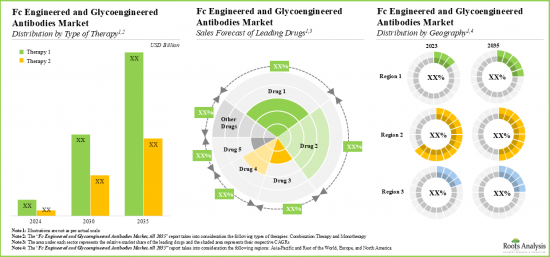
- In terms of revenues from the sales of marketed and late-stage therapies, the future opportunity is anticipated to be well dispersed across different types of therapy across the globe.
FC AND GLYCOENGINEERED ANTIBODIES MARKET: KEY SEGMENTS
Fc Engineered Antibodies Segment holds the Largest Share of the Fc and Glycoengineered Antibodies Market
Based on the type of Fc engineering, the market is segmented into Fc engineered antibodies and glycoengineered antibodies. At present, the Fc engineered antibodies segment holds the maximum share of the global Fc and glycoengineered antibodies market. This trend is likely to remain the same in the coming years owing to the fact that Fc engineering enhances effector functions, improving the therapeutic efficacy of the modality.
By Type of Therapy, Monotherapy Segment Accounts for the Largest Share of the Global Fc and Glycoengineered Antibodies Market
Based on the type of therapy, the market is segmented into monotherapy, combination therapy and both. Currently, the monotherapy segment captures the highest proportion of the global Fc and glycoengineered antibodies market owing to the several benefits associated with monotherapy, such as easy regulatory pathways, reduced potential drug interactions and cost effectiveness.
By Therapeutic Area, Autoimmune Disorders is the Fastest Growing Segment of the Global Fc and Glycoengineered Antibodies Market
Based on the therapeutic area, the market is segmented into autoimmune disorders, dermatological disorders, oncological disorders, rare diseases and other disorders. At present, the oncological disorders segment holds the maximum share of the global Fc and glycoengineered antibodies market. However, the market for autoimmune disorders segment is expected to grow at a higher CAGR during the forecasted period.
The Intravenous Route Segment Account for the Largest Share of the Global Fc and Glycoengineered Antibodies Market
Based on the route of administration, the market is segmented into intravenous route, subcutaneous route and intramuscular route of administration. Currently, the global Fc and glycoengineered antibodies market is dominated by the Fc and glycoengineered antibodies for intravenous route of administration. This is due to the fact that intravenous route provides complete systemic distribution of antibodies facilitating enhanced therapeutic efficacy and bioavailability.
North America Accounts for the Largest Share of the Market
Based on key geographical regions, the market is segmented into North America, Europe, Asia-Pacific and Rest of the World. Currently, North America dominates the global Fc and glycoengineered antibodies market and accounts for the largest revenue share. Further, the market Asia-Pacific is likely to grow at a higher CAGR in the coming future.
Example Players in the Fc and Glycoengineered Antibodies Market
- AbbVie
- Akesobio
- Alexion Pharmaceuticals
- Amgen
- AstraZeneca
- Boehringer Ingelheim
- Genentech
- MacroGenics
- MorphoSys
- Kyowa Kirin
- Xencor
FC AND GLYCOENGINEERED ANTIBODIES MARKET: RESEARCH COVERAGE
- Market Sizing and Opportunity Analysis: The report features an in-depth analysis of the global Fc and glycoengineered antibodies market, focusing on key market segments, including [A] type of engineering, [B] type of therapy, [C] therapeutic area, [D] route of administration and [E] key geographical regions.
- Market Landscape: A comprehensive evaluation of Fc and glycoengineered antibodies, based on several relevant parameters, such as [A] phase of development, [B] type of engineering, [C] impact of engineering, [D] biological target, [E] type of therapy, [F] target disease indication, [G] therapeutic area, [H] route of administration and [I] popular Fc engineering technologies.
- Company Profiles: In-depth profiles of key players that are currently involved in the development of Fc engineered antibodies, focusing on [A] overview of the company, [B] financial information (if available) [C] drug portfolio and [D] recent developments and an informed future outlook.
- Clinical Trial Analysis: An insightful analysis of clinical trials related to Fc and glycoengineered antibodies, based on several parameters, such as [A] trial registration year, [B] trial status, [C] trial phase, [D] enrolled patient population, [E] type of sponsor, [F] most active industry players (in terms of number of trials conducted), [F] study design, [G] target indication and [H] key geographical regions.
- Partnerships and Collaborations: An insightful analysis of the deals inked by stakeholders in this domain, based on several parameters, such as [A] year of partnership, [B] type of partnership, [C] type of engineering, [D] therapeutic area, [E] most active players (in terms of the number of partnerships signed) and [F] regional distribution of the companies involved in these agreements.
- Grants Analysis: A comprehensive assessment of grants that have been awarded to research institutes for projects related to Fc and glycoengineered antibodies, based on various relevant parameters, such as [A] year of grant award, [B] amount awarded, [C] funding institute center, [D] support period, [E] type of grant application, [F] purpose of grant award, [G] activity code, [H] study section involved, [I] most popular NIH departments, [J] prominent program officers and [K] popular recipient organizations.
- Patent Analysis: An in-depth analysis of patents filed / granted till date related to Fc and glycoengineering antibodies, based on various relevant parameters, such as [A] type of patent, [B] publication year, [C] application year, [D] type of applicant, [E] geographical location, [E] CPC symbols, [F] most active players and [G] patent valuation analysis.
KEY QUESTIONS ANSWERED IN THIS REPORT
- How many companies are currently engaged in this market?
- Which are the leading companies in this market?
- What factors are likely to influence the evolution of this market?
- What is the current and future market size?
- What is the CAGR of this market?
- How is the current and future market opportunity likely to be distributed across key market segments?
REASONS TO BUY THIS REPORT
- The report provides a comprehensive market analysis, offering detailed revenue projections of the overall market and its specific sub-segments. This information is valuable to both established market leaders and emerging entrants.
- Stakeholders can leverage the report to gain a deeper understanding of the competitive dynamics within the market. By analyzing the competitive landscape, businesses can make informed decisions to optimize their market positioning and develop effective go-to-market strategies.
- The report offers stakeholders a comprehensive overview of the market, including key drivers, barriers, opportunities, and challenges. This information empowers stakeholders to stay abreast of market trends and make data-driven decisions to capitalize on growth prospects.
ADDITIONAL BENEFITS
- Complimentary PPT Insights Packs
- Complimentary Excel Data Packs for all Analytical Modules in the Report
- 15% Free Content Customization
- Detailed Report Walkthrough Session with Research Team
- Free Updated report if the report is 6-12 months old or older
TABLE OF CONTENTS
1. PREFACE
- 1.1. Introduction
- 1.2. Market Share Insights
- 1.3. Key Market Insights
- 1.4. Report Coverage
- 1.5. Key Questions Answered
- 1.6. Chapter Outlines
2 RESEARCH METHODOLOGY
- 2.1. Chapter Overview
- 2.2. Research Assumptions
- 2.3. Project Methodology
- 2.4. Forecast Methodology
- 2.5. Robust Quality Control
- 2.6. Key Considerations
- 2.6.1. Demographics
- 2.6.2. Economic Factors
- 2.6.3. Government Regulations
- 2.6.4. Supply Chain
- 2.6.5. COVID Impact / Related Factors
- 2.6.6. Market Access
- 2.6.7. Healthcare Policies
- 2.6.8. Industry Consolidation
- 2.7. Key Market Segmentations
3. ECONOMIC AND OTHER PROJECT SPECIFIC CONSIDERATIONS
- 3.1. Chapter Overview
- 3.2. Market Dynamics
- 3.2.1. Time Period
- 3.2.1.1. Historical Trends
- 3.2.1.2. Current and Forecasted Estimates
- 3.2.2. Currency Coverage
- 3.2.2.1. Major Currencies Affecting the Market
- 3.2.2.2. Impact of Currency Fluctuations on the Industry
- 3.2.2.3. Foreign Exchange Impact
- 3.2.2.4. Evaluation of Foreign Exchange Rates and Their Impact on Market
- 3.2.2.5. Strategies for Mitigating Foreign Exchange Risk
- 3.2.3. Recession
- 3.2.3.1. Historical Analysis of Past Recessions and Lessons Learnt
- 3.2.3.2. Assessment of Current Economic Conditions and Potential Impact on the Market
- 3.2.4. Inflation
- 3.2.4.1. Measurement and Analysis of Inflationary Pressures in the Economy
- 3.2.4.2. Potential Impact of Inflation on the Market Evolution
- 3.2.1. Time Period
4. EXECUTIVE SUMMARY
- 4.1. Chapter Overview
5. INTRODUCTION
- 5.1. Chapter Overview
- 5.2. Structure of Antibodies
- 5.3. Historical Timeline of Antibody Development
- 5.4. Antibody Isotypes
- 5.5. Mechanism of Action of Antibodies
- 5.6. Fc Region and Effector Functions
- 5.6.1. Types of Fc Receptors
- 5.6.2. Engineering of the Fc Region
- 5.6.2.1. Glycoengineering
- 5.6.2.2. Protein Engineering
- 5.6.2.3. Isotype Chimerism
- 5.7. Future Perspective
6. MARKET LANDSCAPE
- 6.1. Chapter Overview
- 6.2. Fc Engineered and Glycoengineered Antibodies: Overall Pipeline
- 6.2.1. Analysis by Stage of Development
- 6.2.2. Analysis by Type of Antibody
- 6.2.3. Analysis by Type of Engineering
- 6.2.4. Analysis by Impact of Engineering
- 6.2.5. Analysis by Biological Target
- 6.2.6. Analysis by Type of Therapy
- 6.2.7. Analysis by Target Disease Indication
- 6.2.8. Analysis by Therapeutic Area
- 6.2.9. Analysis by Route of Administration
- 6.2.10. Popular Fc Engineering Technologies: Analysis by Number of Marketed Drugs and Development Programs
- 6.3. Fc Engineered and Glycoengineered Antibodies: Overall Developer Landscape
- 6.3.1. Analysis by Year of Establishment
- 6.3.2. Analysis by Company Size
- 6.3.3. Analysis by Location of Headquarters
- 6.3.4. Leading Developers: Analysis by Number of Drugs
7. COMPANY PROFILES
- 7.1. Chapter Overview
- 7.2. Detailed Company Profiles of Leading Fc Engineered and Glycoengineered Antibody Drug Developers
- 7.2.1. AbbVie
- 7.2.1.1. Company Overview
- 7.2.1.2. Financial Information
- 7.2.1.3. Drug Portfolio
- 7.2.1.3.1. Drug Profile: Skyrizi
- 7.2.1.4. Recent Developments and Future Outlook
- 7.2.2. Alexion Pharmaceuticals
- 7.2.2.1. Company Overview
- 7.2.2.2. Drug Portfolio
- 7.2.2.2.1. Drug Profile: Soliris
- 7.2.2.2.2. Drug Profile: Ultomiris
- 7.2.2.3. Recent Developments and Future Outlook
- 7.2.3. AstraZeneca
- 7.2.3.1. Company Overview
- 7.2.3.2. Financial Information
- 7.2.3.3. Drug Portfolio
- 7.2.3.3.1. Drug Profile: Beyfortus
- 7.2.3.3.2. Drug Profile: Imfinzi
- 7.2.3.3.3. Drug Profile: Fasenra
- 7.2.3.3.4. Drug Profile: Saphnelo
- 7.2.3.4. Recent Developments and Future Outlook
- 7.2.4. Genentech
- 7.2.4.1. Company Overview
- 7.2.4.2. Financial Information
- 7.2.4.3. Drug Portfolio
- 7.2.4.3.1. Drug Profile: Gazyva
- 7.2.4.3.2. Drug Profile: Ocrevus
- 7.2.4.3.3. Drug Profile: Tecentriq
- 7.2.4.4. Recent Developments and Future Outlook
- 7.2.5. MacroGenics
- 7.2.5.1. Company Overview
- 7.2.5.2. Financial Information
- 7.2.5.3. Drug Portfolio
- 7.2.5.3.1. Drug Profile: Margenza
- 7.2.5.3.2. Drug Profile: MGA-271
- 7.2.5.4. Recent Developments and Future Outlook
- 7.2.6. Kyowa Kirin
- 7.2.6.1. Company Overview
- 7.2.6.2. Financial Information
- 7.2.6.3. Drug Portfolio
- 7.2.6.3.1. Drug Profile: POTELIGEO
- 7.2.6.4. Recent Developments and Future Outlook
- 7.2.1. AbbVie
- 7.3. Short Company Profiles of Leading Fc Engineered and Glycoengineered Antibody Drug Developers
- 7.3.1. Akeso Biopharma
- 7.3.1.1. Company Overview
- 7.3.1.2. Drug Portfolio
- 7.3.1.2.1. Drug Profile: Penpulimab
- 7.3.2. Amgen
- 7.3.2.1. Company Overview
- 7.3.2.2. Drug Portfolio
- 7.3.2.2.1. Drug Profile: Bemarituzuman
- 7.3.2.2.2. Drug Profile: STEAP1 XmAb Antibody
- 7.3.2.2.3. Drug Profile: FPA157
- 7.3.3. Boehringer Ingelheim
- 7.3.3.1. Company Overview
- 7.3.3.2. Drug Portfolio
- 7.3.3.2.2. Drug Profile: Spesolimab
- 7.3.4. MorphoSys
- 7.3.4.1. Company Overview
- 7.3.4.2. Drug Portfolio
- 7.3.4.2.1. Drug Portfolio: Tafasitamab
- 7.3.5. Xemcor
- 7.3.5.1. Company Overview
- 7.3.5.2. Drug Portfolio
- 7.3.5.2.1. Drug Portfolio: Tidutamab
- 7.3.5.2.2. Drug Portfolio: XmAb22841
- 7.3.5.2.3. Drug Portfolio: XmAb23104
- 7.3.5.2.4. Drug Portfolio: Plamotamab
- 7.3.5.2.5. Drug Portfolio: Vibecotamab
- 7.3.5.2.6. Drug Portfolio: RO7310729
- 7.3.5.2.7. Drug Portfolio: XmAb20717
- 7.3.5.2.8. Drug Portfolio: XmAb819
- 7.3.5.2.9. Drug Portfolio: XmAb27564
- 7.3.5.2.10. Drug Portfolio: VRC01LS
- 7.3.1. Akeso Biopharma
8. CLINICAL TRIAL ANALYSIS
- 8.1. Chapter Overview
- 8.2. Scope and Methodology
- 8.3. Fc Engineered and Glycoengineered Antibodies: Clinical Trial Analysis
- 8.3.1. Analysis by Trial Registration Year
- 8.3.2. Analysis of Number of Patients Enrolled by Trial Registration Year
- 8.3.3. Analysis by Trial Phase
- 8.3.4. Analysis of Number of Patients Enrolled by Trial Phase
- 8.3.5. Analysis by Trial Registration Year and Trial Phase
- 8.3.6. Analysis by Trial Status
- 8.3.7. Analysis by Patient Gender
- 8.3.8. Analysis by Target Indication
- 8.3.9. Analysis by Study Design
- 8.3.9.1. Analysis by Type of Trial Masking
- 8.3.9.2. Analysis by Type of Intervention Model
- 8.3.9.3. Analysis by Type of Trial Purpose
- 8.3.9.4. Analysis by Design Allocation
- 8.3.10. Most Active Sponsor / Collaborator: Analysis by Number of Registered Trials
- 8.3.10.1. Analysis by Leading Industry Players
- 8.3.10.2. Analysis by Leading Non-Industry Players
- 8.3.11. Analysis by Geography
- 8.3.11.1. Analysis of Clinical Trials by Trial Status and Geography
- 8.3.11.2. Analysis of Patients Enrolled by Trial Status and Geography
9. PARTNERSHIPS AND COLLABORATIONS
- 9.1. Chapter Overview
- 9.2. Partnership Models
- 9.3. Fc Engineered and Glycoengineered Antibodies: Partnerships and Collaborations
- 9.3.1. Analysis by Year of Partnership
- 9.3.2. Analysis by Type of Partnership
- 9.3.3. Analysis by Year and Type of Partnership
- 9.3.4. Analysis by Type of Engineering
- 9.3.5. Analysis by Therapeutic Area
- 9.3.6. Most Active Players: Analysis by Number of Partnerships
- 9.3.7. Analysis by Geography
- 9.3.7.1. Intracontinental and Intercontinental Agreements
- 9.3.7.2. Local and International Agreements
10. GRANT ANALYSIS
- 10.1. Chapter Overview
- 10.2. Scope and Methodology
- 10.3. Fc Engineered and Glycoengineered Antibodies: Grant Analysis
- 10.3.1. Analysis by Year of Grant Award
- 10.3.2. Analysis by Amount Awarded
- 10.3.3. Analysis by Funding Institute Center
- 10.3.4. Analysis by Support Period
- 10.3.5. Analysis by Funding Institute Center and Support Period
- 10.3.6. Analysis by Type of Grant Application
- 10.3.7. Analysis by Purpose of Grant Award
- 10.3.8. Analysis by Activity Code
- 10.3.9. Analysis by Study Section Involved
- 10.3.10. Most Popular NIH Departments: Analysis by Number of Grants
- 10.3.10.1. Prominent Program Officers: Analysis By Number of Grants
- 10.3.10.2. Popular Recipient Organizations: Analysis by Number of Grants
- 10.3.10.3. Popular Recipient Organizations: Analysis by Grant Amount
- 10.3.11. Popular Recipient Organizations: Distribution by States in the US
11. PATENT ANALYSIS
- 11.1. Chapter Overview
- 11.2. Scope and Methodology
- 11.3. Fc Engineered and Glycoengineered Antibodies: Patent Analysis
- 11.3.1. Analysis by Patent Publication Year
- 11.3.2. Analysis by Patent Application Year
- 11.3.3. Analysis by Granted Patents and Patent Applications, Since 2019
- 11.3.4. Analysis by Patent Jurisdiction
- 11.3.5. Analysis by CPC Symbols
- 11.3.6. Analysis by Type of Applicant
- 11.3.7. Leading Industry Players: Analysis by Number of Patents
- 11.3.8. Leading Non-Industry Players: Analysis by Number of Patents
- 11.3.9. Leading Patent Assignees: Analysis by Number of Patents
- 11.3.10. Patent Benchmarking Analysis
- 11.3.10.1. Analysis by Patent Characteristics
- 11.3.11. Patent Valuation
- 11.3.12. Leading Patents by Number of Citations
12. GLOBAL Fc ENGINEERED AND GLYCOENGINEERED ANTIBODIES MARKET
- 12.1. Chapter Overview
- 12.2. Key Assumptions and Methodology
- 12.3. Global Fc Engineered and Glycoengineered Antibodies Market, Historical Trends (Since 2019) and Future Estimates (Till 2035)
- 12.3.1. Scenario Analysis
- 12.3.1.1. Conservative Scenario
- 12.3.1.2. Optimistic Scenario
- 12.3.1. Scenario Analysis
- 12.4. Key Market Segmentations
13. Fc ENGINEERED AND GLYCOENGINEERED ANTIBODIES MARKET, BY TYPE OF ENGINEERING
- 13.1. Chapter Overview
- 13.2. Key Assumptions and Methodology
- 13.3. Fc Engineered and Glycoengineered Antibodies Market: Distribution by Type of Engineering
- 13.3.1. Fc Engineered Antibodies Market, Till 2035
- 13.3.2. Glycoengineered Antibodies Market, Till 2035
- 13.4. Data Triangulation and Validation
14. Fc ENGINEERED AND GLYCOENGINEERED ANTIBODIES MARKET, BY TYPE OF THERAPY
- 14.1. Chapter Overview
- 14.2. Key Assumptions and Methodology
- 14.3. Fc Engineered and Glycoengineered Antibodies Market: Distribution by Type of Therapy
- 14.3.1. Fc Engineered and Glycoengineered Market for Monotherapy, Till 2035
- 14.3.2. Fc Engineered and Glycoengineered Market for Combination Therapy, Till 2035
- 14.3.3. Fc Engineered and Glycoengineered Market for Both, Till 2035
- 14.4. Data Triangulation and Validation
15. Fc ENGINEERED AND GLYCOENGINEERED ANTIBODIES MARKET, BY THERAPEUTIC AREA
- 15.1. Chapter Overview
- 15.2. Key Assumptions and Methodology
- 15.3. Fc Engineered and Glycoengineered Antibodies Market: Distribution by Therapeutic Area
- 15.3.1. Fc Engineered and Glycoengineered Market for Oncological Disorders, Till 2035
- 15.3.2. Fc Engineered and Glycoengineered Market for Dermatological Disorders, Till 2035
- 15.3.3. Fc Engineered and Glycoengineered Market for Autoimmune Disorders, Till 2035
- 15.3.4. Fc Engineered and Glycoengineered Market for Rare Disorders, Till 2035
- 15.3.5. Fc Engineered and Glycoengineered Market for Other Disorders, Till 2035
- 15.4. Data Triangulation and Validation
16. Fc ENGINEERED AND GLYCOENGINEERED ANTIBODIES MARKET, BY ROUTE OF ADMINISTRATION
- 16.1. Chapter Overview
- 16.2. Key Assumptions and Methodology
- 16.3. Fc Engineered and Glycoengineered Antibodies Market: Distribution by Route of Administration
- 16.3.1. Fc Engineered and Glycoengineered Market for Intravenous Route, Till 2035
- 16.3.2. Fc Engineered and Glycoengineered Market for Subcutaneous Route, Till 2035
- 16.3.3. Fc Engineered and Glycoengineered Market for Intramuscular Route, Till 2035
- 16.4. Data Triangulation and Validation
17. Fc ENGINEERED AND GLYCOENGINEERED ANTIBODIES MARKET, BY KEY GEOGRAPHICAL REGIONS
- 17.1. Chapter Overview
- 17.2. Key Assumptions and Methodology
- 17.3. Fc Engineered and Glycoengineered Antibodies Market: Distribution by Key Geographical Regions
- 17.3.1. Fc Engineered and Glycoengineered Market in North America, Till 2035
- 17.3.2. Fc Engineered and Glycoengineered Market in Europe, Till 2035
- 17.3.3. Fc Engineered and Glycoengineered Market in Asia-Pacific, Till 2035
- 17.3.4. Fc Engineered and Glycoengineered Market in Rest of the World, Till 2035
- 17.4. Data Triangulation and Validation
18. Fc ENGINEEREDAND GLYCOENGINEERED ANTIBODIES MARKET, SALES FORECAST OF DRUGS
- 18.1. Chapter Overview
- 18.2. Key Assumptions and Methodology
- 18.3. Commercialized Fc Engineered and Glycoengineered Antibodies Market: Sales Forecast
- 18.3.1. AK-105 Sales Forecast
- 18.3.2. BeyfortusTM Sales Forecast
- 18.3.3. Briumvi(R) Sales Forecast
- 18.3.4. Fasenra(R) Sales Forecast
- 18.3.5. Gazyva(R) Sales Forecast
- 18.3.6. Imfinzi(R) Sales Forecast
- 18.3.7. Margenza Sales Forecast
- 18.3.8. Monjuvi(R) Sales Forecast
- 18.3.9. Ocrevus(R) Sales Forecast
- 18.3.10. POTELIGEO(R) Sales Forecast
- 18.3.11. Saphnelo(R) Sales Forecast
- 18.3.12. Skyrizi(R) Sales Forecast
- 18.3.13. Soliris(R) Sales Forecast
- 18.3.14. Tecentriq(R) Sales Forecast
- 18.3.15. Tislelizumab Sales Forecast
- 18.3.16. Tzield(R) Sales Forecast
- 18.3.17. Ultomiris(R) Sales Forecast
- 18.3.18. Uplizna(R) Sales Forecast
- 18.4. Phase III Fc Engineered and Glycoengineered Antibodies Market: Sales Forecast
- 18.4.1. Clazakizumab Sales Forecast
- 18.4.2. FPA144 Sales Forecast
- 18.4.3. Skyrizi Sales Forecast
- 18.4.4. TQ-B2450 Sales Forecast
- 18.4.5. Visterra Sales Forecast
- 18.5. Data Triangulation and Validation
19. CONCLUDING REMARKS
- 19.1. Chapter Overview
