
|
市場調査レポート
商品コード
1762532
医療機器受託製造市場:業界動向と世界の予測 - 応用分野別、機器クラス別、対象治療領域別、主要地域別Medical Device Contract Manufacturing Market: Industry Trends and Global Forecasts - Distribution by Application Area, Device Class, Target Therapeutic Area, Key Geographical Regions |
||||||
カスタマイズ可能
|
|||||||
| 医療機器受託製造市場:業界動向と世界の予測 - 応用分野別、機器クラス別、対象治療領域別、主要地域別 |
|
出版日: 2025年07月04日
発行: Roots Analysis
ページ情報: 英文 560 Pages
納期: 即日から翌営業日
|

全表示
- 概要
- 図表
- 目次
医療機器受託製造市場:概要
世界の医療機器受託製造の市場規模は、今年788億米ドルとなりました。同市場は、予測期間中に8.2%のCAGRで拡大すると予測されています。
市場セグメンテーションでは、市場規模および機会分析を以下のパラメータで区分しています:
応用分野
- 治療用医療機器
- 診断用医療機器
- ドラッグデリバリー医療機器
- その他のデバイス
機器クラス
- クラスI
- クラスII
- クラスIII
対象治療領域
- 心血管疾患
- 中枢神経系疾患
- 代謝疾患
- 腫瘍学的疾患
- 眼科疾患
- 整形外科疾患
- 疼痛障害
- 呼吸器疾患
- その他
主な地域
- 北米(米国)
- 欧州(イタリア、ドイツ、フランス、スペイン、英国、その他)
- アジア太平洋(中国、日本、インド)
- その他の地域
医療機器受託製造市場:成長と動向
過去50年間、医療機器業界では、低侵襲手術器具の導入やペースメーカーのような埋込み型機器の台頭など、いくつかの注目すべき開発が行われてきました。さらに、毎年何100万人もの人が手術や移植を受けていることから、プロテーゼのような生体医療機器の使用も時間の経過とともに大幅に増加しています。さらに、心臓除細動器、人工股関節や人工膝関節、コンタクトレンズ、心臓ペースメーカーなどは、最も一般的に移植される医療機器の一部であり、固定装置や人工関節は全医療機器の約44%を占めています。これは、ヘルスケア領域における医療機器の需要が高まっていることを示しています。しかし、ほとんどの開発者は、医療機器や関連部品を製造するための十分なリソースや必要な専門知識を持ち合わせていません。
医療機器CROの台頭を考えると、医療機器に精通したCMOの活躍の場も着実に広がっています。2000年以降、65以上のCMOが設立されていることは注目に値します。さらに、世界保健機関(WHO)の報告によると、世界で約200万種類の医療機器が存在し、7,000以上の汎用機器カテゴリーに分類されています。特筆すべきは、CMOが大きなコストメリット、洗練された最新のインフラへのアクセス、大規模な生産能力、市場投入までの時間の短縮を提供することが知られていることです。その結果、医療機器受託製造サービスプロバイダーの機会は着実に拡大しています。
医療機器受託製造市場:主要インサイト
当レポートでは、医療機器受託製造市場の現状を掘り下げ、業界内の潜在的な成長機会を特定しています。主な調査結果は以下の通りです。
- 斬新な技術とプラットフォームが、多くの中小医療機器企業の設立と成功の主な要因の一つとして浮上しています。
- 規制への対応や承認に伴う複雑さ、製造コストの増加、多様な技術により、スポンサーは機器のライフサイクル全体をサポートできる製造パートナーを求めています。
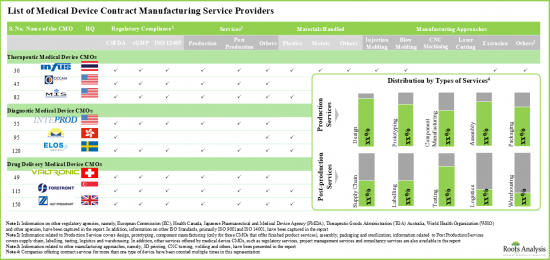
- 世界275社以上が、治療・診断用製品を含む様々なタイプの医療機器に製造受託サービスを提供するために必要な専門知識と認可を有しています。
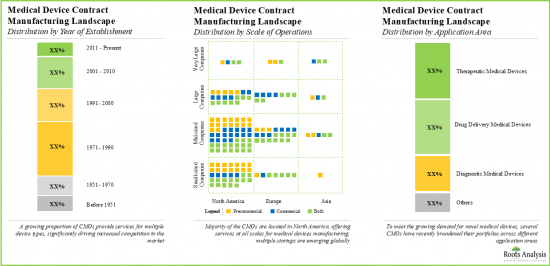
- 市場情勢は細分化されており、既存参入企業と新規参入企業の両方が存在します。現在、医療機器製造施設の多くは先進地域に立地しています。
- 医療機器CMOは、様々な世界的・地域的規制機関別確立された基準に準拠するため、積極的に業務調整に取り組んでいます。
- インプラントは、買収活動が比較的活発な最も顕著なセグメントの一つとして浮上しています。このような買収の背後にある主な価値の推進力には、能力の追加と地理的統合が含まれます。
- 過去6年間で、さまざまな医療機器を評価する9,600件以上の臨床試験が、さまざまなタイプのスポンサーにより登録され、幅広い治療分野をカバーしています。
- この領域に携わる企業は、それぞれのサービスポートフォリオを強化し、進化する業界ベンチマークに準拠するため、着実に能力を拡大しています。
- 急速に拡大する需要に牽引され、医療機器受託サービス市場は、様々な治療領域と地域の完成品について年率8.2%以上の成長が見込まれています。
- 現在、既存のCMOが大きなシェアを占めているが、長期的には、さまざまなタイプの企業、機器クラス、応用分野に機会が分散されると予想されます。
医療機器受託製造市場:主要セグメント
市場は応用分野別に、治療用医療機器、診断用医療機器、ドラッグデリバリー医療機器、その他の機器に区分されます。現在、世界の医療機器受託製造市場では、インスリンポンプや輸液ポンプなどの治療用機器の需要が増加していることから、治療用医療機器分野が最大シェアを占めています。さらに、ドラッグデリバリー機器セグメントの医療機器受託製造市場は、予測期間中に最も高い市場成長性を示すと予想されています。
機器クラス別では、市場はクラスI、クラスII、クラスIIIに区分されます。現在、世界の医療機器受託製造市場で最大のシェアを占めているのはクラスIIです。さらに、カスタマイズの容易さや多様な製品群など、クラスIIデバイスが提供する様々な利点により、クラスIIセグメントの市場は予測期間中により高いCAGRで成長すると予想されています。
市場は、対象とする治療領域に基づいて、心血管疾患、中枢神経系疾患、代謝疾患、腫瘍疾患、整形外科疾患、眼科疾患、疼痛疾患、呼吸器疾患、その他に区分されます。現在、整形外科疾患分野が世界の医療機器受託製造市場で最も高い割合を占めています。しかし、肥満、インスリン抵抗性、1型糖尿病、高血圧などの代謝性疾患の有病率の増加により、代謝性疾患分野は予測期間中により高いCAGRで成長すると予想されています。
主要地域別に見ると、市場は北米、欧州、アジア太平洋、その他の地域に区分されます。現在、北米が世界の医療機器受託製造市場を独占しており、最大の収益シェアを占めています。さらに、アジア太平洋地域の市場は、今後より高いCAGRで成長する可能性が高いです。
医療機器受託製造市場における参入企業例
- Cirtec Medical
- Creganna Medical
- DynaFlex Technologies
- Europlaz Technologies
- I-Tek Medical Technologies
- Interplex
- Keystone Solutions Group
- Modern Medical
- Oscor
- Riverside Medical Packaging
- SMC
- Synecco
- Suzhou Jenitek
- Stellartech Research
- Trelleborg Sealing Solutions
目次
第1章 序文
第2章 エグゼクティブサマリー
第3章 イントロダクション
- 章の概要
- 医療機器:概要
- 医療機器製造
- 医療機器CMOの歴史的タイムライン
- 医療機器CMOが提供するサービス
- 医療機器CMOが提供するメリット
- CMOへのアウトソーシングに伴うリスク
- 重要な考慮事項
- 結論
第4章 医療機器の規制状況
- 章の概要
- 医療機器に関する一般規制ガイドライン
- 北米の規制状況
- 欧州の規制状況
- アジア太平洋の規制状況
- 地域規制環境の比較
第5章 市場概要:治療機器
- 章の概要
- 治療機器向けサービスを提供する医療機器CMO
第6章 市場概要:診断機器
- 章の概要
- 診断機器向けサービスを提供する医療機器CMO
第7章 市場概要:デリバリーシステムとその他
- 章の概要
- カテーテル
- ドラッグデリバリーデバイス
- その他のデバイス
第8章 ベンチマーク分析
- 章の概要
- ベンチマーク分析:調査手法
- 地域別ベンチマーク分析
- 結論
第9章 サプライチェーン分析
- 章の概要
- 医療機器サプライチェーンの概要
- 医療機器サプライチェーンに影響を与える要因
- 主要業績評価指標
- サプライチェーン改善戦略
- サプライチェーン最適化の効果
- コスト分析
第10章 企業プロファイル
- 章の概要
- 北米に本社を置くCMO
- Cirtec Medical
- DynaFlex Technologies
- I-Tek Medical Technologies
- Keystone Solutions Group
- Oscor
- SMC
- Stellartech Research
- 欧州に本社を置くCMO
- Creganna Medical
- Europlaz Technologies
- Riverside Medical Packaging
- Synecco
- Trelleborg Sealing Solutions
- アジアに本社を置くCMO
- Interplex
- Modern Medical
- Providence Enterprise
- Suzhou JenitekJenitek
第11章 臨床試験の分析
- 章の概要
- 範囲と調査手法
- 臨床試験分析:試験タイトルのワードクラウド
- 臨床試験の分析
- 登録被験者の分析
- 重点治療領域の分析
第12章 合併と買収
第13章 ケーススタディ:医療機器のオフショア製造委託
- 章の概要
- 新興市場:定義と主要地域
- 工業製造における新興市場の役割
- 新興市場における医療機器製造
- 新興市場で医療機器の製造に注力する多国籍企業
- 新興市場における医療機器製造のビジネスモデル
- 医療機器業界におけるイノベーションに関する主な課題
- 新興市場にイノベーションハブを設立するメリット
- 将来の展望
第14章 市場予測
- 章の概要
- 予測調査手法と主要な前提条件
- 2035年までの医療機器受託製造市場全体
- 医療機器の契約製造市場:地域分布(2035年まで)
第15章 SWOT分析
第16章 結論
第17章 調査/インタビュー記録
第18章 付録1:表形式データ
第19章 付録2:企業・団体一覧
List of Tables
- Table 4.1 Device Classification: US
- Table 4.2 Device Classification: Canada
- Table 4.3 HTA Processes in Canada: Provincial Requirements
- Table 4.4 Regulatory Bodies in EU5 Countries
- Table 4.5 Device Classification: Europe
- Table 4.6 List of CE Directives in Europe
- Table 4.7 Conformity Assessment Modules in Europe
- Table 4.8 Device Classification: Japan
- Table 4.9 Device Classification: China
- Table 4.10 Device Classification: Australia
- Table 4.11 Medical Devices: Regulatory Landscape Summary
- Table 5.1 List of Medical Device CMOs Offering Services for Therapeutic Devices
- Table 5.2 Medical Device CMOs Offering Services for Therapeutic Devices: Information on Regulatory Certifications / Accreditations
- Table 5.3 Medical Device CMOs Offering Services for Therapeutic Devices: Information on Manufacturing Services
- Table 5.4 Medical Device CMOs Offering Services for Therapeutic Devices: Information on Post-Production Services
- Table 5.5 Medical Device CMOs Offering Services for Therapeutic Devices: Information on Other Services
- Table 5.6 Medical Device CMOs Offering Services for Therapeutic Devices: Information on Device Class
- Table 5.7 Medical Device CMOs Offering Services for Therapeutic Devices: Information on Type of Material(s) Handled
- Table 5.8 Medical Device CMOs Offering Services for Therapeutic Devices: Information on Scale of Operation
- Table 6.1 List of Medical Device CMOs Offering Services for Diagnostic Devices
- Table 6.2 Medical Device CMOs Offering Services for Diagnostic Devices: Information on Regulatory Certifications / Accreditations
- Table 6.3 Medical Device CMOs Offering Services for Diagnostic Devices: Information on Manufacturing Services
- Table 6.4 Medical Device CMOs Offering Services for Diagnostic Devices: Information on Post-Production Services
- Table 6.5 Medical Device CMOs Offering Services for Diagnostic Devices: Information on Other Services
- Table 6.6 Medical Device CMOs Offering Services for Diagnostic Devices: Information on Device Class
- Table 6.7 Medical Device CMOs Offering Services for Diagnostic Devices: Information on Type of Material(s) Handled
- Table 6.8 Medical Device CMOs Offering Services for Diagnostic Devices: Information on Scale of Operations
- Table 7.1 List of Medical Device CMOs Offering Services for Drug Delivery Devices
- Table 7.2 Medical Device CMOs Offering Services for Drug Delivery Devices: Information on Regulatory Certifications / Accreditations
- Table 7.3 Medical Device CMOs Offering Services for Drug Delivery Devices: Information on Manufacturing Services
- Table 7.4 Medical Device CMOs Offering Services for Drug Delivery Devices: Information on Post-Production Services
- Table 7.5 Medical Device CMOs Offering Services for Drug Delivery Devices: Information on Other Services
- Table 7.6 Medical Device CMOs Offering Services for Drug Delivery Devices: Information on Device Class
- Table 7.7 Medical Device CMOs Offering Services for Drug Delivery Devices: Information on Type of Material(s) Handled
- Table 7.8 Medical Device CMOs Offering Services for Drug Delivery Devices: Information on Scale of Operations
- Table 7.9 List of Medical Device CMOs Offering Services for Other Devices
- Table 7.10 Medical Device CMOs Offering Services for Other Devices: Information on Regulatory Certifications / Accreditations
- Table 7.11 Medical Device CMOs Offering Services for Other Devices: Information on Manufacturing Services
- Table 7.12 Medical Device CMOs Offering Services for Other Devices: Information on Post-Production Services
- Table 7.13 Medical Device CMOs Offering Services for Other Devices: Information on Other Services
- Table 7.14 Medical Device CMOs Offering Services for Other Devices: Information on Device Class
- Table 7.15 Medical Device CMOs Offering Services for Other Devices: Information on Type of Material(s) Handled
- Table 7.16 Medical Device CMOs Offering Services for Other Devices: Information on Scale of Operations
- Table 8.1 Benchmark Analysis: Peer Groups
- Table 10.1 Cirtec Medical: Company Overview
- Table 10.2 DynaFlex Technologies: Company Overview
- Table 10.3 I-Tek Medical Technologies: Company Overview
- Table 10.4 Keystone Solutions Group: Company Overview
- Table 10.5 Oscor: Company Overview
- Table 10.6 SMC: Company Overview
- Table 10.7 Stellartech: Company Overview
- Table 10.8 Creganna Medical: Company Overview
- Table 10.9 Europlaz Technologies: Company Overview
- Table 10.10 Riverside Medical Packaging: Company Overview
- Table 10.11 Synecco: Post-production Company Overview
- Table 10.12 Trelleborg Sealing Solutions: Company Overview
- Table 10.13 Interplex: Company Overview
- Table 10.14 Modern Medical: Company Overview
- Table 10.15 Providence Enterprise: Company Overview
- Table 10.16 Suzhou Jenitek: Company Overview
- Table 12.1 Medical Device Contract Manufacturing: List of Mergers and Acquisitions, Since 2014
- Table 12.2 Mergers and Acquisitions: Key Value Drivers and Type of Devices, Since 2014
- Table 12.3 Mergers and Acquisitions: Deal Multiples, Since 2013
- Table 13.1 Comparative Analysis between Developed and Developing Nations
- Table 13.2 Medtech A: Company Overview
- Table 13.3 Medtech A: Operational Values
- Table 13.4 Medtech B: Company Overview
- Table 13.5 Medtech A: Operational Values
- Table 18.1 Medical Device CMOs Offering Services for Therapeutic Devices: Distribution by Year of Establishment
- Table 18.2 Medical Device CMOs Offering Services for Therapeutic Devices: Distribution by Size of Employee Base
- Table 18.3 Medical Device CMOs Offering Services for Therapeutic Devices: Distribution by Location of Headquarters
- Table 18.4 Medical Device CMOs Offering Services for Therapeutic Devices: Distribution by Location of Manufacturing Facility
- Table 18.5 Medical Device CMOs Offering Services for Therapeutic Devices: Distribution by Regulatory Certifications / Accreditations
- Table 18.6 Medical Device CMOs Offering Services for Therapeutic Devices: Distribution by Manufacturing Services Offered
- Table 18.7 Medical Device CMOs Offering Services for Therapeutic Devices: Distribution by Post-Production Services Offered
- Table 18.8 Medical Device CMOs Offering Services for Therapeutic Devices: Distribution by Other Services Offered
- Table 18.9 Medical Device CMOs Offering Services for Therapeutic Devices: Distribution by Device Class
- Table 18.10 Medical Device CMOs Offering Services for Therapeutic Devices: Distribution by Type of Material(s) Handled
- Table 18.11 Medical Device CMOs Offering Services for Therapeutic Devices: Distribution by Scale of Operation
- Table 18.12 Medical Device CMOs Offering Services for Diagnostic Devices: Distribution by Year of Establishment
- Table 18.13 Medical Device CMOs Offering Services for Diagnostic Devices: Distribution by Size of Employee Base
- Table 18.14 Medical Device CMOs Offering Services for Diagnostic Devices: Distribution by Location of Headquarters
- Table 18.15 Medical Device CMOs Offering Services for Diagnostic Devices: Distribution by Location of Manufacturing Facility
- Table 18.16 Medical Device CMOs Offering Services for Diagnostic Devices: Distribution by Regulatory Certifications / Accreditations
- Table 18.17 Medical Device CMOs Offering Services for Diagnostic Devices: Distribution by Manufacturing Services Offered
- Table 18.18 Medical Device CMOs Offering Services for Diagnostic Devices: Distribution by Post-Production Services Offered
- Table 18.19 Medical Device CMOs Offering Services for Diagnostic Devices: Distribution by Other Services Offered
- Table 18.20 Medical Device CMOs Offering Services for Diagnostic Devices: Distribution by Device Class
- Table 18.21 Medical Device CMOs Offering Services for Diagnostic Devices: Distribution by Type of Material(s) Handled
- Table 18.22 Medical Device CMOs Offering Services for Diagnostic Devices: Distribution by Scale of Operation
- Table 18.23 Medical Device CMOs Offering Services for Drug Delivery Devices: Distribution by Year of Establishment
- Table 18.24 Medical Device CMOs Offering Services for Drug Delivery Devices: Distribution by Size of Employee Base
- Table 18.25 Medical Device CMOs Offering Services for Drug Delivery Devices: Distribution by Location of Headquarters
- Table 18.26 Medical Device CMOs Offering Services for Drug Delivery Devices: Distribution by Location of Manufacturing Facility
- Table 18.27 Medical Device CMOs Offering Services for Drug Delivery Devices: Distribution by Regulatory Certifications / Accreditations
- Table 18.28 Medical Device CMOs Offering Services for Drug Delivery Devices: Distribution by Manufacturing Services Offered
- Table 18.29 Medical Device CMOs Offering Services for Drug Delivery Devices: Distribution by Post-Production Services Offered
- Table 18.30 Medical Device CMOs Offering Services for Drug Delivery Devices: Distribution by Other Services Offered
- Table 18.31 Medical Device CMOs Offering Services for Drug Delivery Devices: Distribution by Device Class
- Table 18.32 Medical Device CMOs Offering Services for Drug Delivery Devices: Distribution by Type of Material(s) Handled
- Table 18.33 Medical Device CMOs Offering Services for Drug Delivery Devices: Distribution by Scale of Operation
- Table 18.34 Medical Device CMOs Offering Services for Other Devices: Distribution by Year of Establishment
- Table 18.35 Medical Device CMOs Offering Services for Other Devices: Distribution by Size of Employee Base
- Table 18.36 Medical Device CMOs Offering Services for Other Devices: Distribution by Location of Headquarters
- Table 18.37 Medical Device CMOs Offering Services for Other Devices: Distribution by Location of Manufacturing Facility
- Table 18.38 Medical Device CMOs Offering Services for Other Devices: Distribution by Regulatory Certifications / Accreditations
- Table 18.39 Medical Device CMOs Offering Services for Other Devices: Distribution by Manufacturing Services Offered
- Table 18.40 Medical Device CMOs Offering Services for Other Devices: Distribution by Post-Production Services Offered
- Table 18.41 Medical Device CMOs Offering Services for Other Devices: Distribution by Other Services Offered
- Table 18.42 Medical Device CMOs Offering Services for Other Devices: Distribution by Device Class
- Table 18.43 Medical Device CMOs Offering Services for Other Devices: Distribution by Type of Material(s) Handled
- Table 18.44 Medical Device CMOs Offering Services for Other Devices: Distribution by Scale of Operation
- Table 18.45 Benchmark Analysis: Distribution by Region and Size of Employee Base
- Table 18.46 Clinical Trial Analysis: Distribution by Trial Start Year, Since 2018
- Table 18.47 Clinical Trial Analysis: Distribution by Trial Status
- Table 18.48 Clinical Trial Analysis: Distribution by Phase of Development
- Table 18.49 Clinical Trial Analysis: Top 10 Target Indication
- Table 18.50 Clinical Trial Analysis: Distribution by Sponsor Type
- Table 18.51 Clinical Trial Analysis: Distribution by Trial Start Year and Geography, Since 2018
- Table 18.52 Enrolled Patient Population: Distribution by Trial Status
- Table 18.53 Enrolled Patient Population: Distribution by Phase of Development
- Table 18.54 Clinical Trial Analysis: Distribution by Focus Therapeutic Areas
- Table 18.55 Heat Map Analysis: Emerging Therapeutic Areas
- Table 18.56 Clinical Trial Analysis: Distribution by Type of Sponsor and Top 10 Therapeutic Areas
- Table 18.57 Clinical Trial Analysis: Prominent Therapeutic Areas in North America
- Table 18.58 Clinical Trial Analysis: Prominent Therapeutic Areas in Europe
- Table 18.59 Clinical Trial Analysis: Prominent Therapeutic Areas in Asia Pacific
- Table 18.60 Clinical Trial Analysis: Prominent Therapeutic Areas in Rest of the World
- Table 18.61 Clinical Trials for Cardiovascular Disorders: Distribution by Trial Start Year, Since 2018
- Table 18.62 Clinical Trials for Cardiovascular Disorders: Distribution by Sponsor Type
- Table 18.63 Clinical Trials for Cardiovascular Disorders: Distribution by Geography
- Table 18.64 Clinical Trials for Oncological Disorders: Distribution of Trials by Start Year, Since 2018
- Table 18.65 Clinical Trials for Oncological Disorders: Distribution by Sponsor Type
- Table 18.66 Clinical Trials for Oncological Disorders: Distribution by Geography
- Table 18.67 Clinical Trials for CNS Disorders: Distribution of Trials by Start Year, Since 2018
- Table 18.68 Clinical Trials for CNS Disorders: Distribution by Sponsor Type
- Table 18.69 Clinical Trials for CNS Disorders: Distribution by Geography
- Table 18.70 Clinical Trials for Orthopedic Disorders: Distribution of Trials by Start Year, Since 2018
- Table 18.71 Clinical Trials for Orthopedic Disorders: Distribution by Sponsor Type
- Table 18.72 Clinical Trials for Orthopedic Disorders: Distribution by Geography
- Table 18.73 Clinical Trials for Respiratory Disorders: Distribution of Trials by Start Year, Since 2018
- Table 18.74 Clinical Trials for Respiratory Disorders: Distribution by Sponsor Type
- Table 18.75 Clinical Trials for Respiratory Disorders: Distribution by Geography
- Table 18.76 Mergers and Acquisitions: Year-Wise Cumulative Trend, Since 2018
- Table 18.77 Mergers and Acquisitions: Distribution by Type of Acquisitions
- Table 18.78 Acquisitions: Most Active Acquirers
- Table 18.79 Mergers and Acquisitions: Key Value Drivers
- Table 18.80 Mergers and Acquisitions: Distribution by Key Value Drivers and Year of Acquisition
- Table 18.81 Mergers and Acquisitions: Distribution by Type of Devices
- Table 18.82 Mergers and Acquisitions: Distribution by Therapeutic Area
- Table 18.83 Mergers and Acquisitions: Distribution by Services Offered
- Table 18.84 Acquisitions: Country-wise Distribution
- Table 18.85 Overall Medical Device CMOs Market, Base Scenario, till 2035 (USD Billion)
- Table 18.86 Medical Device CMOs Market for Therapeutic Devices, Base Scenario, till 2035 (USD Billion)
- Table 18.87 Medical Device CMOs Market for Diagnostic Devices, Base Scenario, till 2035 (USD Billion)
- Table 18.88 Medical Device CMOs Market for Drug Delivery Devices, Base Scenario, till 2035 (USD Billion)
- Table 18.89 Medical Device CMOs Market for Other Devices, Base Scenario, till 2035 (USD Billion)
- Table 18.90 Medical Device CMOs Market for Class I Devices, Base Scenario, till 2035 (USD Billion)
- Table 18.91 Medical Device CMOs Market for Class II Devices, Base Scenario, till 2035 (USD Billion)
- Table 18.92 Medical Device CMOs Market for Class III Devices, Base Scenario, till 2035 (USD Billion)
- Table 18.93 Medical Device CMOs Market: Leading Players, till 2035 (USD Billion)
- Table 18.94 Medical Device CMOs Market for Cardiovascular Disorders, Base Scenario, till 2035 (USD Billion)
- Table 18.95 Medical Device CMOs Market for CNS Disorders, Base Scenario, till 2035 (USD Billion)
- Table 18.96 Medical Device CMOs Market for Metabolic Disorders, Base Scenario, till 2035 (USD Billion)
- Table 18.97 Medical Device CMOs Market for Oncological Disorders, Base Scenario, till 2035 (USD Billion)
- Table 18.98 Medical Device CMOs Market for Orthopedic Disorders, Base Scenario, till 2035 (USD Billion)
- Table 18.99 Medical Device CMOs Market for Ophthalmic Disorders, Base Scenario, till 2035 (USD Billion)
- Table 18.100 Medical Device CMOs Market for Pain Disorders, Base Scenario, till 2035 (USD Billion)
- Table 18.101 Medical Device CMOs Market for Respiratory Disorders, Base Scenario, till 2035 (USD Billion)
- Table 18.102 Medical Device CMOs Market for Other Therapeutic Areas, Base Scenario, till 2035 (USD Billion)
- Table 18.103 Medical Device CMOs Market in North America, Base Scenario, till 2035 (USD Billion)
- Table 18.104 Medical Device CMOs Market in the US, till 2035 (USD Billion)
- Table 18.105 Medical Device CMOs Market in Rest of North America, till 2035 (USD Billion)
- Table 18.106 Medical Device CMOs Market for Class I Devices in North America, Base Scenario, till 2035 (USD Billion)
- Table 18.107 Medical Device CMOs Market for Class II Devices in North America, Base Scenario, till 2035 (USD Billion)
- Table 18.108 Medical Device CMOs Market for Class III Devices in North America, Base Scenario, till 2035 (USD Billion)
- Table 18.109 Medical Device CMOs Market for Cardiovascular Disorders in North America, Base Scenario, till 2035 (USD Billion)
- Table 18.110 Medical Device CMOs Market for CNS Disorders in North America, Base Scenario, till 2035 (USD Billion)
- Table 18.111 Medical Device CMOs Market for Metabolic Disorders in North America, Base Scenario, till 2035 (USD Billion)
- Table 18.112 Medical Device CMOs Market for Oncological Disorders in North America, Base Scenario, till 2035 (USD Billion)
- Table 18.113 Medical Device CMOs Market for Orthopedic Disorders in North America, Base Scenario, till 2035 (USD Billion)
- Table 18.114 Medical Device CMOs Market for Ophthalmic Disorders in North America, Base Scenario, till 2035 (USD Billion)
- Table 18.115 Medical Device CMOs Market for Pain Disorders in North America, Base Scenario, till 2035 (USD Billion)
- Table 18.116 Medical Device CMOs Market for Respiratory Disorders in North America, Base Scenario, till 2035 (USD Billion)
- Table 18.117 Medical Device CMOs Market for Other Therapeutic Areas in North America, Base Scenario, till 2035 (USD Billion)
- Table 18.118 Medical Device CMOs Market in Europe, Base Scenario, till 2035 (USD Billion)
- Table 18.119 Medical Device CMOs Market in Italy, Base Scenario, till 2035 (USD Billion)
- Table 18.120 Medical Device CMOs Market in Germany, Base Scenario, till 2035 (USD Billion)
- Table 18.121 Medical Device CMOs Market in France, Base Scenario, till 2035 (USD Billion)
- Table 18.122 Medical Device CMOs Market in Spain, Base Scenario, till 2035 (USD Billion)
- Table 18.123 Medical Device CMOs Market in the UK, Base Scenario, till 2035 (USD Billion)
- Table 18.124 Medical Device CMOs Market in Rest of Europe, Base Scenario, till 2035 (USD Billion)
- Table 18.125 Medical Device CMOs Market for Class I Devices in Europe, Base Scenario, till 2035 (USD Billion)
- Table 18.126 Medical Device CMOs Market for Class II Devices in Europe, Base Scenario, till 2035 (USD Billion)
- Table 18.127 Medical Device CMOs Market for Class III Devices in Europe, Base Scenario, till 2035 (USD Billion)
- Table 18.128 Medical Device CMOs Market for Cardiovascular Disorders in Europe, Base Scenario, till 2035 (USD Billion)
- Table 18.129 Medical Device CMOs Market for CNS Disorders in Europe, Base Scenario, till 2035 (USD Billion)
- Table 18.130 Medical Device CMOs Market for Metabolic Disorders in Europe, Base Scenario, till 2035 (USD Billion)
- Table 18.131 Medical Device CMOs Market of Oncological Disorders in Europe, Base Scenario, till 2035 (USD Billion)
- Table 18.132 Medical Device CMOs Market for Orthopedic Disorders in Europe, Base Scenario, till 2035 (USD Billion)
- Table 18.133 Medical Device CMOs Market for Ophthalmic Disorders in Europe, Base Scenario, till 2035 (USD Billion)
- Table 18.134 Medical Device CMOs Market for Pain Disorders in Europe, Base Scenario, till 2035 (USD Billion)
- Table 18.135 Medical Device CMOs Market for Respiratory Disorders in Europe, Base Scenario, till 2035 (USD Billion)
- Table 18.136 Medical Device CMOs Market for Other Therapeutic Areas in Europe, Base Scenario, till 2035 (USD Billion)
- Table 18.137 Medical Device CMOs Market in Asia and Rest of the World, Base Scenario, till 2035 (USD Billion)
- Table 18.138 Medical Device CMOs Market in China, Base Scenario, till 2035 (USD Billion)
- Table 18.139 Medical Device CMOs Market in Japan, Base Scenario, till 2035 (USD Billion)
- Table 18.140 Medical Device CMOs Market in India, Base Scenario, till 2035 (USD Billion)
- Table 18.141 Medical Device CMOs Market in Rest of Asia and Rest of the World, Base Scenario, till 2035 (USD Billion)
- Table 18.142 Medical Device CMOs Market for Class I Devices in Asia and Rest of the World, Base Scenario, till 2035 (USD Billion)
- Table 18.143 Medical Device CMOs Market for Class II Devices in Asia and Rest of the World, Base Scenario, till 2035 (USD Billion)
- Table 18.144 Medical Device CMOs Market for Class III Devices in Asia and Rest of the World, Base Scenario, till 2035 (USD Billion)
- Table 18.145 Medical Device CMOs Market for Cardiovascular Disorders in Asia and Rest of the World, Base Scenario, till 2035 (USD Billion)
- Table 18.146 Medical Device CMOs Market for CNS Disorders in Asia and Rest of the World, Base Scenario, till 2035 (USD Billion)
- Table 18.147 Medical Device CMOs Market for Metabolic Disorders in Asia and Rest of the World, Base Scenario, till 2035 (USD Billion)
- Table 18.148 Medical Device CMOs Market for Oncological Disorders in Asia and Rest of the World, Base Scenario, till 2035 (USD Billion)
- Table 18.149 Medical Device CMOs Market for Orthopedic Disorders in Asia and Rest of the World, Base Scenario, till 2035 (USD Billion)
- Table 18.150 Medical Device CMOs Market for Ophthalmic Disorders in Asia and Rest of the World, Base Scenario, till 2035 (USD Billion)
- Table 18.151 Medical Device CMOs Market for Pain Disorders in Asia and Rest of the World, Base Scenario, till 2035 (USD Billion)
- Table 18.152 Medical Device CMOs Market for Respiratory Disorders in Asia and Rest of the World, Base Scenario, till 2035 (USD Billion)
- Table 18.153 Medical Device CMOs Market for Other Therapeutic Areas in Asia and Rest of the World, Base Scenario, till 2035 (USD Billion)
List of Figures
- Figure 3.1 Historical Evolution of Medical Devices
- Figure 3.2 Medical Device Manufacturing Process
- Figure 3.3 Challenges Associated with Medical Device Manufacturing
- Figure 3.4 Advantages of Automation
- Figure 3.5 Services Offered by CMOs
- Figure 3.6 Advantages of Outsourcing to CMOs
- Figure 3.7 Risks Associated with Outsourcing to CMOs
- Figure 3.8 Key Considerations for Selecting a CMO Partner
- Figure 4.1 US FDA: Review / Approval Process
- Figure 4.2 Health Canada: Review / Approval Process
- Figure 4.3 Summary of CE Marking Process
- Figure 4.4 Pharmaceuticals and Medical Devices Agency: Review / Approval Process
- Figure 4.5 China Food and Drug Administration: Review / Approval Process
- Figure 4.6 Therapeutic Goods Administration: Review / Approval Process
- Figure 4.7 Bubble Analysis: Regional Regulatory Environment
- Figure 5.1 Medical Device CMOs Offering Services for Therapeutic Devices: Distribution by Year of Establishment
- Figure 5.2 Medical Device CMOs Offering Services for Therapeutic Devices: Distribution by Size of Employee Base
- Figure 5.3 Medical Device CMOs Offering Services for Therapeutic Devices: Distribution by Location of Headquarters
- Figure 5.4 Medical Device CMOs Offering Services for Therapeutic Devices: Distribution by Location of Manufacturing Facility
- Figure 5.5 Medical Device CMOs Offering Services for Therapeutic Devices: Distribution by Regulatory Certifications / Accreditations
- Figure 5.6 Medical Device CMOs Offering Services for Therapeutic Devices: Distribution by Manufacturing Services Offered
- Figure 5.7 Medical Device CMOs Offering Services for Therapeutic Devices: Distribution by Post-Production Services Offered
- Figure 5.8 Medical Device CMOs Offering Services for Therapeutic Devices: Distribution by Other Services Offered
- Figure 5.9 Medical Device CMOs Offering Services for Therapeutic Devices: Distribution by Device Class
- Figure 5.10 Medical Device CMOs Offering Services for Therapeutic Devices: Distribution by Type of Material(s) Handled
- Figure 5.11 Medical Device CMOs Offering Services for Therapeutic Devices: Distribution by Scale of Operation
- Figure 6.1 Medical Device CMOs Offering Services for Diagnostic Devices: Distribution by Year of Establishment
- Figure 6.2 Medical Device CMOs Offering Services for Diagnostic Devices: Distribution by Size of Employee Base
- Figure 6.3 Medical Device CMOs Offering Services for Diagnostic Devices: Distribution by Location of Headquarters
- Figure 6.4 Medical Device CMOs Offering Services for Diagnostic Devices: Distribution by Location of Manufacturing Facility
- Figure 6.5 Medical Device CMOs Offering Services for Diagnostic Devices: Distribution by Regulatory Certifications / Accreditations
- Figure 6.6 Medical Device CMOs Offering Services for Diagnostic Devices: Distribution by Manufacturing Services Offered
- Figure 6.7 Medical Device CMOs Offering Services for Diagnostic Devices: Distribution by Post-Production Services Offered
- Figure 6.8 Medical Device CMOs Offering Services for Diagnostic Devices: Distribution by Other Services Offered
- Figure 6.9 Medical Device CMOs Offering Services for Diagnostic Devices: Distribution by Device Class
- Figure 6.10 Medical Device CMOs Offering Services for Diagnostic Devices: Distribution by Type of Material(s) Handled
- Figure 6.11 Medical Device CMOs Offering Services for Diagnostic Devices: Distribution by Scale of Operation
- Figure 7.1 Medical Device CMOs Offering Services for Drug Delivery Devices: Distribution by Year of Establishment
- Figure 7.2 Medical Device CMOs Offering Services for Drug Delivery Devices: Distribution by Size of Employee Base
- Figure 7.3 Medical Device CMOs Offering Services for Drug Delivery Devices: Distribution by Location of Headquarters
- Figure 7.4 Medical Device CMOs Offering Services for Drug Delivery Devices: Distribution by Location of Manufacturing Facility
- Figure 7.5 Medical Device CMOs Offering Services for Drug Delivery Devices: Distribution by Regulatory Certifications / Accreditations
- Figure 7.6 Medical Device CMOs Offering Services for Drug Delivery Devices: Distribution by Manufacturing Services Offered
- Figure 7.7 Medical Device CMOs Offering Services for Drug Delivery Devices: Distribution by Post-Production Services Offered
- Figure 7.8 Medical Device CMOs Offering Services for Drug Delivery Devices: Distribution by Other Services Offered
- Figure 7.9 Medical Device CMOs Offering Services for Drug Delivery Devices: Distribution by Device Class
- Figure 7.10 Medical Device CMOs Offering Services for Drug Delivery Devices: Distribution by Type of Material(s) Handled
- Figure 7.11 Medical Device CMOs Offering Services for Drug Delivery Devices: Distribution by Scale of Operation
- Figure 7.12 Medical Device CMOs Offering Services for Other Devices: Distribution by Year of Establishment
- Figure 7.13 Medical Device CMOs Offering Services for Other Devices: Distribution by Size of Employee Base
- Figure 7.14 Medical Device CMOs Offering Services for Other Devices: Distribution by Location of Headquarters
- Figure 7.15 Medical Device CMOs Offering Services for Other Devices: Distribution by Location of Manufacturing Facility
- Figure 7.16 Medical Device CMOs Offering Services for Other Devices: Distribution by Regulatory Certifications / Accreditations
- Figure 7.17 Medical Device CMOs Offering Services for Other Devices: Distribution by Manufacturing Services Offered
- Figure 7.18 Medical Device CMOs Offering Services for Other Devices: Distribution by Post-Production Services Offered
- Figure 7.19 Medical Device CMOs Offering Services for Other Devices: Distribution by Other Services Offered
- Figure 7.20 Medical Device CMOs Offering Services for Other Devices: Distribution by Device Class
- Figure 7.21 Medical Device CMOs Offering Services for Other Devices: Distribution by Type of Material(s) Handled
- Figure 7.22 Medical Device CMOs Offering Services for Other Devices: Distribution by Scale of Operation
- Figure 8.1 Benchmark Analysis: Distribution by Region and Size of Employee Base
- Figure 8.2 Benchmark Analysis: North America, Peer Group I
- Figure 8.3 Benchmark Analysis: North America, Peer Group II
- Figure 8.4 Benchmark Analysis: North America, Peer Group III
- Figure 8.5 Benchmark Analysis: North America, Peer Group IV
- Figure 8.6 Benchmark Analysis: North America, Peer Group V
- Figure 8.7 Benchmark Analysis: North America, Peer Group VI
- Figure 8.8 Benchmark Analysis: North America, Peer Group VII
- Figure 8.9 Benchmark Analysis: Europe, Peer Group VIII
- Figure 8.10 Benchmark Analysis: Europe, Peer Group IX
- Figure 8.11 Benchmark Analysis: Europe, Peer Group X
- Figure 8.12 Benchmark Analysis: Asia, Peer Group XI
- Figure 11.10 Enrolled Patient Population: Distribution by Phase of Development
- Figure 11.11 Enrolled Patient Population: Distribution by Geography
- Figure 11.12 Clinical Trial Analysis: Distribution by Focus Therapeutic Areas
- Figure 11.13 Heat Map Analysis: Emerging Therapeutic Areas
- Figure 11.14 Clinical Trial Analysis: Distribution by Type of Sponsor and Top 10 Therapeutic Areas
- Figure 11.15 Clinical Trial Analysis: Prominent Therapeutic Areas in North America
- Figure 11.16 Clinical Trial Analysis: Prominent Therapeutic Areas in Europe
- Figure 11.17 Clinical Trial Analysis: Prominent Therapeutic Areas in Asia Pacific
- Figure 11.18 Clinical Trial Analysis: Prominent Therapeutic Areas in Rest of the World
- Figure 11.19 Clinical Trials for Cardiovascular Disorders: Distribution by Trial Start Year, Since 2018
- Figure 11.20 Clinical Trials for Cardiovascular Disorders: Distribution by Sponsor Type
- Figure 11.21 Clinical Trials for Cardiovascular Disorders: Distribution by Geography
- Figure 11.22 Clinical Trials for Oncological Disorders: Distribution of Trials by Start Year, Since 2018
- Figure 11.23 Clinical Trials for Oncological Disorders: Distribution by Sponsor Type
- Figure 11.24 Clinical Trials for Oncological Disorders: Distribution by Geography
- Figure 11.25 Clinical Trials for CNS Disorders: Distribution of Trials by Start Year, Since 2018
- Figure 11.26 Clinical Trials for CNS Disorders: Distribution by Sponsor Type
- Figure 11.27 Clinical Trials for CNS Disorders: Distribution by Geography
- Figure 11.28 Clinical Trials for Orthopedic Disorders: Distribution of Trials by Start Year, Since 2018
- Figure 11.29 Clinical Trials for Orthopedic Disorders: Distribution by Sponsor Type
- Figure 11.30 Clinical Trials for Orthopedic Disorders: Distribution by Geography
- Figure 11.31 Clinical Trials for Respiratory Disorders: Distribution of Trials by Start Year, Since 2018
- Figure 11.32 Clinical Trials for Respiratory Disorders: Distribution by Sponsor Type
- Figure 11.33 Clinical Trials for Respiratory Disorders: Distribution by Geography
- Figure 12.1 Mergers and Acquisitions: Year-Wise Cumulative Trend, Since 2018
- Figure 12.2 Mergers and Acquisitions: Distribution by Type of Acquisitions
- Figure 12.3 Most Active Acquirers: Distribution by Number of Acquisitions
- Figure 12.4 Mergers and Acquisitions: Key Value Drivers
- Figure 12.5 Mergers and Acquisitions: Distribution by Key Value Drivers and Year of Acquisition
- Figure 12.6 Mergers and Acquisitions: Distribution by Type of Device
- Figure 12.7 Heat Map Analysis: Type of Devices and Key Value Drivers
- Figure 12.8 Mergers and Acquisitions: Distribution by Therapeutic Area
- Figure 12.9 Mergers and Acquisitions: Distribution by Services Offered
- Figure 12.10 Acquisitions: Continental Distribution
- Figure 12.11 Acquisitions: Country-wise Distribution
- Figure 12.12 Acquisitions: Intercontinental and Intracontinental Acquisitions
- Figure 12.13 Mergers and Acquisitions: Relationship between Deal Multiples
- Figure 13.1 Prominent Emerging Markets
- Figure 13.2 Recommendations to Optimize Manufacturing Strategies
- Figure 14.1 Overall Medical Device CMOs Market, Base Scenario, till 2035 (USD Billion)
- Figure 14.2 Medical Device CMOs Market for Therapeutic Devices, Base Scenario, till 2035 (USD Billion)
- Figure 14.3 Medical Device CMOs Market for Diagnostic Devices, Base Scenario, till 2035 (USD Billion)
- Figure 14.4 Medical Device CMOs Market for Drug Delivery Devices, Base Scenario, till 2035 (USD Billion)
- Figure 14.5 Medical Device CMOs Market for Other Devices, Base Scenario, till 2035 (USD Billion)
- Figure 14.6 Medical Device CMOs Market for Class I Devices, Base Scenario, till 2035 (USD Billion)
- Figure 14.7 Medical Device CMOs Market for Class II Devices, Base Scenario, till 2035 (USD Billion)
- Figure 14.8 Medical Device CMOs Market for Class III Devices, Base Scenario, till 2035 (USD Billion)
- Figure 14.9 Medical Device CMOs Market: Leading Players, till 2035 (USD Billion)
- Figure 14.10 Medical Device CMOs Market for Cardiovascular Disorders, Base Scenario, till 2035 (USD Billion)
- Figure 14.11 Medical Device CMOs Market for CNS Disorders, Base Scenario, till 2035 (USD Billion)
- Figure 14.12 Medical Device CMOs Market for Metabolic Disorders, Base Scenario, till 2035 (USD Billion)
- Figure 14.13 Medical Device CMOs Market for Oncological Disorders, Base Scenario, till 2035 (USD Billion)
- Figure 14.14 Medical Device CMOs Market for Orthopedic Disorders, Base Scenario, till 2035 (USD Billion)
- Figure 14.15 Medical Device CMOs Market for Ophthalmic Disorders, Base Scenario, till 2035 (USD Billion)
- Figure 14.16 Medical Device CMOs Market for Pain Disorders, Base Scenario, till 2035 (USD Billion)
- Figure 14.17 Medical Device CMOs Market for Respiratory Disorders, Base Scenario, till 2035 (USD Billion)
- Figure 14.18 Medical Device CMOs Market for Other Therapeutic Areas, Base Scenario, till 2035 (USD Billion)
- Figure 14.19 Medical Device CMOs Market in North America, Base Scenario, till 2035 (USD Billion)
- Figure 14.20 Medical Device CMOs Market in the US, till 2035 (USD Billion)
- Figure 14.21 Medical Device CMOs Market in Rest of North America, till 2035 (USD Billion)
- Figure 14.22 Medical Device CMOs Market for Class I Devices in North America, Base Scenario, till 2035 (USD Billion)
- Figure 14.23 Medical Device CMOs Market for Class II Devices in North America, Base Scenario, till 2035 (USD Billion)
- Figure 14.24 Medical Device CMOs Market for Class III Devices in North America, Base Scenario, till 2035 (USD Billion)
- Figure 14.25 Medical Device CMOs Market for Cardiovascular Disorders in North America, Base Scenario, till 2035 (USD Billion)
- Figure 14.26 Medical Device CMOs Market for CNS Disorders in North America, Base Scenario, till 2035 (USD Billion)
- Figure 14.27 Medical Device CMOs Market for Metabolic Disorders in North America, Base Scenario, till 2035 (USD Billion)
- Figure 14.28 Medical Device CMOs Market for Oncological Disorders in North America, Base Scenario, till 2035 (USD Billion)
- Figure 14.29 Medical Device CMOs Market for Orthopedic Disorders in North America, Base Scenario, till 2035 (USD Billion)
- Figure 14.30 Medical Device CMOs Market for Ophthalmic Disorders in North America, Base Scenario, till 2035 (USD Billion)
- Figure 14.31 Medical Device CMOs Market for Pain Disorders in North America, Base Scenario, till 2035 (USD Billion)
- Figure 14.32 Medical Device CMOs Market for Respiratory Disorders in North America, Base Scenario, till 2035 (USD Billion)
- Figure 14.33 Medical Device CMOs Market for Other Therapeutic Areas in North America, Base Scenario, till 2035 (USD Billion)
- Figure 14.34 Medical Device CMOs Market in Europe, Base Scenario, till 2035 (USD Billion)
- Figure 14.35 Medical Device CMOs Market in Italy, Base Scenario, till 2035 (USD Billion)
- Figure 14.36 Medical Device CMOs Market in Germany, Base Scenario, till 2035 (USD Billion)
- Figure 14.37 Medical Device CMOs Market in France, Base Scenario, till 2035 (USD Billion)
- Figure 14.38 Medical Device CMOs Market in Spain, Base Scenario, till 2035 (USD Billion)
- Figure 14.39 Medical Device CMOs Market in the UK, Base Scenario, till 2035 (USD Billion)
- Figure 14.40 Medical Device CMOs Market in Rest of Europe, Base Scenario, till 2035 (USD Billion)
- Figure 14.41 Medical Device CMOs Market for Class I Devices in Europe, Base Scenario, till 2035 (USD Billion)
- Figure 14.42 Medical Device CMOs Market for Class II Devices in Europe, Base Scenario, till 2035 (USD Billion)
- Figure 14.43 Medical Device CMOs Market for Class III Devices in Europe, Base Scenario, till 2035 (USD Billion)
- Figure 14.44 Medical Device CMOs Market for Cardiovascular Disorders in Europe, Base Scenario, till 2035 (USD Billion)
- Figure 14.45 Medical Device CMOs Market for CNS Disorders in Europe, Base Scenario, till 2035 (USD Billion)
- Figure 14.46 Medical Device CMOs Market for Metabolic Disorders in Europe, Base Scenario, till 2035 (USD Billion)
- Figure 14.47 Medical Device CMOs Market of Oncological Disorders in Europe, Base Scenario, till 2035 (USD Billion)
- Figure 14.48 Medical Device CMOs Market for Orthopedic Disorders in Europe, Base Scenario, till 2035 (USD Billion)
- Figure 14.49 Medical Device CMOs Market for Ophthalmic Disorders in Europe, Base Scenario, till 2035 (USD Billion)
- Figure 14.50 Medical Device CMOs Market for Pain Disorders in Europe, Base Scenario, till 2035 (USD Billion)
- Figure 14.51 Medical Device CMOs Market for Respiratory Disorders in Europe, Base Scenario, till 2035 (USD Billion)
- Figure 14.52 Medical Device CMOs Market for Other Therapeutic Areas in Europe, Base Scenario, till 2035 (USD Billion)
- Figure 14.53 Medical Device CMOs Market in Asia and Rest of the World, Base Scenario, till 2035 (USD Billion)
- Figure 14.54 Medical Device CMOs Market in China, Base Scenario, till 2035 (USD Billion)
- Figure 14.55 Medical Device CMOs Market in Japan, Base Scenario, till 2035 (USD Billion)
- Figure 14.56 Medical Device CMOs Market in India, Base Scenario, till 2035 (USD Billion)
- Figure 14.57 Medical Device CMOs Market in Rest of Asia and Rest of the World, Base Scenario, till 2035 (USD Billion)
- Figure 14.58 Medical Device CMOs Market for Class I Devices in Asia and Rest of the World, Base Scenario, till 2035 (USD Billion)
- Figure 14.59 Medical Device CMOs Market for Class II Devices in Asia and Rest of the World, Base Scenario, till 2035 (USD Billion)
- Figure 14.60 Medical Device CMOs Market for Class III Devices in Asia and Rest of the World, Base Scenario, till 2035 (USD Billion)
- Figure 14.61 Medical Device CMOs Market for Cardiovascular Disorders in Asia and Rest of the World, Base Scenario, till 2035 (USD Billion)
- Figure 14.62 Medical Device CMOs Market for CNS Disorders in Asia and Rest of the World, Base Scenario, till 2035 (USD Billion)
- Figure 14.63 Medical Device CMOs Market for Metabolic Disorders in Asia and Rest of the World, Base Scenario, till 2035 (USD Billion)
- Figure 14.64 Medical Device CMOs Market for Oncological Disorders in Asia and Rest of the World, Base Scenario, till 2035 (USD Billion)
- Figure 14.65 Medical Device CMOs Market for Orthopedic Disorders in Asia and Rest of the World, Base Scenario, till 2035 (USD Billion)
- Figure 14.66 Medical Device CMOs Market for Ophthalmic Disorders in Asia and Rest of the World, Base Scenario, till 2035 (USD Billion)
- Figure 14.67 Medical Device CMOs Market for Pain Disorders in Asia and Rest of the World, Base Scenario, till 2035 (USD Billion)
- Figure 14.68 Medical Device CMOs Market for Respiratory Disorders in Asia and Rest of the World, Base Scenario, till 2035 (USD Billion)
- Figure 14.69 Medical Device CMOs Market for Other Therapeutic Areas in Asia and Rest of the World, Base Scenario, till 2035 (USD Billion)
- Figure 15.1 Medical Device Contract Manufacturing SWOT Analysis: Overview
- Figure 15.2 Comparison of SWOT Factors: Harvey Ball Analysis
MEDICAL DEVICE CONTRACT MANUFACTURING MARKET: OVERVIEW
As per Roots Analysis, the global medical device contract manufacturing market valued at USD 78.8 billion in the current year is anticipated to grow at a CAGR of 8.2% during the forecast period.
The market sizing and opportunity analysis has been segmented across the following parameters:
Application Areas
- Therapeutic Medical Devices
- Diagnostic Medical Devices
- Drug Delivery Medical Devices
- Other Devices
Device Class
- Class I
- Class II
- Class III
Target Therapeutic Area
- Cardiovascular Disorders
- CNS Disorders
- Metabolic Disorders
- Oncological Disorders
- Ophthalmic Disorders
- Orthopedic Disorders
- Pain Disorders
- Respiratory Disorders
- Others
Key Geographical Regions
- North America (US)
- Europe (Italy, Germany, France, Spain, UK, Rest of the Europe)
- Asia-Pacific (China, Japan, India)
- Rest of the World
MEDICAL DEVICE CONTRACT MANUFACTURING MARKET: GROWTH AND TRENDS
Over the past 50 years, the medical device industry has seen several notable developments, such as the introduction of minimally invasive surgical instruments and the rise of implantable devices like pacemakers. Additionally, the use of biomedical devices like prostheses has increased substantially over time owing to the fact that each year, millions of individuals undergo surgeries and implantations. Further, cardioverter defibrillators, prosthetic hips and knees, contact lenses, and cardiac pacemakers are some of the most commonly implanted medical devices, while fixation devices and artificial joints account for about 44% of all medical devices. This is indicative of the growing demand for medical devices in the healthcare domain. However, most developers lack adequate resources and the necessary expertise to manufacture medical devices and related components.
Given the rise of medical device CROs, the opportunity for CMOs with expertise in medical devices is also steadily rising. It is worth highlighting that, since 2000, more than 65 CMOs have been established. Further, the World Health Organization reports approximately 2 million unique medical devices worldwide, classified into more than 7,000 generic device categories. Notably, CMOs are known to offer significant cost-benefits, access to sophisticated / up-to-date infrastructure, large production capacities and reduction in time-to-market. As a result, the opportunity for medical device contract manufacturing service providers is steadily increasing.
MEDICAL DEVICE CONTRACT MANUFACTURING MARKET: KEY INSIGHTS
The report delves into the current state of the medical device contract manufacturing market and identifies potential growth opportunities within industry. Some key findings from the report include:
- Novel technologies and platforms have emerged as one of the primary factors responsible for the establishment and success of a number of small and mid-sized medical device companies.
- Owing to complexities associated with regulatory compliance and approvals, increasing manufacturing costs and varying technologies, sponsors seek a manufacturing partner that can support the entire lifecycle of the device.
- Over 275 companies worldwide have the necessary expertise and authorization to offer contract manufacturing services for various types of medical devices, including therapeutic and diagnostic products
- The market landscape is fragmented, featuring the presence of both established players and new entrants; presently, most medical device manufacturing facilities are located in the developed geographies.
- Medical device CMOs are actively engaged in aligning their operations to comply with the standards established by various global and regional regulatory bodies.
- Implants have emerged as one of the most prominent segments for which the acquisition activity is relatively higher; key value drivers behind such acquisitions include capability addition and geographical consolidation.
- In the last six years, over 9,600 trials evaluating various medical devices have been registered by different types of sponsors covering a wide range of therapeutic areas.
- Companies involved in this domain are steadily expanding their capabilities in order to enhance their respective service portfolios and comply with evolving industry benchmarks.
- Driven by a rapidly growing demand, medical device contract services market is anticipated to grow at annualized rate of over 8.2% for a variety of therapeutic areas and geographies for finished products.
- Established CMOs currently occupy a major share; in the long term, the opportunity is anticipated to be better distributed across different types of companies, device classes and application areas.
MEDICAL DEVICE CONTRACT MANUFACTURING MARKET: KEY SEGMENTS
Therapeutic Medical Devices Segment holds the Largest Share of the Medical Device Contract Manufacturing Market
Based on the application areas, the market is segmented into therapeutic medical devices, diagnostic medical devices, drug delivery medical devices and other devices. At present, the therapeutic medical devices segment holds the maximum share of the global medical device contract manufacturing market owing to the increasing demand for therapeutic devices such as insulin pumps and infusion pumps. Further, the medical device contract manufacturing market for drug delivery devices segment is expected to show the highest market growth potential during the forecast period.
By Device Class, Class II is the Fastest Growing Segment of the Global Medical Device Contract Manufacturing Market
Based on the device class, the market is segmented into Class I, Class II and Class III. At present, the class II segment holds the maximum share of the global medical device contract manufacturing market. Further, owing to the various benefits offered by class II devices, such as ease of customization and diverse product range, the market for class II segment is expected to grow at a higher CAGR during the forecast period.
By Target Therapeutic Area, Orthopedic Disorders Segment Accounts for the Largest Share of the Global Medical Device Contract Manufacturing Market
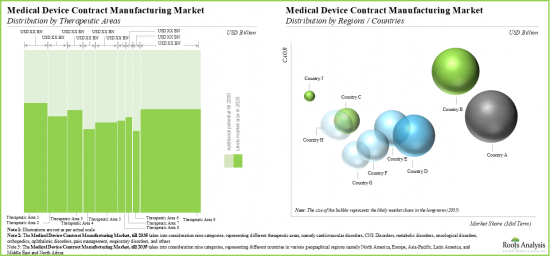
Based on the target therapeutic area, the market is segmented into cardiovascular disorders, CNS disorders, metabolic disorders, oncological disorders, orthopedic disorders, ophthalmic disorders, pain disorders, respiratory disorders, and others. Currently, the orthopedic disorders segment captures the highest proportion of the global medical device contract manufacturing market. However, the metabolic disorders segment is expected to grow at a higher CAGR during the forecast period owing to the growing prevalence of metabolic disorders such as obesity, insulin resistance, Type 1 diabetes and hypertension.
North America Accounts for the Largest Share of the Market
Based on key geographical regions, the market is segmented into North America, Europe, Asia-Pacific and Rest of the World. Currently, North America dominates the global medical device contract manufacturing market and accounts for the largest revenue share. Further, the market in Asia-Pacific is likely to grow at a higher CAGR in the coming future.
Example Players in the Medical Device Contract Manufacturing Market
- Cirtec Medical
- Creganna Medical
- DynaFlex Technologies
- Europlaz Technologies
- I-Tek Medical Technologies
- Interplex
- Keystone Solutions Group
- Modern Medical
- Oscor
- Riverside Medical Packaging
- SMC
- Synecco
- Suzhou Jenitek
- Stellartech Research
- Trelleborg Sealing Solutions
MEDICAL DEVICE CONTRACT MANUFACTURING MARKET: RESEARCH COVERAGE
- Market Sizing and Opportunity Analysis: The report features an in-depth analysis of the global medical device contract manufacturing market, focusing on key market segments, including [A] application areas, [B] device class, [C] target therapeutic area and [D] key geographical regions.
- Market Landscape: A comprehensive evaluation of the medical device contract manufacturers, based on several relevant parameters, such as [A] year of establishment, [B] company size, [C] manufacturing facilities, [D] geographical location, [E] type of device manufactured, [F] the scale of operation and [G] types of services offered.
- Regulatory Landscape for Medical Devices: A comprehensive discussion of the various guidelines established by major regulatory bodies for medical device approval across different countries. Additionally, the section includes a multi-dimensional bubble analysis, focusing on a comparison of the contemporary regulatory scenario in key geographies across the globe.
- Benchmark Analysis: A comprehensive benchmark analysis emphasizing the primary focus areas of small, mid-sized, and large companies, comparing their current capabilities within and across peer groups, and offering stakeholders insights to achieve a competitive advantage in the industry.
- Supply Chain Analysis: A detailed analysis of medical device supply chain, highlighting the role of CMOs engaged in the medical device contract manufacturing market and analysis based on services offered, such as [A] supply chain management services, [B] logistics services, [C] shipping services, and [D] warehousing services.
- Company Profiles: In-depth profiles of key players that specialize in providing services for both pre-commercial and commercial scale manufacturing of medical devices, focusing on [A] overview of the company, [B] service portfolio, [C] manufacturing facilities and [D] recent developments and an informed future outlook.
- Clinical Trial Analysis: An insightful analysis of clinical trials related to medical devices, based on several parameters, such as [A] number of registered trials, [B] current status of trials, [C] phase of development, [D] type of sponsor, [E] therapeutic area(s), [F] target disease indication(s), and [G] number of patients enrolled.
- Mergers and Acquisitions: An in-depth analysis of mergers and acquisitions undertaken in the medical device contract manufacturing market highlighting the number of companies acquired in recent years. Further, in depth-analysis of the key value drivers for these mergers and acquisitions was performed. In addition, the analysis features an ownership change matrix, providing a summary of the involvement of private and public sector entities in the market.
- SWOT Analysis: An analysis of industry affiliated trends, opportunities and challenges, which are likely to impact the evolution of antibody contract manufacturing market; it includes a Harvey ball analysis, assessing the relative impact of each SWOT parameter on industry dynamics.
KEY QUESTIONS ANSWERED IN THIS REPORT
- How many companies are currently engaged in this market?
- Which are the leading companies in this market?
- What factors are likely to influence the evolution of this market?
- What is the current and future market size?
- What is the CAGR of this market?
- How is the current and future market opportunity likely to be distributed across key market segments?
REASONS TO BUY THIS REPORT
- The report provides a comprehensive market analysis, offering detailed revenue projections of the overall market and its specific sub-segments. This information is valuable to both established market leaders and emerging entrants.
- Stakeholders can leverage the report to gain a deeper understanding of the competitive dynamics within the market. By analyzing the competitive landscape, businesses can make informed decisions to optimize their market positioning and develop effective go-to-market strategies.
- The report offers stakeholders a comprehensive overview of the market, including key drivers, barriers, opportunities, and challenges. This information empowers stakeholders to stay abreast of market trends and make data-driven decisions to capitalize on growth prospects.
ADDITIONAL BENEFITS
- Complimentary PPT Insights Packs
- Complimentary Excel Data Packs for all Analytical Modules in the Report
- 15% Free Content Customization
- Detailed Report Walkthrough Session with Research Team
- Free Updated report if the report is 6-12 months old or older
TABLE OF CONTENTS
1. PREFACE
- 1.1. Scope of the Report
- 1.2. Research Methodology
- 1.2.1. Research Assumptions
- 1.2.2. Project Methodology
- 1.2.3. Forecast Methodology
- 1.2.4. Robust Quality Control
- 1.2.5. Key Considerations
- 1.2.5.1. Demographics
- 1.2.5.2. Economic Factors
- 1.2.5.3. Government Regulations
- 1.2.5.4. Supply Chain
- 1.2.5.5. COVID Impact / Related Factors
- 1.2.5.6. Market Access
- 1.2.5.7. Healthcare Policies
- 1.2.5.8. Industry Consolidation
- 1.3 Key Questions Answered
- 1.4. Chapter Outlines
2. EXECUTIVE SUMMARY
3. INTRODUCTION
- 3.1. Chapter Overview
- 3.2. Medical Devices: An Overview
- 3.2.1. History of Medical Devices
- 3.2.2. Classification of Medical Devices
- 3.3. Medical Device Manufacturing
- 3.3.1. Challenges Associated with Medical Device Manufacturing
- 3.3.2. Role of CMOs in Medical Device Manufacturing
- 3.3.3. Role of Automation in Medical Device Manufacturing Process
- 3.4. Historical Timeline for Medical Device CMOs
- 3.5. Services Offered by Medical Device CMOs
- 3.6. Advantages Offered by Medical Device CMOs
- 3.7. Risks associated with Outsourcing to CMOs
- 3.8. Key Considerations
- 3.9. Concluding Remarks
4. REGULATORY LANDSCAPE FOR MEDICAL DEVICES
- 4.1. Chapter Overview
- 4.2. General Regulatory Guidelines for Medical Devices
- 4.3. Regulatory Landscape in North America
- 4.3.1. The US Scenario
- 4.3.1.1. Regulatory Authority
- 4.3.1.2. Review / Approval Process
- 4.3.2. The Canadian Scenario
- 4.3.2.1. Regulatory Authority
- 4.3.2.2. Review / Approval Process
- 4.3.1. The US Scenario
- 4.4. Regulatory Landscape in Europe
- 4.4.1. Overall Scenario
- 4.4.1.1. Regulatory Authority
- 4.4.1.2. Review / Approval Process
- 4.4.2. Case Study: Brexit -The UK Scenario
- 4.4.1. Overall Scenario
- 4.5. Regulatory Landscape in Asia-Pacific
- 4.5.1. The Chinese Scenario
- 4.5.1.1. Regulatory Authority
- 4.5.1.2. Review / Approval Process
- 4.5.2. The Japanese Scenario
- 4.5.2.1. Regulatory Authority
- 4.5.2.2. Review / Approval Process
- 4.5.3. The Australian Scenario
- 4.5.3.1. Regulatory Authority
- 4.5.3.2. Review / Approval Process
- 4.5.1. The Chinese Scenario
- 4.6. Comparison of Regional Regulatory Environment
5. MARKET OVERVIEW: THERAPEUTIC DEVICES
- 5.1. Chapter Overview
- 5.2. Medical Device CMOs Offering Services for Therapeutic Devices
- 5.2.1. Analysis by Year of Establishment
- 5.2.2. Analysis by Size of Employee Base
- 5.2.3. Analysis by Location of Headquarters
- 5.2.4. Analysis by Location of Manufacturing Facility
- 5.2.5. Analysis by Regulatory Certifications / Accreditations
- 5.2.6. Analysis by Production Services Offered
- 5.2.7. Analysis by Post-production Services Offered
- 5.2.8. Analysis by Other Services Offered
- 5.2.9. Analysis by Device Class
- 5.2.10. Analysis by Type of Material(s) Handled
- 5.2.11. Analysis by Scale of Operation
- 5.2.12. Leading Players
6. MARKET OVERVIEW: DIAGNOSTIC DEVICES
- 6.1. Chapter Overview
- 6.2. Medical Device CMOs Offering Services for Diagnostic Devices
- 6.2.1. Analysis by Year of Establishment
- 6.2.2. Analysis by Size of Employee Base
- 6.2.3. Analysis by Location of Headquarters
- 6.2.4. Analysis by Location of Manufacturing Facility
- 6.2.5. Analysis by Regulatory Certifications / Accreditations
- 6.2.6. Analysis by Production Services Offered
- 6.2.7. Analysis by Post-Production Services Offered
- 6.2.8. Analysis by Other Services Offered
- 6.2.9. Analysis by Device Class
- 6.2.10. Analysis by Type of Material(s) Handled
- 6.2.11. Analysis by Scale of Operation
- 6.2.12. Leading Players
7. MARKET OVERVIEW: DELIVERY SYSTEMS AND OTHERS
- 7.1. Chapter Overview
- 7.2. Catheters
- 7.2.1. Medical Device CMOs Offering Services for Catheters
- 7.2.2. Analysis by Year of Establishment
- 7.2.3. Analysis by Size of Employee Base
- 7.2.4. Analysis by Location of Headquarters
- 7.2.5. Analysis by Location of Manufacturing Facility
- 7.2.6. Analysis by Regulatory Certifications / Accreditations
- 7.2.7. Analysis by Production Services Offered
- 7.2.8. Analysis by Post-Production Services Offered
- 7.2.9. Analysis by Other Services Offered
- 7.2.10. Analysis by Device Class
- 7.2.11. Analysis by Type of Material(s) Handled
- 7.2.12. Analysis by Scale of Operation
- 7.2.13. Leading Players
- 7.3. Drug Delivery Devices
- 7.3.1. Medical Device CMOs Offering Services for Drug Delivery Devices
- 7.3.2. Analysis by Year of Establishment
- 7.3.3. Analysis by Size of Employee Base
- 7.3.4. Analysis by Location of Headquarters
- 7.3.5. Analysis by Location of Manufacturing Facility
- 7.3.6. Analysis by Regulatory Certifications / Accreditations
- 7.3.7. Analysis by Production Services Offered
- 7.3.8. Analysis by Post-Production Services Offered
- 7.3.9. Analysis by Other Services Offered
- 7.3.10. Analysis by Device Class
- 7.3.11. Analysis by Type of Material(s) Handled
- 7.3.12. Analysis by Scale of Operation
- 7.3.13. Leading Players
- 7.4. Other Devices
- 7.4.1. Medical Device CMOs Offering Services for Other Medical Devices
- 7.4.2. Analysis by Year of Establishment
- 7.4.3. Analysis by Size of Employee Base
- 7.4.4. Analysis by Location of Headquarters
- 7.4.5. Analysis by Location of Manufacturing Facility
- 7.4.6. Analysis by Regulatory Certifications / Accreditations
- 7.4.7. Analysis by Production Services Offered
- 7.4.8. Analysis by Post-Production Services Offered
- 7.4.9. Analysis by Other Services Offered
- 7.4.10. Analysis by Device Class
- 7.4.11. Analysis by Type of Material(s) Handled
- 7.4.12. Analysis by Scale of Operation
8. BENCHMARK ANALYSIS
- 8.1. Chapter Overview
- 8.2. Benchmark Analysis: Methodology
- 8.3. Region-wise Benchmark Analysis
- 8.3.1. North America, Peer Group I
- 8.3.2. North America, Peer Group II
- 8.3.3. North America, Peer Group III
- 8.3.4. North America, Peer Group IV
- 8.3.5. North America, Peer Group V
- 8.3.6. North America, Peer Group VI
- 8.3.7. North America, Peer Group VII
- 8.3.8. Europe, Peer Group VIII
- 8.3.9. Europe, Peer Group IX
- 8.3.10. Europe, Peer Group X
- 8.3.11. Asia, Peer Group XI
- 8.3.12. Asia, Peer Group XII
- 8.4. Concluding Remarks
9. SUPPLY CHAIN ANALYSIS
- 9.1. Chapter Overview
- 9.2. Overview of the Medical Device Supply Chain
- 9.3. Factors Affecting the Medical Device Supply Chain
- 9.4. Key Performance Indicators
- 9.5. Supply Chain Improvement Strategies
- 9.5.1. Optimization of Supply Chain Capabilities
- 9.5.2. Visible Supply Chain and Related Advantages
- 9.5.2.1. Augmenting Supply Chain Visibility Through Digitalization
- 9.5.2.2. Benefits of Digital Supply Chain
- 9.6. Effects of Supply Chain Optimization
- 9.7. Cost Analysis
- 9.7.1. Production-related Costs
- 9.7.1.1. Labor Costs
- 9.7.1.2. Raw Materials Related Costs
- 9.7.1.3. Regulatory Compliance
- 9.7.1.4. Technology-related Costs
- 9.7.2. Supply Chain-related Costs
- 9.7.2.1. Local Presence
- 9.7.2.2. Geopolitical Risk
- 9.7.2.3. Logistics
- 9.7.1. Production-related Costs
10. COMPANY PROFILES
- 10.1. Chapter Overview
- 10.2. CMOs Headquartered in North America
- 10.2.1. Cirtec Medical
- 10.2.1.1. Company Overview
- 10.2.1.2. Service Portfolio
- 10.2.1.3. Manufacturing Capabilities and Facilities
- 10.2.1.3.1. Facilities located in North America
- 10.2.1.3.2. Facilities Located in Europe
- 10.2.1.4. Future Outlook
- 10.2.2. DynaFlex Technologies
- 10.2.2.1. Company Overview
- 10.2.2.2. Service Portfolio
- 10.2.2.3. Manufacturing Capabilities and Facilities
- 10.2.2.4. Future Outlook
- 10.2.3. I-Tek Medical Technologies
- 10.2.3.1. Company Overview
- 10.2.3.2. Service Portfolio
- 10.2.3.3. Manufacturing Capabilities and Facilities
- 10.2.3.4. Future Outlook
- 10.2.4. Keystone Solutions Group
- 10.2.4.1. Company Overview
- 10.2.4.2. Service portfolio
- 10.2.4.3. Manufacturing Facilities
- 10.2.4.4. Future Outlook
- 10.2.5. Oscor
- 10.2.5.1. Company Overview
- 10.2.5.2. Service Portfolio
- 10.2.5.3. Manufacturing Capabilities and facilities
- 10.2.5.4. Future Outlook
- 10.2.6. SMC
- 10.2.6.1. Company Overview
- 10.2.6.2. Service Portfolio
- 10.2.6.3. Manufacturing Capabilities and facilities
- 10.2.6.3.1. Facilities Located in North America
- 10.2.6.3.2. Facility Located in Central America
- 10.2.6.3.3. Facility Located in Europe
- 10.2.6.3.4. Facility Located in Asia
- 10.2.6.4. Future Outlook
- 10.2.7. Stellartech Research
- 10.2.7.1. Company Overview
- 10.2.7.2. Service Portfolio
- 10.2.7.3. Manufacturing Capabilities and facilities
- 10.2.7.4. Future Outlook
- 10.2.1. Cirtec Medical
- 10.3. CMOs Headquartered in Europe
- 10.3.1. Creganna Medical
- 10.3.1.1. Company Overview
- 10.3.1.2. Service Portfolio
- 10.3.1.3. Manufacturing Facilities
- 10.3.1.3.1. Facilities Located in North America
- 10.3.1.3.2. Facilities Located in Central America
- 10.3.1.3.3. Facilities Located in Europe
- 10.3.1.3.4. Facilities Located in Asia
- 10.3.1.4. Future Outlook
- 10.3.2. Europlaz Technologies
- 10.3.2.1. Company Overview
- 10.3.2.2. Service Portfolio
- 10.3.2.3. Manufacturing facilities
- 10.3.2.4. Future Outlook
- 10.3.3. Riverside Medical Packaging
- 10.3.3.1. Company Overview
- 10.3.3.2. Service Portfolio
- 10.3.3.3. Manufacturing Facilities
- 10.3.3.4. Future Outlook
- 10.3.4. Synecco
- 10.3.4.1. Company Overview
- 10.3.4.2. Service Portfolio
- 10.3.4.3. Manufacturing Facilities
- 10.3.4.3.1. Facilities Located in Europe
- 10.3.4.3.2. Facilities Located in Asia
- 10.3.4.4. Future Outlook
- 10.3.5. Trelleborg Sealing Solutions
- 10.3.5.1. Company Overview
- 10.3.5.2. Service Portfolio
- 10.3.5.3. Manufacturing Facilities
- 10.3.5.3.1. Facilities Located in North America
- 10.3.5.3.2. Facilities Located in Europe
- 10.3.5.4. Future Outlook
- 10.3.1. Creganna Medical
- 10.4. CMOs Headquartered in Asia
- 10.4.1. Interplex
- 10.4.1.1. Company Overview
- 10.4.1.2. Service Portfolio
- 10.4.1.3. Manufacturing Facilities
- 10.4.1.3.1. Facilities Located in North America
- 10.4.1.3.2. Facilities Located in Europe
- 10.4.1.3.3. Facilities Located in Asia
- 10.4.1.4. Future Outlook
- 10.4.2. Modern Medical
- 10.4.2.1. Company Overview
- 10.4.2.2. Service Portfolio
- 10.4.2.3. Manufacturing facilities
- 10.4.2.4. Future Outlook
- 10.4.3. Providence Enterprise
- 10.4.3.1. Company Overview
- 10.4.3.2. Service Portfolio
- 10.4.3.3. Manufacturing Facilities
- 10.4.3.4. Future Outlook
- 10.4.4. Suzhou JenitekJenitek
- 10.4.4.1. Company overview
- 10.4.4.2. Service Portfolio
- 10.4.4.3. Manufacturing Facilities
- 10.4.4.4. Future Outlook
- 10.4.1. Interplex
11. CLINICAL TRIAL ANALYSIS
- 11.1. Chapter Overview
- 11.2. Scope and Methodology
- 11.3. Clinical Trial Analysis: Word Cloud of Trial Titles
- 11.4. Analysis of Clinical Trials
- 11.4.1. Analysis by Trial Start Year
- 11.4.2. Analysis by Trial Status
- 11.4.3. Analysis by Phase of Development
- 11.4.4. Analysis by Target Indication
- 11.4.5. Analysis by Type of Sponsor
- 11.4.6. Analysis by Geography
- 11.4.7. Analysis by Trial Start Year and Geography
- 11.5. Analysis of Enrolled Patient Population
- 11.5.1. Analysis by Trial Status
- 11.5.2. Analysis by Phase of Development
- 11.5.3. Analysis by Geography
- 11.6. Analysis of Focus Therapeutic Areas
- 11.6.1. Analysis by Type of Sponsor
- 11.6.2. Analysis by Geography
- 11.6.2.1. North American Scenario
- 11.6.2.2. European Scenario
- 11.6.2.3. Asia Pacific Scenario
- 11.6.2.4. Rest of the World Scenario
- 11.6.3. Cardiovascular Disorders
- 11.6.3.1. Analysis by Trial Start Year
- 11.6.3.2. Analysis by Type of Sponsor
- 11.6.3.3. Analysis by Geography
- 11.6.4. Oncological Disorders
- 11.6.4.1. Analysis by Trial Start Year
- 11.6.4.2. Analysis by Type of Sponsor
- 11.6.4.3. Analysis by Geography
- 11.6.5. Central Nervous System (CNS) Disorders
- 11.6.5.1. Analysis by Trial Start Year
- 11.6.5.2. Analysis by Type of Sponsor
- 11.6.5.3. Analysis by Geography
- 11.6.6. Orthopedic Disorders
- 11.6.6.1. Analysis by Trial Start Year
- 11.6.6.2. Analysis by Type of Sponsor
- 11.6.6.3. Analysis by Geography
- 11.6.7. Respiratory Disorders
- 11.6.7.1. Analysis by Trial Start Year
- 11.6.7.2. Analysis by Type of Sponsor
- 11.6.7.3. Analysis by Geography
12. MERGERS AND ACQUISITIONS
- 12.1. Chapter Overview
- 12.2. Merger and Acquisition Models
- 12.3. Medical Device Contract Manufacturing: Mergers and Acquisitions
- 12.3.1. Analysis by Year of Mergers and Acquisitions
- 12.3.2. Analysis by Type of Acquisition
- 12.3.3. Most Active Acquirers: Analysis by Number of Acquisitions
- 12.3.4. Analysis by Key Value Drivers
- 12.3.4.1. Continent-wise distribution
- 12.3.4.2. Intercontinental and Intracontinental Deals
- 12.3.4.3. Country-wise distribution
- 12.3.5. Ownership Change Matrix
- 12.3.6. Acquisitions Made by Medical Device Companies
- 12.3.6.1. Acquisition of Entire Company
- 12.3.6.1.1. Analysis by Key Value Drivers
- 12.3.6.1.2. Analysis by Key Value Drivers and Year of Acquisition
- 12.3.6.1.3. Analysis by Type of Services Offered
- 12.3.6.1.4. Analysis by Type of Device
- 12.3.6.1.5. Analysis by Therapeutic Area
- 12.3.6.2. Acquisition of Company Assets
- 12.3.6.2.1. Analysis by Key Value Drivers
- 12.3.6.2.2. Analysis by Key Value Drivers and Year of Acquisition
- 12.3.6.1. Acquisition of Entire Company
- 12.3.7. Acquisition by Private Equity Firms
- 12.3.7.1. Analysis by Year of Acquisition
- 12.3.7.2. Analysis by Type of Acquisition
- 12.3.7.3. Analysis by Type of Device
- 12.3.7.4. Analysis by Therapeutic Area
- 12.4. Key Acquisitions: Deal Multiples
- 12.4.1. Analysis by Revenues
13. CASE STUDY: OFFSHORING MEDICAL DEVICE CONTRACT MANUFACTURING
- 13.1. Chapter Overview
- 13.2. Emerging Markets: Definitions and Key Regions
- 13.3. Role of Emerging Markets in Industrial Manufacturing
- 13.3.1. Contributions to the Automobile Industry
- 13.3.2. Contributions to the Aerospace and Defense Industries
- 13.4. Medical Devices Manufacturing in Emerging Markets
- 13.4.1. The US-Chinese Scenario
- 13.4.2. Partnership with Companies in Emerging Markets
- 13.5. Multinational Companies Focused on Manufacturing Medical Devices in Emerging Markets
- 13.6. Business Models for Medical Device Manufacturing in Emerging Markets
- 13.6.1. Case Studies
- 13.6.1.1. Study A: Overview
- 13.6.1.1.1. Value Proposition
- 13.6.1.1.2. Value Creation
- 13.6.1.2. Study B: Overview
- 13.6.1.2.1. Value Proposition
- 13.6.1.2.2. Value Creation
- 13.6.1.1. Study A: Overview
- 13.6.1. Case Studies
- 13.7. Key Challenges related to Innovation in the Medical Device Industry
- 13.7.1. Limitations of In-House Innovation
- 13.8. Advantages of Establishing Innovation Hubs in Emerging Markets
- 13.8.1. Challenges and Market Restraints
- 13.8.2. Strategies to Address Existing Challenges
- 13.9. Future Perspectives
14. MARKET FORECAST
- 14.1. Chapter Overview
- 14.2. Forecast Methodology and Key Assumptions
- 14.3. Overall Medical Device Contract Manufacturing Market, till 2035
- 14.3.1. Medical Device Contract Manufacturing Market: Distribution by Application Areas, till 2035
- 14.3.1.1. Medical Device Contract Manufacturing Market for Therapeutic Devices, till 2035
- 14.3.1.2. Medical Device Contract Manufacturing Market for Diagnostic Devices, till 2035
- 14.3.1.3. Medical Device Contract Manufacturing Market for Drug Delivery Devices, till 2035
- 14.3.1.4. Medical Device Contract Manufacturing Market for Other Devices, till 2035
- 14.3.2. Medical Device Contract Manufacturing Market: Distribution by Device Class, till 2035
- 14.3.2.1. Medical Device Contract Manufacturing Market: Class I Devices, till 2035
- 14.3.2.2. Medical Device Contract Manufacturing Market: Class II Devices, till 2035
- 14.3.2.3. Medical Device Contract Manufacturing Market: Class III Devices, till 2035
- 14.3.3. Medical Device Contract Manufacturing Market: Leading Players, till 2035
- 14.3.4. Medical Device Contract Manufacturing Market: Distribution by Therapeutic Areas, till 2035
- 14.3.4.1. Medical Device Contract Manufacturing Market for Cardiovascular Disorders, till 2035
- 14.3.4.2. Medical Device Contract Manufacturing Market for CNS Disorders, till 2035
- 14.3.4.3. Medical Device Contract Manufacturing Market for Metabolic Disorders, till 2035
- 14.3.4.4. Medical Device Contract Manufacturing Market for Oncological Disorders, till 2035
- 14.3.4.5. Medical Device Contract Manufacturing Market for Orthopedic Disorders, till 2035
- 14.3.4.6. Medical Device Contract Manufacturing Market for Ophthalmic Disorders, till 2035
- 14.3.4.7. Medical Device Contract Manufacturing Market for Pain Disorders, till 2035
- 14.3.4.8. Medical Device Contract Manufacturing Market for Respiratory Disorders, till 2035
- 14.3.4.9. Medical Device Contract Manufacturing Market for Other Therapeutic Areas, till 2035
- 14.3.1. Medical Device Contract Manufacturing Market: Distribution by Application Areas, till 2035
- 14.4. Medical Device Contract Manufacturing Market: Distribution by Geography, till 2035
- 14.4.1. Medical Device Contract Manufacturing Market in North America, till 2035
- 14.4.1.1. Medical Device Contract Manufacturing Market in the US, till 2035
- 14.4.1.2. Medical Device Contract Manufacturing Market in Rest of North America, till 2035
- 14.4.1.3. Medical Device Contract Manufacturing Market in North America: Class I Devices, till 2035
- 14.4.1.4. Medical Device Contract Manufacturing Market in North America: Class II Devices, till 2035
- 14.4.1.5. Medical Device Contract Manufacturing Market in North America: Class III Devices, till 2035
- 14.4.1.6. Medical Device Contract Manufacturing Market in North America for Cardiovascular Disorders, till 2035
- 14.4.1.7. Medical Device Contract Manufacturing Market in North America for CNS Disorders, till 2035
- 14.4.1.8. Medical Device Contract Manufacturing Market in North America for Metabolic Disorders, till 2035
- 14.4.1.9. Medical Device Contract Manufacturing Market in North America for Oncological Disorders, till 2035
- 14.4.1.10. Medical Device Contract Manufacturing Market in North America for Orthopedic Disorders, till 2035
- 14.4.1.11. Medical Device Contract Manufacturing Market in North America for Ophthalmic Disorders, till 2035
- 14.4.1.12. Medical Device Contract Manufacturing Market in North America for Pain Disorders, till 2035
- 14.4.1.13. Medical Device Contract Manufacturing Market in North America for Respiratory Disorders, till 2035
- 14.4.1.14. Medical Device Contract Manufacturing Market for Other Therapeutic Areas in North America, till 2035
- 14.4.2. Medical Device Contract Manufacturing Market in Europe, till 2035
- 14.4.2.1. Medical Device Contract Manufacturing Market in Italy, till 2035
- 14.4.2.2. Medical Device Contract Manufacturing Market in Germany, till 2035
- 14.4.2.3. Medical Device Contract Manufacturing Market in France, till 2035
- 14.4.2.4. Medical Device Contract Manufacturing Market in Spain, till 2035
- 14.4.2.5. Medical Device Contract Manufacturing Market in the UK, till 2035
- 14.4.2.6. Medical Device Contract Manufacturing Market in Rest of Europe, till 2035
- 14.4.2.7. Medical Device Contract Manufacturing Market in Europe: Class I Devices, till 2035
- 14.4.2.8. Medical Device Contract Manufacturing Market in Europe: Class II Devices, till 2035
- 14.4.2.9. Medical Device Contract Manufacturing Market in Europe: Class III Devices, till 2035
- 14.4.2.10. Medical Device Contract Manufacturing Market in Europe for Cardiovascular Disorders, till 2035
- 14.4.2.11. Medical Device Contract Manufacturing Market in Europe for CNS Disorders, till 2035
- 14.4.2.12. Medical Device Contract Manufacturing Market in Europe for Metabolic Disorders, till 2035
- 14.4.2.13. Medical Device Contract Manufacturing Market in Europe for Oncological Disorders, till 2035
- 14.4.2.14. Medical Device Contract Manufacturing Market in Europe for Orthopedic Disorders, till 2035
- 14.4.2.15. Medical Device Contract Manufacturing Market in Europe for Ophthalmic Disorders, till 2035
- 14.4.2.16. Medical Device Contract Manufacturing Market in Europe for Pain Disorders, till 2035
- 14.4.2.17. Medical Device Contract Manufacturing Market in Europe for Respiratory Disorders, till 2035
- 14.4.2.18. Medical Device Contract Manufacturing Market in Europe for Other Therapeutic Areas, till 2035
- 14.4.3. Medical Device Contract Manufacturing Market in Asia Pacific, till 2035
- 14.4.3.1. Medical Device Contract Manufacturing Market in China, till 2035
- 14.4.3.2. Medical Device Contract Manufacturing Market in Japan, till 2035
- 14.4.3.3. Medical Device Contract Manufacturing Market in India, till 2035
- 14.4.3.4. Medical Device Contract Manufacturing Market in Rest of Asia Pacific, till 2035
- 14.4.3.5. Medical Device Contract Manufacturing Market in Asia Pacific: Class I Devices, till 2035
- 14.4.3.6. Medical Device Contract Manufacturing Market in Asia Pacific: Class II Devices, till 2035
- 14.4.3.7. Medical Device Contract Manufacturing Market in Asia Pacific: Class III Devices, till 2035
- 14.4.3.8. Medical Device Contract Manufacturing Market in Asia Pacific for Cardiovascular Disorders, till 2035
- 14.4.3.9. Medical Device Contract Manufacturing Market in Asia Pacific for CNS Disorders, till 2035
- 14.4.3.10. Medical Device Contract Manufacturing Market in Asia Pacific for Metabolic Disorders, till 2035
- 14.4.3.11. Medical Device Contract Manufacturing Market in Asia Pacific for Oncological Disorders, till 2035
- 14.4.3.12. Medical Device Contract Manufacturing Market in Asia Pacific for Orthopedic Disorders, till 2035
- 14.4.3.13. Medical Device Contract Manufacturing Market in Asia Pacific for Ophthalmic Disorders, till 2035
- 14.4.3.14. Medical Device Contract Manufacturing Market in Asia Pacific for Pain Disorders, till 2035
- 14.4.3.15. Medical Device Contract Manufacturing Market in Asia Pacific for Respiratory Disorders, till 2035
- 14.4.3.16. Medical Device Contract Manufacturing Market in Asia Pacific for Other Therapeutic Areas, till 2035
- 14.4.4. Medical Device Contract Manufacturing Market in Rest of the World, till 2035
- 14.4.4.1. Medical Device Contract Manufacturing Market in Rest of the World: Class I Devices, till 2035
- 14.4.4.2. Medical Device Contract Manufacturing Market in Rest of the World: Class II Devices, till 2035
- 14.4.4.3. Medical Device Contract Manufacturing Market in Rest of the World: Class III Devices, till 2035
- 14.4.4.4. Medical Device Contract Manufacturing Market in Rest of the World for Cardiovascular Disorders, till 2035
- 14.4.4.5. Medical Device Contract Manufacturing Market in Rest of the World for CNS Disorders, till 2035
- 14.4.4.6. Medical Device Contract Manufacturing Market in Rest of the World for Metabolic Disorders, till 2035
- 14.4.4.7. Medical Device Contract Manufacturing Market in Rest of the World for Oncological Disorders, till 2035
- 14.4.4.8. Medical Device Contract Manufacturing Market in Rest of the World for Orthopedic Disorders, till 2035
- 14.4.4.9. Medical Device Contract Manufacturing Market in Rest of the World for Ophthalmic Disorders, till 2035
- 14.4.4.10. Medical Device Contract Manufacturing Market in Rest of the World for Pain Disorders, till 2035
- 14.4.4.11. Medical Device Contract Manufacturing Market in Rest of the World for Respiratory Disorders, till 2035
- 14.4.4.12. Medical Device Contract Manufacturing Market in Rest of the World for Other Therapeutic Areas, till 2035
- 14.4.1. Medical Device Contract Manufacturing Market in North America, till 2035
15. SWOT ANALYSIS
- 15.1. Chapter Overview
- 15.2. Strengths
- 15.3. Weaknesses
- 15.4. Opportunities
- 15.5. Threats
- 15.6. Concluding Remarks
16. CONCLUSION
- 16.1. Chapter Overview
- 16.2. Key Takeaways
