
|
市場調査レポート
商品コード
1762530
医薬品開発業務受託機関(CRO)サービス市場:業界動向と世界の予測 - 事業規模別、対象治療領域別、主要地域別Pharma Contract Research Organization Services Market: Industry Trends and Global Forecasts - Distribution by Scale of Operation, Target Therapeutic Area and Key Geographies |
||||||
カスタマイズ可能
|
|||||||
| 医薬品開発業務受託機関(CRO)サービス市場:業界動向と世界の予測 - 事業規模別、対象治療領域別、主要地域別 |
|
出版日: 2025年07月04日
発行: Roots Analysis
ページ情報: 英文 503 Pages
納期: 7~10営業日
|

全表示
- 概要
- 図表
- 目次
医薬品開発業務受託機関(CRO)サービス市場:概要
世界の医薬品開発業務受託機関(CRO)サービスの市場規模は、今年250億米ドルとなりました。同市場は、予測期間中に10%の有利なCAGRで成長すると予測されています。
市場セグメンテーションでは、市場規模と機会分析を以下のパラメータで区分しています。
事業規模
- 探索サービス
- 前臨床サービス
- 臨床段階サービス
対象治療領域
- 循環器疾患
- 皮膚疾患
- 感染症
- 炎症性疾患
- 神経疾患
- 腫瘍学的疾患
- 眼科疾患
- 呼吸器疾患
- その他の疾患
主要地域
- 北米
- 欧州
- アジア太平洋
- ラテンアメリカ
- 中東・北アフリカ
- その他の地域
医薬品開発業務受託機関(CRO)市場:成長と動向
医薬品開発プロセス全体は、有望な薬理学的候補の特定から始まり、臨床的に承認された製品を市場に送り出すまでです。このプロセス全体は約10年から15年に及びます。さらに、臨床研究と創薬の両方が多額の資金を必要とし、平均投資額は40億米ドルから100億米ドルに及びます。そのため、創薬と研究開発には法外な設備投資と複雑なインフラが必要となるため、イノベーターは医薬品開発業務受託業者への依存度を高めています。
医薬品市場におけるアウトソーシングの動向の高まりは、CROが提供する多様なサービスや臨床研究のタイムラインを最適化する能力に起因しています。さらに、CROはカスタマイズされたサービス、コスト削減、先端技術へのアクセスなど、いくつかのメリットを提供するため、多くの製薬企業が調査業務のアウトソーシングを行うようになっています。さらに、新規治療薬への需要が進化し続ける中、CROはカスタマイズサービスや個別化医療といった新たな動向をナビゲートしていくことが期待されています。
医薬品開発業務受託機関(CRO)サービス市場:主要インサイト
当レポートでは、世界の医薬品開発業務受託機関(CRO)サービス市場の現状を調査し、潜在的な成長機会を特定しています。当レポートの主な調査結果は以下の通りです。
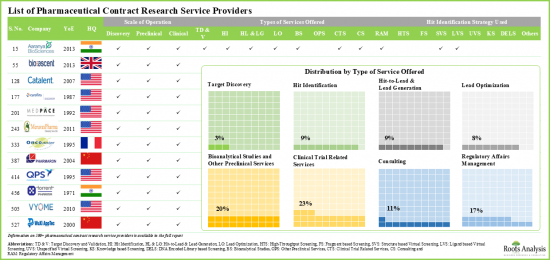
- 現在、複数の業界参入企業が、様々な医薬品介入に必要な広範な受託研究サービスや臨床試験サポートを提供するために必要な能力を持っていると主張しています。
- 市場は断片化されており、複数の治療領域や異なる事業規模で研究受託サービスを提供する既存企業と小規模企業の両方が存在します。
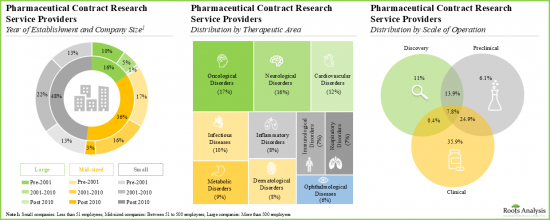
- 40%以上の企業は2010年以降に設立されました。そのような企業の例としては、Assay.Works、Celerion、Concept Life Sciences、Molecular Forecaster、ProRelix Researchなどがあります。
- 利害関係者の大半は、様々ながん、神経疾患、心血管疾患の治療のための低分子薬理学的介入の研究開発サービスを提供しています。
- 様々な臨床研究サービスの中で、企業は主に臨床試験管理、メディカルライティング、ファーマコビジランス研究、生物統計学、データ管理サービスのサポートを提供しています。
- 顧客や利害関係者の臨床研究関連のニーズの進化に対応するため、利害関係者は世界の先進地域と開発途上地域の両方で存在感を確立しています。
- 競合優位性を獲得するため、サービスプロバイダーは既存の能力を積極的にアップグレードし、新たな能力を追加することで、それぞれのポートフォリオを増強し、既存のベンチマークに準拠しています。
- この領域における利害関係者の関心の高まりは、パートナーシップの増加にも反映されており、2018年以降、業界参入企業はCROと複数の戦略的契約を締結しています。
- パートナーシップ活動は、指定された期間中にCAGR 15%で増加しており、事例の大半は企業の買収に関連していました。
- 過去には、既存企業も新規参入企業も、がんや神経疾患に関して複数の戦略的提携を結んでいます。
- 北米と欧州の既存企業は、戦略的買収を通じて市場でのプレゼンスを積極的に強化しており、ポートフォリオと地理的拡大が主要な価値促進要因の一つとなっています。
- 現在のバイオ医薬品CRO市場情勢は、老舗企業や専門サービスプロバイダーによるサービスが充実しており、成長機会となっています。
- 研究開発業務受託企業の3分の2以上が北米と欧州を拠点としており、そのほとんどが中小企業です。
- CROの20%近くは、臨床および前臨床スケールで生物製剤の調査サービスを提供しており、Alliance PharmaやCovanceなどがその例です。
- 全体の約50%は臨床サービスのみを提供しており、そのうち12%のCROは生物製剤の臨床研究に関連する全てのサービスを提供しています。
- 当社独自の総所有コストモデルにより、20年間のスパンで、さまざまな地域で開発業務受託施設を設立する際の直接的・間接的経費の概算を知ることができます。
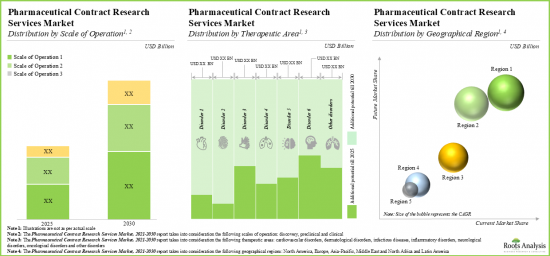
- 医薬品CRO市場は年率10%で成長すると予測され、事業規模、治療分野、主要地域別その機会は十分に分散されると予想されます。
医薬品開発業務受託機関(CRO)サービス市場における参入企業例
- Albany Molecular Research(AMRI)
- BioDuro
- BOC Sciences
- Catalent Pharma
- Charles River Laboratories
- ChemDiv
- Covance
- Medpace
- QPS
- Concept Life Sciences
- Evotec
- ChemPartner
- Pharmaron
- Syngene
- Torrent Pharma
- WuXi AppTec
目次
第1章 序文
第2章 エグゼクティブサマリー
第3章 イントロダクション
- 章の概要
- 医薬品開発の概要
- 創薬プロセス
- 小分子発見に伴う課題
- 創薬業務のアウトソーシングの必要性
- 契約調査サービスプロバイダーの選択に関するガイドライン
- 結論
第4章 医薬品受託開発サービスプロバイダー:市場情勢
- 章の概要
- 医薬品受託開発サービスプロバイダー:業界参入企業一覧
第5章 企業プロファイル
- 章の概要
- 北米の医薬品開発業務受託サービスプロバイダー
- Albany Molecular Research(AMRI)
- BioDuro
- BOC Sciences
- Catalent Pharma
- Charles River Laboratories
- ChemDiv
- Covance
- Medpace
- QPS
- 欧州の医薬品開発業務受託サービスプロバイダー
- Concept Life Sciences
- Evotec
- アジア太平洋の医薬品開発業務受託サービスプロバイダー
- ChemPartner
- Pharmaron
- Syngene
- Torrent Pharma
- WuXi AppTec
第6章 企業競争力分析
- 章の概要
- 調査手法
- 主なパラメータ
- 企業競争力分析:医薬品受託開発サービスプロバイダー
第7章 パートナーシップとコラボレーション
- 章の概要
- パートナーシップモデル
- 医薬品受託開発サービスプロバイダー:パートナーシップおよびコラボレーションのリスト
第8章 合併と買収
第9章 市場予測と機会分析
- 章の概要
- 予測調査手法と主要な前提条件
- 世界の医薬品受託開発サービスプロバイダー市場(2035年まで)
- 2035年までの世界の医薬品受託開発サービスプロバイダー市場:事業規模別
- 2035年までの世界の医薬品受託開発サービスプロバイダー市場:対象治療領域別
- 2035年までの世界の医薬品受託開発サービスプロバイダー市場:地域別
第10章 医薬品受託開発機関における総所有コスト
第11章 ケーススタディ:バイオ医薬品受託開発サービス市場
- 章の概要
- バイオ医薬品CRO:市場情勢
- 前臨床バイオ医薬品CRO
- 臨床バイオ医薬品CRO
第12章 エグゼクティブ洞察
第13章 結論
第14章 付録1:表形式データ
List of Tables
- Table 4.1 Pharmaceutical Contract Research Service Providers: List of Industry Players
- Table 4.2 Pharmaceutical Contract Research Service Providers: Information on Scale of Operation
- Table 4.3 Pharmaceutical Contract Research Service Providers: Information on Types of Services Offered
- Table 4.4 Pharmaceutical Contract Research Service Providers: Information on Hit Identification Strategy Used
- Table 4.5 Pharmaceutical Contract Research Service Providers: Information on Type of Business Model
- Table 4.6 Pharmaceutical Contract Research Service Providers: Information on Type of Business Model
- Table 4.7 Pharmaceutical Contract Research Service Providers: Information on Target Therapeutic Area
- Table 5.1 Pharmaceutical Contract Research Service Providers: List of Profiled Companies
- Table 5.2 AMRI: Company Overview
- Table 5.3 AMRI: Service Portfolio
- Table 5.4 AMRI: Recent Developments and Future Outlook
- Table 5.5 BioDuro: Company Overview
- Table 5.6 BioDuro: Service Portfolio
- Table 5.7 BioDuro: Recent Developments and Future Outlook
- Table 5.8 BOC Sciences: Company Overview
- Table 5.9 BOC Sciences: Service Portfolio
- Table 5.10 BOC Sciences: Recent Developments and Future Outlook
- Table 5.11 Catalent Pharma: Company Overview
- Table 5.12 Catalent Pharma: Service Portfolio
- Table 5.13 Catalent Pharma: Recent Developments and Future Outlook
- Table 5.14 Charles River Laboratories: Company Overview
- Table 5.15 Charles River Laboratories: Service Portfolio
- Table 5.16 Charles River Laboratories: Recent Developments and Future Outlook
- Table 5.17 ChemDiv: Company Overview
- Table 5.18 ChemDiv: Service Portfolio
- Table 5.19 ChemDiv: Recent Developments and Future Outlook
- Table 5.20 Covance: Company Overview
- Table 5.21 Covance: Service Portfolio
- Table 5.22 Covance: Recent Developments and Future Outlook
- Table 5.23 Medpace: Company Overview
- Table 5.24 Medpace: Service Portfolio
- Table 5.25 Medpace: Recent Developments and Future Outlook
- Table 5.26 QPS: Company Overview
- Table 5.27 QPS: Service Portfolio
- Table 5.28 QPS: Recent Developments and Future Outlook
- Table 5.29 Concept Life Sciences: Company Overview
- Table 5.30 Concept Life Sciences: Service Portfolio
- Table 5.31 Concept Life Sciences: Recent Developments and Future Outlook
- Table 5.32 Evotec: Company Overview
- Table 5.33 Evotec: Service Portfolio
- Table 5.34 Evotec: Recent Developments and Future Outlook
- Table 5.35 ChemPartner: Company Overview
- Table 5.36 ChemPartner: Service Portfolio
- Table 5.37 ChemPartner: Recent Developments and Future Outlook
- Table 5.38 Pharmaron: Company Overview
- Table 5.39 Pharmaron: Service Portfolio
- Table 5.40 Pharmaron: Recent Developments and Future Outlook
- Table 5.41 Syngene: Company Overview
- Table 5.42 Syngene: Service Portfolio
- Table 5.43 Syngene: Recent Developments and Future Outlook
- Table 5.44 Torrent Pharma: Company Overview
- Table 5.45 Torrent Pharma: Service Portfolio
- Table 5.46 Torrent Pharma: Recent Developments and Future Outlook
- Table 5.47 WuXi AppTec: Company Overview
- Table 5.48 WuXi AppTec: Service Portfolio
- Table 5.49 WuXi AppTec: Recent Developments and Future Outlook
- Table 7.1 Pharmaceutical Contract Research Service Providers: List of Partnerships and Collaborations
- Table 8.1 Mergers and Acquisitions: List of Mergers / Acquisitions, Since 2018
- Table 8.2 Mergers and Acquisitions: Information on Key Value Drivers, Since 2018
- Table 8.3 Mergers and Acquisitions: Deal Multiples, Since 2018
- Table 11.2 Biopharmaceutical Preclinical CROs: Information on Types of Services Offered
- Table 11.3 Biopharmaceutical Clinical CROs: Information on Types of Services Offered
- Table 12.1 ChemoGenics Biopharma: Key Highlights
- Table 14.1 Pharmaceutical Contract Research Service Providers: Distribution by Year of Establishment
- Table 14.2 Pharmaceutical Contract Research Service Providers: Distribution by Scale of Operation
- Table 14.3 Pharmaceutical Contract Research Service Providers: Distribution by Company Size
- Table 14.4 Pharmaceutical Contract Research Service Providers: Distribution by Location of Headquarters
- Table 14.5 World Map Representation: Analysis by Geography
- Table 14.6 Pharmaceutical Contract Research Service Providers: Distribution by Company Size and Scale of Operation
- Table 14.7 Pharmaceutical Contract Research Service Providers: Distribution by Types of Services Offered
- Table 14.9 Pharmaceutical Contract Research Service Providers: Distribution by Hit Identification Strategy Used
- Table 14.10 Pharmaceutical Contract Research Service Providers: Distribution by Type of Business Model
- Table 14.11 Pharmaceutical Contract Research Service Providers: Distribution by Target Therapeutic Area
- Table 14.12 Catalent Pharma: Annual Revenues, Since 2016 (USD Billion)
- Table 14.13 Charles River Laboratories: Annual Revenues, Since 2016 (USD Billion)
- Table 14.14 Covance: Annual Revenues, Since 2016 (USD Billion)
- Table 14.15 Medpace: Annual Revenues, Since 2016 (USD Billion)
- Table 14.16 Evotec: Annual Revenues, Since 2016 (EUR Million)
- Table 14.17 Syngene: Annual Revenues, Since 2016 (INR Billion)
- Table 14.18 Torrent Pharma: Annual Revenues, Since 2016 (INR Million)
- Table 14.19 WuXi AppTec: Annual Revenues, Since 2017 (RMB Billion)
- Table 14.20 Partnerships and Collaborations: Cumulative Year-wise Trend, Since 2018
- Table 14.21 Partnerships and Collaborations: Distribution by Type of Partnership
- Table 14.22 Partnerships and Collaborations: Distribution by Year and Type of Partnership
- Table 14.23 Partnerships and Collaborations: Distribution by Scale of Operation
- Table 14.24 Partnerships and Collaborations: Distribution by Target Therapeutic Area
- Table 14.25 Partnerships and Collaborations: Distribution by Year of Partnership and Type of Partner
- Table 14.26 Partnerships and Collaborations: Distribution by Type of Partnership and Type of Partner
- Table 14.27 Most Active Players: Distribution by Number of Partnerships
- Table 14.28 Partnerships and Collaborations: Regional Distribution
- Table 14.29 Partnerships and Collaborations: Intercontinental and Intracontinental Agreements
- Table 14.30 Mergers and Acquisitions: List of Mergers / Acquisitions, Since 2016
- Table 14.31 Mergers and Acquisitions: Information on Key Value Drivers, Since 2016
- Table 14.32 Mergers and Acquisitions: Deal Multiples, Since 2016
- Table 14.33 Global Pharmaceutical Contract Research Services Market, Till 2035 (USD Billion)
- Table 14.34 Global Pharmaceutical Contract Research Services Market, Till 2035: Distribution by Scale of Operation (USD Billion)
- Table 14.35 Global Pharmaceutical Contract Research Services Market for Discovery Services, Till 2035 (USD Billion)
- Table 14.36 Global Pharmaceutical Contract Research Services Market for Preclinical Services, Till 2035 (USD Billion)
- Table 14.37 Global Pharmaceutical Contract Research Services Market for Clinical Stage Services, Till 2035 (USD Billion)
- Table 14.38 Global Pharmaceutical Contract Research Services Market, Till 2035: Distribution by Target Therapeutic Area (USD Billion)
- Table 14.39 Global Pharmaceutical Contract Research Services Market for Oncological Disorders, Till 2035 (USD Billion)
- Table 14.40 Global Pharmaceutical Contract Research Services Market for Infectious Diseases, Till 2035 (USD Billion)
- Table 14.41 Global Pharmaceutical Contract Research Services Market for Neurological Disorders, Till 2035 (USD Billion)
- Table 14.42 Global Pharmaceutical Contract Research Services Market for Inflammatory Disorders, Till 2035 (USD Billion)
- Table 14.43 Global Pharmaceutical Contract Research Services Market for Cardiovascular Disorders, Till 2035 (USD Billion)
- Table 14.44 Global Pharmaceutical Contract Research Services Market for Dermatological Disorders, Till 2035 (USD Billion)
- Table 14.45 Global Pharmaceutical Contract Research Services Market for Ophthalmological Disorders, Till 2035 (USD Billion)
- Table 14.46 Global Pharmaceutical Contract Research Services Market for Respiratory Disorders, Till 2035 (USD Billion)
- Table 14.47 Global Pharmaceutical Contract Research Services Market for Other Disorders, Till 2035 (USD Billion)
- Table 14.48 Global Pharmaceutical Contract Research Services Market, Till 2035: Distribution by Geography (USD Billion)
- Table 14.49 Global Pharmaceutical Contract Research Services Market in North America, Till 2035 (USD Billion)
- Table 14.50 Global Pharmaceutical Contract Research Services Market in Europe, Till 2035 (USD Billion)
- Table 14.51 Global Pharmaceutical Contract Research Services Market in Asia-Pacific, Till 2035 (USD Billion)
- Table 14.52 Global Pharmaceutical Contract Research Services Market in Middle East and North Africa, Till 2035 (USD Billion)
- Table 14.53 Global Pharmaceutical Contract Research Services Market in Latin America, Till 2035 (USD Billion)
- Table 14.54 Total Cost of Ownership in Pharmaceutical Contract Research Organization: Output
- Table 14.55 Biopharmaceutical CROs: Distribution by Year of Establishment, Company Size and Location of Headquarters
- Table 14.56 Biopharmaceutical CROs: Distribution by Scale of Operation
- Table 14.57 Biopharmaceutical Preclinical CROs: Distribution by Year of Establishment
- Table 14.58 Biopharmaceutical Preclinical CROs: Distribution by Company Size
- Table 14.59 Biopharmaceutical Preclinical CROs Distribution by Location of Headquarters
- Table 14.60 Biopharmaceutical Preclinical CROs: Distribution by Types of Biologics
- Table 14.61 Biopharmaceutical Preclinical CROs: Distribution by Types of Services Offered
- Table 14.62 Biopharmaceutical Preclinical CROs: Distribution by Number of Services Offered
- Table 14.63 Biopharmaceutical Preclinical CROs: Distribution by Types of Biologics and Types of Services Offered
- Table 14.64 Biopharmaceutical Clinical CROs: Distribution by Year of Establishment
- Table 14.65 Biopharmaceutical Clinical CROs: Distribution by Company Size
- Table 14.66 Biopharmaceutical Clinical CROs: Distribution by Location of Headquarters
- Table 14.67 Biopharmaceutical Clinical CROs: Distribution by Types of Biologics
- Table 14.68 Biopharmaceutical Clinical CROs: Distribution by Types of Services Offered
- Table 14.69 Biopharmaceutical Clinical CROs: Distribution by Number of Services Offered
- Table 14.70 Biopharmaceutical Clinical CROs: Distribution by Types of Biologics and Types of Services Offered
List of Figures
- Figure 3.1 Drug Discovery and Development Pipeline
- Figure 3.2 Drug Discovery Process
- Figure 3.3 Guidelines for Selecting a Contract Research Service Provider
- Figure 4.1 Pharmaceutical Contract Research Service Providers: Distribution by Year of Establishment
- Figure 4.2 Pharmaceutical Contract Research Service Providers: Distribution by Company Size
- Figure 4.3 Pharmaceutical Contract Research Service Providers: Distribution by Scale of Operation
- Figure 4.4 Pharmaceutical Contract Research Service Providers: Distribution by Location of Headquarters
- Figure 4.5 World Map Representation: Analysis by Geography
- Figure 4.6 Pharmaceutical Contract Research Service Providers: Distribution by Company Size and Scale of Operation
- Figure 4.7 Pharmaceutical Contract Research Service Providers: Distribution by Types of Services Offered
- Figure 4.8 Pharmaceutical Contract Research Service Providers: Distribution by Location of Headquarters and Types of Services Offered
- Figure 4.9 Pharmaceutical Contract Research Service Providers: Distribution by Hit Identification Strategy Used
- Figure 4.10 Pharmaceutical Contract Research Service Providers: Distribution by Type of Business Model
- Figure 4.11 Pharmaceutical Contract Research Service Providers: Distribution by Target Therapeutic Area
- Figure 5.1 Catalent Pharma: Annual Revenues, Since 2016 (USD Billion)
- Figure 5.2 Charles River Laboratories: Annual Revenues, Since 2016 (USD Billion)
- Figure 5.3 Covance: Annual Revenues, Since 2016 (USD Billion)
- Figure 5.4 Medpace: Annual Revenues, Since 2016 (USD Billion)
- Figure 5.5 Evotec: Annual Revenues, Since 2016 (EUR Million)
- Figure 5.6 Syngene: Annual Revenues, Since 2016 (INR Billion)
- Figure 5.7 Torrent Pharma: Annual Revenues, Since 2016 (INR Million)
- Figure 5.8 WuXi AppTec: Annual Revenues, Since 2017 (RMB Billion)
- Figure 6.1 Company Competitiveness Analysis: Pharmaceutical Contract Research Service Providers based in North America
- Figure 6.2 Company Competitiveness Analysis: Pharmaceutical Contract Research Service Providers based in Europe
- Figure 6.3 Company Competitiveness Analysis: Pharmaceutical Contract Research Service Providers based in Asia Pacific and Rest of the World
- Figure 7.1 Partnerships and Collaborations: Cumulative Year-wise Trend, Since 2018
- Figure 7.2 Partnerships and Collaborations: Distribution by Type of Partnership
- Figure 7.3 Partnerships and Collaborations: Distribution by Year and Type of Partnership
- Figure 7.4 Partnerships and Collaborations: Distribution by Scale of Operation
- Figure 7.5 Partnerships and Collaborations: Distribution by Target Therapeutic Area
- Figure 7.6 Partnerships and Collaborations: Distribution by Year of Partnership and Type of Partner
- Figure 7.7 Partnerships and Collaborations: Distribution by Type of Partnership and Type of Partner
- Figure 7.8 Most Active Players: Distribution by Number of Partnerships
- Figure 7.9 Partnerships and Collaborations: Regional Distribution
- Figure 7.10 Partnerships and Collaborations: Intercontinental and Intracontinental Agreements
- Figure 8.1 Mergers and Acquisitions: Distribution by Year of Merger / Acquisition Since 2018
- Figure 8.2 Mergers and Acquisitions: Distribution by Type of Merger / Acquisition
- Figure 8.3 Mergers and Acquisitions: Distribution by Year and Type of Merger / Acquisition
- Figure 8.4 Mergers and Acquisitions: Continent-wise Distribution
- Figure 8.5 Mergers and Acquisitions: Region-wise Distribution
- Figure 8.6 Mergers and Acquisitions: Country-wise Distribution
- Figure 8.7 Mergers and Acquisitions: Ownership Change Matrix
- Figure 8.8 Mergers and Acquisitions: Key Value Drivers
- Figure 8.9 Mergers and Acquisitions: Distribution by Year of Acquisition and Key Value Drivers
- Figure 8.10 Mergers and Acquisitions: Deal Multiples Based on Revenue
- Figure 8.11 Mergers and Acquisitions: Deal Multiples Based on Year of Experience
- Figure 9.1 Global Pharmaceutical Contract Research Services Market, Till 2035 (USD Billion)
- Figure 9.2 Global Pharmaceutical Contract Research Services Market, Till 2035: Distribution by Scale of Operation (USD Billion)
- Figure 9.3 Global Pharmaceutical Contract Research Services Market for Discovery Services, Till 2035 (USD Billion)
- Figure 9.4 Global Pharmaceutical Contract Research Services Market for Preclinical Services, Till 2035 (USD Billion)
- Figure 9.5 Global Pharmaceutical Contract Research Services Market for Clinical Stage Services, Till 2035 (USD Billion)
- Figure 9.6 Global Pharmaceutical Contract Research Services Market, Till 2035: Distribution by Target Therapeutic Area (USD Billion)
- Figure 9.7 Global Pharmaceutical Contract Research Services Market for Oncological Disorders, Till 2035 (USD Billion)
- Figure 9.8 Global Pharmaceutical Contract Research Services Market for Infectious Diseases, Till 2035 (USD Billion)
- Figure 9.9 Global Pharmaceutical Contract Research Services Market for Neurological Disorders, Till 2035 (USD Billion)
- Figure 9.10 Global Pharmaceutical Contract Research Services Market for Inflammatory Disorders, Till 2035 (USD Billion)
- Figure 9.11 Global Pharmaceutical Contract Research Services Market for Cardiovascular Disorders, Till 2035 (USD Billion)
- Figure 9.12 Global Pharmaceutical Contract Research Services Market for Dermatological Disorders, Till 2035 (USD Billion)
- Figure 9.13 Global Pharmaceutical Contract Research Services Market for Ophthalmological Diseases, Till 2035 (USD Billion)
- Figure 9.14 Global Pharmaceutical Contract Research Services Market for Respiratory Disorders, Till 2035 (USD Billion)
- Figure 9.15 Global Pharmaceutical Contract Research Services Market for Other Disorders, Till 2035 (USD Billion)
- Figure 9.16 Global Pharmaceutical Contract Research Services Market, Till 2035: Distribution by Geography (USD Billion)
- Figure 9.17 Global Pharmaceutical Contract Research Services Market in North America, Till 2035 (USD Billion)
- Figure 9.18 Global Pharmaceutical Contract Research Services Market in Europe, Till 2035 (USD Billion)
- Figure 9.19 Global Pharmaceutical Contract Research Services Market in Asia-Pacific, Till 2035 (USD Billion)
- Figure 9.20 Global Pharmaceutical Contract Research Services Market in Middle East and North Africa, Till 2035 (USD Billion)
- Figure 9.21 Global Pharmaceutical Contract Research Services Market in Latin America, Till 2035 (USD Billion)
- Figure 10.1 Total Cost of Ownership in Pharmaceutical Contract Research Organization: Output
- Figure 11.1 Biopharmaceutical CROs: Distribution by Year of Establishment, Company Size and Location of Headquarters
- Figure 11.2 Biopharmaceutical CROs: Distribution by Scale of Operation
- Figure 11.3 Biopharmaceutical Preclinical CROs: Distribution by Year of Establishment
- Figure 11.4 Biopharmaceutical Preclinical CROs: Distribution by Company Size
- Figure 11.5 Biopharmaceutical Preclinical CROs Distribution by Location of Headquarters
- Figure 11.6 Biopharmaceutical Preclinical CROs: Distribution by Types of Biologics
- Figure 11.7 Biopharmaceutical Preclinical CROs: Distribution by Types of Services Offered
- Figure 11.8 Biopharmaceutical Preclinical CROs: Distribution by Number of Services Offered
- Figure 11.9 Biopharmaceutical Preclinical CROs: Distribution by Types of Biologics and Types of Services Offered
- Figure 11.10 Biopharmaceutical Clinical CROs: Distribution by Year of Establishment
- Figure 11.11 Biopharmaceutical Clinical CROs: Distribution by Company Size
- Figure 11.12 Biopharmaceutical Clinical CROs: Distribution by Location of Headquarters
- Figure 11.13 Biopharmaceutical Clinical CROs: Distribution by Types of Biologics
- Figure 11.14 Biopharmaceutical Clinical CROs: Distribution by Types of Services Offered
- Figure 11.15 Biopharmaceutical Clinical CROs: Distribution by Number of Services Offered
- Figure 11.16 Biopharmaceutical Clinical CROs: Distribution by Types of Biologics and Types of Services Offered
- Figure 13.1 Concluding Remarks: Overall Market Landscape
- Figure 13.2 Concluding Remarks: Partnerships and Collaborations
- Figure 13.3 Concluding Remarks: Mergers and Acquisitions
- Figure 13.4 Concluding Remarks: Market Forecast
- Figure 13.5 Concluding Remarks: Total Cost of Ownership in Pharmaceutical Contract Research Organization
PHARMA CONTRACT RESEARCH ORGANIZATION (CRO) SERVICES MARKET: OVERVIEW
As per Roots Analysis, the global pharma contract research organization (CRO) services market valued at USD 25 billion in the current year is anticipated to grow at a lucrative CAGR of 10% during the forecast period.
The market sizing and opportunity analysis has been segmented across the following parameters:
Scale of Operation
- Discovery Services
- Preclinical Services
- Clinical Stage Services
Target Therapeutic Area
- Cardiovascular Disorders
- Dermatological Disorders
- Infectious Disorders
- Inflammatory Disorders
- Neurological Disorders
- Oncological Disorders
- Ophthalmological Disorders
- Respiratory Disorders
- Other Disorders
Key Geographies
- North America
- Europe
- Asia- Pacific
- Latin America
- Middle East and North Africa
- Rest of the World
PHARMA CONTRACT RESEARCH ORGANIZATION (CRO) SERVICES MARKET: GROWTH AND TRENDS
The overall drug development process starts from identifying a promising pharmacological candidate to bringing a clinically approved product to market. This entire process spans around 10 to 15 years. Additionally, both clinical research and drug discovery demand substantial financial resources, with average investments ranging from USD 4 to 10 billion. Therefore, owing to the prohibitive capital investments and complex infrastructure requirements for drug discovery and development, the innovators are increasingly relying on the pharmaceutical contract research service providers.
The rising trend of outsourcing in the pharmaceuticals market can be attributed to the variety of services offered by CROs, and their ability to optimize the clinical research timeline. Moreover, CROs provide several benefits including customized services, reduced costs and access to advanced technologies that have prompted a number of pharmaceutical companies to outsource their research operations. Further, as the demand for novel therapeutics continues to evolve, CROs are expected to navigate through the emerging trends, such as customized services and personalized medicine.
PHARMA CONTRACT RESEARCH ORGANIZATION (CRO) SERVICES MARKET: KEY INSIGHTS
The report delves into the current state of the global pharma contract research organization (CRO) services market and identifies potential growth opportunities within industry. Some key findings from the report include:
- Presently, several industry players claim to have the necessary capabilities to provide a wide range of contract research services and clinical trial support for a variety of pharmaceutical interventions.
- The market is fragmented, featuring the presence of both established players and small firms that offer contract research services, encompassing multiple therapeutic areas and at different scales of operation.
- More than 40% of players were established post 2010; examples of such companies include Assay.Works, Celerion, Concept Life Sciences, Molecular Forecaster and ProRelix Research.
- Majority of the stakeholders offer services for research and development of small molecule pharmacological interventions for the treatment of various oncological, neurological and cardiovascular disorders.
- Amongst the various clinical research services, companies primarily offer support for clinical trial management, medical writing, pharmacovigilance studies, biostatistics and data management services.
- To cater to the evolving clinical research-related needs of clients / sponsors, stakeholders have established their presence in both developed and developing regions of the world.
- In pursuit of gaining a competitive edge, service providers are actively upgrading their existing capabilities and adding new competencies in order to augment their respective portfolios and comply to existing benchmarks.
- The rising interest of stakeholders in this domain is also reflected in the increase in partnerships; since 2018, industry players have entered into multiple strategic agreements with CROs.
- The partnership activity has increased at a CAGR of 15% during the given time period; majority of the instances were related to acquisition of companies.
- In the past, both established players and new entrants have forged multiple strategic partnerships for oncological and neurological disorders.
- Established players in North America and Europe are actively consolidating their presence in the market through strategic acquisitions; portfolio and geographical expansion are amongst the key value drivers.
- The current biopharmaceutical CRO market landscape is a growing opportunity area, well served via well-established players and specialty service providers.
- More than two-thirds of the contract research service providers are based in North America and Europe; most of these players are small and mid-sized companies.
- Close to 20% of the CROs provide research services for biologics at the clinical and preclinical scales; examples include Alliance Pharma, and Covance.
- About 50% of the overall players offer only clinical services; of these, 12% CROs provide all the services associated with clinical research of biologics.
- Our proprietary total cost of ownership model suggests an informed estimate of direct and indirect expenses while setting up a contract research facility in different regions over a span of 20 years.
- The pharmaceutical CROs market is projected to grow at an annualized rate of 10% and the opportunity is expected to be well distributed across different scales of operation, therapeutic areas and key geographies.
Example Players in the Pharma Contract Research Organization (CRO) Services Market
- Albany Molecular Research (AMRI)
- BioDuro
- BOC Sciences
- Catalent Pharma
- Charles River Laboratories
- ChemDiv
- Covance
- Medpace
- QPS
- Concept Life Sciences
- Evotec
- ChemPartner
- Pharmaron
- Syngene
- Torrent Pharma
- WuXi AppTec
PHARMA CONTRACT RESEARCH ORGANIZATION (CRO) SERVICES MARKET: RESEARCH COVERAGE
- Market Sizing and Opportunity Analysis: The report features an in-depth analysis of the pharma contract research organization (CRO) services market, focusing on key market segments, including [A] scale of operation, [B] target therapeutic area and [C] key geographies.
- Market Landscape: A comprehensive evaluation of the companies offering pharmaceutical contract research services, based on several relevant parameters, such as [A] year of establishment, [B] company size, [C] scale of operation, [D] location of headquarters, [E] type(s) of services offered, [F] hit identification strategy used, [G] type of business model and [H] target therapeutic area.
- Company Profiles: In-depth profiles of the pharma CRO companies offering pharmaceutical related services, focusing on [A] overview of the company, [B] financial information (if available), [C] service portfolio and [D] recent developments and an informed future outlook.
- Company Competitiveness Analysis: A comprehensive competitive analysis of pharma CRO companies, examining factors, such as [A] supplier strength and [B] service strength.
- Partnerships and Collaborations: An insightful analysis of the deals inked by stakeholders in the pharma CRO market, based on several parameters, such as [A] year of agreement, [B] type of agreement, [C] scale of operation and [D] target therapeutic area.
- Mergers and Acquisitions: An in-depth analysis of the mergers and acquisitions undertaken in this domain, based on relevant parameters, such as [A] year of acquisition, [B] type of collaboration and [C] geographical location of the companies.
- Total Cost of Ownership in Pharmaceutical Contract Research Organization: An insightful analysis of the total cost of ownership for a pharmaceutical CRO. It features an informed estimate of direct and indirect costs taking into consideration close to 100 relevant parameters over a span of 20 years.
- Case Study: A detailed discussion on current market landscape of biopharmaceutical CROs, including information on the [A] year of establishment, [B] company size, [C] scale of operation and [D] type of services offered.
KEY QUESTIONS ANSWERED IN THIS REPORT
- How many companies are currently engaged in this market?
- Which are the leading companies in this market?
- What factors are likely to influence the evolution of this market?
- What is the current and future market size?
- What is the CAGR of this market?
- How is the current and future market opportunity likely to be distributed across key market segments?
REASONS TO BUY THIS REPORT
- The report provides a comprehensive market analysis, offering detailed revenue projections of the overall market and its specific sub-segments. This information is valuable to both established market leaders and emerging entrants.
- Stakeholders can leverage the report to gain a deeper understanding of the competitive dynamics within the market. By analyzing the competitive landscape, businesses can make informed decisions to optimize their market positioning and develop effective go-to-market strategies.
- The report offers stakeholders a comprehensive overview of the market, including key drivers, barriers, opportunities, and challenges. This information empowers stakeholders to stay abreast of market trends and make data-driven decisions to capitalize on growth prospects.
ADDITIONAL BENEFITS
- Complimentary PPT Insights Packs
- Complimentary Excel Data Packs for all Analytical Modules in the Report
- 15% Free Content Customization
- Detailed Report Walkthrough Session with Research Team
- Free Updated report if the report is 6-12 months old or older
TABLE OF CONTENTS
1. PREFACE
- 1.1. Scope of the Report
- 1.2. Research Methodology
- 1.2.1. Research Assumptions
- 1.2.2. Project Methodology
- 1.2.3. Forecast Methodology
- 1.2.4. Robust Quality Control
- 1.2.5. Key Considerations
- 1.2.5.1. Demographics
- 1.2.5.2. Economic Factors
- 1.2.5.3. Government Regulations
- 1.2.5.4. Supply Chain
- 1.2.5.5. COVID Impact / Related Factors
- 1.2.5.6. Market Access
- 1.2.5.7. Healthcare Policies
- 1.2.5.8. Industry Consolidation
- 1.3 Key Questions Answered
- 1.4. Chapter Outlines
2. EXECUTIVE SUMMARY
3. INTRODUCTION
- 3.1. Chapter Overview
- 3.2. Overview of Drug Development
- 3.3. Drug Discovery Process
- 3.3.1. Target Identification
- 3.3.2. Target Discovery and Validation
- 3.3.3. Hit Generation
- 3.3.3.1. High-Throughput Screening
- 3.3.3.2. Fragment-based Screening
- 3.3.3.3. Virtual Screening
- 3.3.3.4. DNA-Encoded Libraries Screening
- 3.3.4. Hit-to-Lead and Lead Generation
- 3.3.5. Lead Optimization
- 3.4. Challenges Associated with Small Molecule Discovery
- 3.5. Need for Outsourcing Drug Discovery Operations
- 3.6. Guidelines for Selecting a Contract Research Service Provider
- 3.7. Concluding Remarks
4. PHARMACEUTICAL CONTRACT RESEARCH SERVICE PROVIDERS: MARKET LANDSCAPE
- 4.1. Chapter Overview
- 4.2. Pharmaceutical Contract Research Service Providers: List of Industry Players
- 4.2.1. Analysis by Year of Establishment
- 4.2.2. Analysis by Company Size
- 4.2.3. Analysis by Scale of Operation
- 4.2.4. Analysis by Location of Headquarters
- 4.2.5. Analysis by Company Size and Scale of Operation
- 4.2.6. Analysis by Types of Services Offered
- 4.2.7. Analysis by Location of Headquarters and Types of Services Offered
- 4.2.8. Analysis by Hit Identification Strategy Used
- 4.2.9. Analysis by Type of Business Model
- 4.2.10. Analysis by Target Therapeutic Area
5. COMPANY PROFILES
- 5.1. Chapter Overview
- 5.2. Pharmaceutical Contract Research Service Providers in North America
- 5.2.1. Albany Molecular Research (AMRI)
- 5.2.1.1. Company Overview
- 5.2.1.2. Financial Information
- 5.2.1.3. Service Portfolio
- 5.2.1.4. Recent Developments and Future Outlook
- 5.2.2. BioDuro
- 5.2.2.1. Company Overview
- 5.2.2.2. Service Portfolio
- 5.2.2.3. Recent Developments and Future Outlook
- 5.2.3. BOC Sciences
- 5.2.3.1. Company Overview
- 5.2.3.2. Service Portfolio
- 5.2.3.3. Recent Developments and Future Outlook
- 5.2.4. Catalent Pharma
- 5.2.4.1. Company Overview
- 5.2.4.2. Financial Information
- 5.2.4.3. Service Portfolio
- 5.2.4.4. Recent Developments and Future Outlook
- 5.2.5. Charles River Laboratories
- 5.2.5.1. Company Overview
- 5.2.5.2. Financial Information
- 5.2.5.3. Service Portfolio
- 5.2.5.4. Recent Developments and Future Outlook
- 5.2.6. ChemDiv
- 5.2.6.1. Company Overview
- 5.2.6.2. Service Portfolio
- 5.2.6.3. Recent Developments and Future Outlook
- 5.2.7. Covance
- 5.2.7.1. Company Overview
- 5.2.7.2. Financial Information
- 5.2.7.3. Service Portfolio
- 5.2.7.4. Recent Developments and Future Outlook
- 5.2.8. Medpace
- 5.2.8.1. Company Overview
- 5.2.8.2. Financial Information
- 5.2.8.3. Service Portfolio
- 5.2.8.4. Recent Developments and Future Outlook
- 5.2.9. QPS
- 5.2.9.1. Company Overview
- 5.2.9.2. Service Portfolio
- 5.2.9.3. Recent Developments and Future Outlook
- 5.2.1. Albany Molecular Research (AMRI)
- 5.3. Pharmaceutical Contract Research Service Providers in Europe
- 5.3.1. Concept Life Sciences
- 5.3.1.1. Company Overview
- 5.3.1.2. Service Portfolio
- 5.3.1.3. Recent Developments and Future Outlook
- 5.3.2. Evotec
- 5.3.2.1. Company Overview
- 5.3.2.2. Financial Information
- 5.3.2.3. Service Portfolio
- 5.3.2.4. Recent Developments and Future Outlook
- 5.3.1. Concept Life Sciences
- 5.4. Pharmaceutical Contract Research Service Providers in Asia-Pacific
- 5.4.1. ChemPartner
- 5.4.1.1. Company Overview
- 5.4.1.2. Financial Information
- 5.4.1.3. Service Portfolio
- 5.4.1.4. Recent Developments and Future Outlook
- 5.4.2. Pharmaron
- 5.4.2.1. Company Overview
- 5.4.2.2. Service Portfolio
- 5.4.2.3. Recent Developments and Future Outlook
- 5.4.3. Syngene
- 5.4.3.1. Company Overview
- 5.4.3.2. Financial Information
- 5.4.3.3. Service Portfolio
- 5.4.3.4. Recent Developments and Future Outlook
- 5.4.4. Torrent Pharma
- 5.4.4.1. Company Overview
- 5.4.4.2. Financial Information
- 5.4.4.3. Service Portfolio
- 5.4.4.4. Recent Developments and Future Outlook
- 5.4.5. WuXi AppTec
- 5.4.5.1. Company Overview
- 5.4.5.2. Financial Information
- 5.4.5.3. Service Portfolio
- 5.4.5.4. Recent Developments and Future Outlook
- 5.4.1. ChemPartner
6. COMPANY COMPETITIVENESS ANALYSIS
- 6.1. Chapter Overview
- 6.2. Methodology
- 6.3. Key Parameters
- 6.4. Company Competitiveness Analysis: Pharmaceutical Contract Research Service Providers
- 6.4.1. Pharmaceutical Contract Research Service Providers based in North America
- 6.4.2. Pharmaceutical Contract Research Service Providers based in Europe
- 6.4.3. Pharmaceutical Contract Research Service Providers based in Asia- Pacific and Rest of the World
7. PARTNERSHIPS AND COLLABORATIONS
- 7.1. Chapter Overview
- 7.2. Partnership Models
- 7.3. Pharmaceutical Contract Research Service Providers: List of Partnerships and Collaborations
- 7.3.1. Analysis by Year of Partnership
- 7.3.2. Analysis by Type of Partnership
- 7.3.3. Analysis by Scale of Operation
- 7.3.4. Analysis by Target Therapeutic Area
- 7.3.5. Analysis by Year of Partnership and Type of Partner
- 7.3.6. Analysis by Type of Partnership and Type of Partner
- 7.3.7. Most Active Players: Analysis by Number of Partnerships
- 7.3.8. Regional Analysis
- 7.3.8.1. Intercontinental and Intracontinental Agreements
8. MERGERS AND ACQUISITIONS
- 8.1. Chapter Overview
- 8.2. Merger and Acquisition Models
- 8.3. Pharmaceutical Contract Research Service Providers: Mergers and Acquisitions
- 8.3.1. Analysis by Year of Acquisition
- 8.3.2. Analysis by Geography
- 8.3.3. Intercontinental and Intracontinental Deals
- 8.4. Analysis by Key Value Drivers
- 8.4.1. Mergers and Acquisitions: Analysis by Key Value Drivers
- 8.5. Valuation Analysis: Acquisition Deal Multiples
- 8.5.1. Prominent Acquirers: Analysis by Number of Acquisitions
9. MARKET FORECAST AND OPPORTUNITY ANALYSIS
- 9.1. Chapter Overview
- 9.2. Forecast Methodology and Key Assumptions
- 9.3. Global Pharmaceutical Contract Research Service Providers Market, Till 2035
- 9.4. Global Pharmaceutical Contract Research Service Providers Market, Till 2035: Distribution by Scale of Operation
- 9.4.1. Global Pharmaceutical Contract Research Service Providers Market for Discovery Services, Till 2035
- 9.4.2. Global Pharmaceutical Contract Research Service Providers Market for Preclinical Services, Till 2035
- 9.4.3. Global Pharmaceutical Contract Research Service Providers Market for Clinical Services, Till 2035
- 9.5. Global Pharmaceutical Contract Research Service Providers Market, Till 2035: Distribution by Target Therapeutic Area
- 9.5.1. Global Pharmaceutical Contract Research Service Providers Market for Oncological Disorders, Till 2035
- 9.5.2. Global Pharmaceutical Contract Research Service Providers Market for Infectious Diseases, Till 2035
- 9.5.3. Global Pharmaceutical Contract Research Service Providers Market for Neurological Disorders, Till 2035
- 9.5.4. Global Pharmaceutical Contract Research Service Providers Market for Inflammatory Disorders, Till 2035
- 9.5.5. Global Pharmaceutical Contract Research Service Providers Market for Cardiovascular Disorders, Till 2035
- 9.5.6. Global Pharmaceutical Contract Research Service Providers Market for Dermatological Disorders, Till 2035
- 9.5.7. Global Pharmaceutical Contract Research Service Providers Market for Ophthalmological Diseases, Till 2035
- 9.5.8. Global Pharmaceutical Contract Research Service Providers Market for Respiratory Disorders, Till 2035
- 9.5.9. Global Pharmaceutical Contract Research Service Providers Market for Other Disorders, Till 2035
- 9.6. Global Pharmaceutical Contract Research Service Providers Market, Till 2035: Distribution by Region
- 9.6.1. Pharmaceutical Contract Research Service Providers Market in North America, Till 2035
- 9.6.2. Pharmaceutical Contract Research Service Providers Market in Europe, Till 2035
- 9.6.3. Pharmaceutical Contract Research Service Providers Market in Asia-Pacific, Till 2035
- 9.6.4. Pharmaceutical Contract Research Service Providers Market in Middle East, Till 2035
- 9.6.5. Pharmaceutical Contract Research Service Providers Market in Latin America, Till 2035
10. TOTAL COST OF OWNERSHIP IN PHARMACEUTICAL CONTRACT RESEARCH ORGANIZATION
- 10.1. Chapter Overview
- 10.2. Key Assumptions and Methodology
- 10.3. Output
11. CASE STUDY: BIOPHARMACEUTICAL CONTRACT RESEARCH SERVICES MARKET
- 11.1. Chapter Overview
- 11.2. Biopharmaceutical CROs: Overall Market Landscape
- 11.2.1. Analysis by Year of Establishment, Company Size and Location of Headquarters
- 11.2.2. Analysis by Scale of Operation
- 11.3. Preclinical Biopharmaceutical CROs
- 11.3.1. Analysis by Year of Establishment
- 11.3.2. Analysis by Company Size
- 11.3.3. Analysis by Location of Headquarters
- 11.3.4. Analysis by Type of Biologic
- 11.3.5. Analysis by Type of Services Offered
- 11.4. Clinical Biopharmaceutical CROs
- 11.4.1. Analysis by Year of Establishment
- 11.4.2. Analysis by Company Size
- 11.4.3. Analysis by Location of Headquarters
- 11.4.4. Analysis by Type of Biologics
- 11.4.5. Analysis by Type of Services Offered
12. EXECUTIVE INSIGHTS
- 12.1. Chapter Overview
- 12.2. Company A
- 12.2.1. Company Snapshot
- 12.2.2. Interview Transcript: Founder and Chief Executive Officer
