
|
市場調査レポート
商品コード
1737054
バイオリアクターおよび発酵槽市場:製品タイプ別、製造材料別、バイオプロセスタイプ別、生物製剤タイプ別、主要地域別Bioreactors and Fermenters Market Distribution by Type of Product, Fabrication Material, Type of Bioprocess, Type of Biologic and Key Geographical Regions |
||||||
カスタマイズ可能
|
|||||||
| バイオリアクターおよび発酵槽市場:製品タイプ別、製造材料別、バイオプロセスタイプ別、生物製剤タイプ別、主要地域別 |
|
出版日: 2025年05月26日
発行: Roots Analysis
ページ情報: 英文 261 Pages
納期: 即日から翌営業日
|

全表示
- 概要
- 図表
- 目次
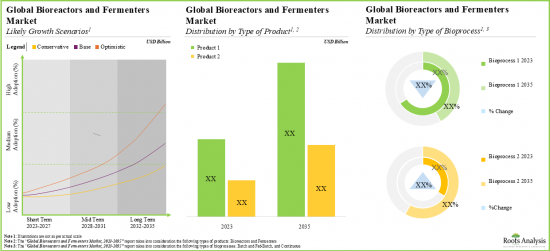
世界のバイオリアクターおよび発酵槽の市場規模は、2035年までの予測期間中に11.1%のCAGRで拡大し、現在の232億米ドルから2035年までに739億米ドルに成長すると予測されています。
この市場セグメンテーションでは、市場規模および機会分析を以下のパラメータで区分しています:
製品タイプ別
- バイオリアクター
- 発酵槽
製造材料別
- ガラス
- ステンレス
- シングルユース
バイオプロセスタイプ別/p>
- バッチおよびフェドバッチ
- 連続
生物製剤タイプ別
- 抗体
- ワクチン
- 細胞治療薬
- その他
主な地域
- 北米
- 欧州
- アジア太平洋
- 中東・北アフリカ
- ラテンアメリカ
バイオリアクターおよび発酵槽市場:成長と動向
バイオリアクターおよび発酵槽は、組換えタンパク質、組織工学的構築物、in vitro細胞ベースモデルなどの高価値製品を生産するために必要な条件を提供することにより、生物製造の上流において不可欠な役割を果たしています。バイオリアクターによる細胞培養技術は、20世紀初頭に開発されました。このような装置の使用法と拡張性は、新規の生物学的産物に対する需要の増大とともに発展してきました。実際、ワクチン、融合タンパク質、抗体、ホルモン、インターロイキン、インターフェロン、酵素、先進治療薬(ATMP)などの様々な治療に対する需要の高まりに対応するため、バイオ製薬会社、CMO、非業界企業はバイオリアクターに多大な投資を行ってきました。
バイオリアクターとは対照的に、発酵槽は微生物(真菌または細菌)細胞集団の嫌気的培養に使用され、翻訳後の大幅な修飾を必要としない生物製剤を生産します。バイオ医薬品市場、特にCOVID-19パンデミック後の全体的な成長は、バイオリアクターを含む高度な上流バイオプロセス技術に対する需要の上昇につながり、装置メーカーに有利な機会を提供しています。
バイオリアクターおよび発酵槽市場:主要インサイト
当レポートでは、バイオリアクターおよび発酵槽市場の現状を掘り下げ、業界内の潜在的な成長機会を特定しています。主な調査結果は以下の通り:
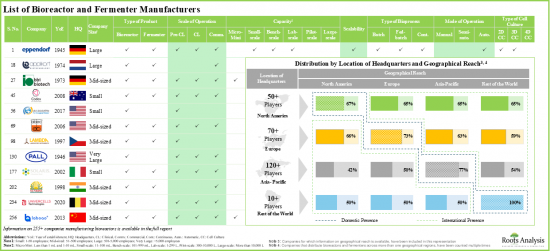
- 現在、255社以上の企業が、世界中で様々なタイプのバイオリアクターおよび発酵槽を製造するために必要な専門知識を持っています。
- 現在の市場情勢は、様々な容量範囲と操作モードのバイオリアクターおよび発酵槽の製造に従事する既存企業と新興企業の両方の存在を特徴としています。
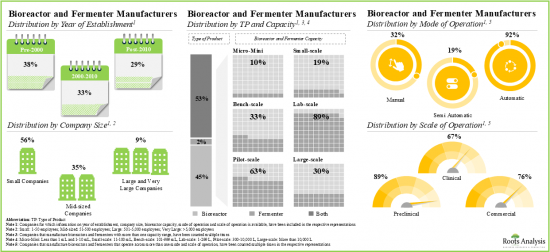
- 企業の80%近くが、バッチプロセス用のバイオリアクターおよび発酵槽を製造しており、このうち55%のメーカーは、実験室規模から商業規模に装置をスケールアップする能力を持っています。
- バイオリアクターおよび発酵槽の市場環境は断片化されており、老舗企業の大半は新興国市場に所在しているが、小規模企業の大半はアジア太平洋地域に所在しています。
- 複雑な生物製剤に対する需要の増加により、新規のバイオリアクターおよび発酵槽に対する要求が高まっており、バイオリアクターおよび発酵槽メーカーはその能力をアップグレードするよう求められています。
- 世界のバイオリアクターおよび発酵槽の設置能力は様々な地域に分散しており、この能力の60%以上は生物製剤メーカーの社内施設に設置されています。
- ステンレス製バイオリアクターは、現在設置されている生物製剤製造能力の中で大きなシェアを占めており、このシェアの大部分は、哺乳類および微生物ベースの治療薬の製造に使用されています。
- バイオリアクターおよび発酵槽の世界市場は、2035年までCAGR 11.1%で成長すると見られています。
- 長期的には、抗体やその他の新規生物製剤の製造に使用される使い捨て/シングルユースシステムが、市場全体の主要成長要因として浮上する可能性が高いです。
バイオリアクターおよび発酵槽市場:主要セグメント
製品のタイプ別では、市場はバイオリアクターおよび発酵槽に区分されます。現在、バイオリアクターセグメントが世界のバイオリアクターおよび発酵槽市場で最大シェアを占めています。さらに、発酵槽セグメントは予測期間中により速いペースで成長すると思われます。
製造材料別では、市場はガラス、ステンレススチール、シングルユースバイオリアクターに区分されます。現在、ステンレス製バイオリアクターセグメントが世界のバイオリアクターおよび発酵槽市場で最も高い割合を占めています。さらに、シングルユース・バイオリアクターのバイオリアクターおよび発酵槽市場は、エネルギーと水の総消費量を~50%削減し、バッチ生産ごとに洗浄・滅菌工程を省くことで~40%のコスト削減を実現するなど、いくつかの利点があるため、相対的に高いCAGRで成長する可能性が高いです。
バイオプロセスタイプ別では、市場はバッチ式とフェドバッチ式、連続式に区分されます。現在、バッチ式と供給バッチ式で使用されるバイオリアクターがバイオリアクターおよび発酵槽市場で最大のシェアを占めています。さらに、連続タイプのバイオプロセス分野のバイオリアクターおよび発酵槽市場は、比較的高いCAGRで成長する可能性が高いことは注目に値します。
生物製剤タイプ別では、世界市場は抗体、ワクチン、細胞療法、その他の生物製剤に区分されます。現在、抗体分野が最大の市場シェアを占めています。しかし、ワクチン分野のバイオリアクターおよび発酵槽市場は、今後数年で大幅な成長が見込まれています。
主要地域別に見ると、市場は北米、欧州、アジア太平洋、中東・北アフリカ、ラテンアメリカに区分されます。現在、欧州が世界のバイオリアクターおよび発酵槽市場を独占しており、最大の収益シェアを占めています。さらに、欧州の市場は今後数年間、より高いCAGRで成長すると予想されています。
当レポートでは、世界のバイオリアクターおよび発酵槽市場について調査し、市場の概要とともに、製品タイプ別、製造材料別、バイオプロセスタイプ別、生物製剤タイプ別、主要地域別の動向、および市場に参入する企業のプロファイルなどを提供しています。
目次
第1章 序文
第2章 エグゼクティブサマリー
第3章 イントロダクション
第4章 発酵槽およびバイオリアクターメーカー:市場情勢
- 章の概要
- 発酵槽およびバイオリアクターメーカー:市場情勢
第5章 企業競争力分析
- 章の概要
- 前提/主要パラメータ
- 調査手法
- 企業競争力分析:中小企業
- 企業競争力分析:中規模企業
- 企業競争力分析:大企業と超大企業
第6章 企業プロファイル
- 章の概要
- Applikon Biotechnology(Getingeが買収)
- Bionet
- Cytiva
- Eppendorf
- Merck
- Ollital Technology
- Parr Instrument Company
- Sartorius
- Shanghai Bailun Biological Technology
- Solaris Biotech(Donaldson Companyが買収)
- Solida Biotech
- Zhengzhou Laboao Instrument Equipment(LABAO)
第7章 容量分析
- 章の概要
- 主要な前提と調査手法
- 結論
第8章 ケーススタディ:バイオプロセスコントローラと自動化システム
第9章 市場予測
- 章の概要
- 主要な前提と予測調査手法
- 世界の発酵槽およびバイオリアクター市場(2035年まで)
第10章 エグゼクティブ洞察
第11章 結論
第12章 付録1:表形式データ
第13章 付録2:企業・団体一覧
List of Tables
- Table 4.1 Fermenter and Bioreactor Manufacturers: List of Companies
- Table 4.2 Fermenter and Bioreactor Manufacturers: Information on Geographical Reach
- Table 4.3 Fermenter and Bioreactor Manufacturers: Information on Volume and Type of Bioreactor and Fermenter
- Table 4.4 Fermenter and Bioreactor Manufacturers: Information on Scale of Operation and Scalability
- Table 4.5 Fermenter and Bioreactor Manufacturers: Type of Bioprocess and Type of Cell Culture
- Table 4.6 Fermenter and Bioreactor Manufacturers: Information on Mode of Operation and Type of End-user
- Table 6.1 Fermenter and Bioreactor Manufacturers: List of Profiled Companies
- Table 6.2 Applikon Biotechnology: Company Snapshot
- Table 6.3 Applikon Biotechnology: Bioreactor Portfolio
- Table 6.4 Applikon Biotechnology: Recent Developments and Future Outlook
- Table 6.5 Bionet: Company Snapshot
- Table 6.6 Bionet: Bioreactor Portfolio
- Table 6.7 Bionet: Recent Developments and Future Outlook
- Table 6.8 Cytiva: Company Snapshot
- Table 6.9 Cytiva: Bioreactor Portfolio
- Table 6.10 Cytiva: Recent Developments and Future Outlook
- Table 6.11 Eppendorf: Company Snapshot
- Table 6.12 Eppendorf: Bioreactor Portfolio
- Table 6.13 Eppendorf: Recent Developments and Future Outlook
- Table 6.14 Merck: Company Snapshot
- Table 6.15 Merck: Bioreactor Portfolio
- Table 6.16 Merck: Recent Developments and Future Outlook
- Table 6.17 Ollital Technology: Company Snapshot
- Table 6.18 Ollital Technology: Bioreactor Portfolio
- Table 6.19 Ollital Technology: Recent Developments and Future Outlook
- Table 6.20 Parr Instrument Company: Company Snapshot
- Table 6.21 Parr Instrument Company: Bioreactor Portfolio
- Table 6.22 Parr Instrument Company: Recent Developments and Future Outlook
- Table 6.23 Sartorius: Company Snapshot
- Table 6.24 Sartorius: Bioreactor Portfolio
- Table 6.25 Sartorius: Recent Developments and Future Outlook
- Table 6.26 Shanghai Bailun Biological Technology: Company Snapshot
- Table 6.27 Shanghai Bailun Biological Technology: Bioreactor Portfolio
- Table 6.28 Shanghai Bailun Biological Technology: Recent Developments and Future Outlook
- Table 6.29 Solaris Biotech: Company Snapshot
- Table 6.30 Solaris Biotech: Bioreactor Portfolio
- Table 6.31 Solaris Biotech: Recent Developments and Future Outlook
- Table 6.32 Solida Biotech: Company Snapshot
- Table 6.33 Solida Biotech: Bioreactor Portfolio
- Table 6.34 Solida Biotech: Recent Developments and Future Outlook
- Table 6.35 Zhengzhou Laboao Instrument Equipment (LABAO): Company Snapshot
- Table 6.36 Zhengzhou Laboao Instrument Equipment (LABAO): Bioreactor Portfolio
- Table 6.37 Zhengzhou Laboao Instrument Equipment (LABAO): Recent Developments and Future Outlook
- Table 7.1 Capacity Analysis: Information on Contract Biomanufacturing Capacity
- Table 7.2 Capacity Analysis: Average Capacity per Category (Sample Data Set)
- Table 7.3 Capacity Analysis: Average Capacity for Mammalian Expression System (Sample Data Set)
- Table 7.4 Capacity Analysis: Average Capacity for Microbial Expression System (Sample Data Set)
- Table 7.5 Capacity Analysis: Global Distribution of Contract, in-house and Hybrid Biomanufacturing Capacity
- Table 8.1 Bioprocess Control Software: Information on Key Features, Compatibility with Bioreactor System and Process Controlled
- Table 8.2 Upstream Controllers: Information on Key Features, Type of Bioprocess and Compatibility with Bioreactor System
- Table 8.3 Downstream Controller Systems: Information on Key Features, Type of System, Type of Bioprocess and Application Area
- Table 10.1 Ensofa Projects: Key Highlights
- Table 10.2 Sunrise Process Equipments: Key Highlights
- Table 10.3 CerCell: Key Highlights
- Table 10.4 CelVivo: Key Highlights
- Table 12.1 Fermenter and Bioreactor Manufacturers: Distribution by Year of Establishment
- Table 12.2 Fermenter and Bioreactor Manufacturers: Distribution by Company Size
- Table 12.3 Fermenter and Bioreactor Manufacturers: Distribution by Region of Headquarters
- Table 12.4 Fermenter and Bioreactor Manufacturers: Distribution by Location of Headquarters
- Table 12.5 Fermenter and Bioreactor Manufacturers: Distribution by Year of Establishment and Region of Headquarters
- Table 12.6 Fermenter and Bioreactor Manufacturers: Distribution by Company Size and Region of Headquarters
- Table 12.7 Fermenter and Bioreactor Manufacturers: Distribution by Year of Establishment, Company Size and Region of Headquarters
- Table 12.8 Fermenter and Bioreactor Manufacturers: Distribution by Geographical Reach
- Table 12.9 Fermenter and Bioreactor Manufacturers: Distribution by Region of Headquarters Region and Geographical Reach
- Table 12.10 Fermenter and Bioreactor Manufacturers: Distribution by Type of Product
- Table 12.11 Fermenter and Bioreactor Manufacturers: Distribution by Capacity
- Table 12.12 Fermenter and Bioreactor Manufacturers: Distribution by Scale of Operation
- Table 12.13 Fermenter and Bioreactor Manufacturers: Distribution by Scalability
- Table 12.14 Fermenter and Bioreactor Manufacturers: Distribution by Type of Bioprocess
- Table 12.15 Fermenter and Bioreactor Manufacturers: Analysis by Type of Cell Culture
- Table 12.16 Fermenter and Bioreactor Manufacturers: Analysis by Mode of Operation
- Table 12.17 Fermenter and Bioreactor Manufacturers: Analysis by Type of End-user
- Table 12.18 Cytiva: Annual Revenues, Since FY 2017 (USD Million)
- Table 12.19 Eppendorf: Annual Revenues, Since FY 2017 (EUR Million)
- Table 12.20 Merck: Annual Revenues, Since FY 2017 (EUR Billion)
- Table 12.21 Sartorius: Annual Revenues, Since FY 2017 (EUR Billion)
- Table 12.22 Global Installed Bioreactors and Fermenters Capacity (by Million Liters): Distribution by Fabrication Material
- Table 12.23 Global Installed Bioreactors and Fermenters Capacity (by Million Liters): Distribution by Source of Cell Culture
- Table 12.24 Global Installed Bioreactors and Fermenters Capacity (by Million Liters): Distribution by Reactor Volume
- Table 12.25 Global Installed Bioreactors and Fermenters Capacity (by Million Liters): Distribution by Type of Manufacturer
- Table 12.26 Global Installed Bioreactors and Fermenters Capacity (by Million Liters): Distribution by Key Geographical Regions
- Table 12.27 Bioprocess Control Software: Distribution by Scale of Operation
- Table 12.28 Bioprocess Control Software: Distribution by Key Features
- Table 12.29 Bioprocess Control Software: Distribution by Compatibility with Systems
- Table 12.30 Bioprocess Control Software: Distribution by Type of Process Controlled
- Table 12.31 Bioprocess Control Software Developers: Distribution by Year of Establishment
- Table 12.32 Bioprocess Control Software Developers: Distribution by Company Size
- Table 12.33 Bioprocess Control Software Developers: Distribution by Location of Headquarters
- Table 12.34 Upstream Controllers: Distribution by Scale of Operation
- Table 12.35 Upstream Controllers: Distribution by Key Features
- Table 12.36 Upstream Controllers: Distribution by Compatibility with Bioreactor Systems
- Table 12.37 Upstream Controllers: Distribution by Type of Bioprocess
- Table 12.38 Upstream Controllers: Distribution by Type of Process Controlled
- Table 12.39 Upstream Controller Developers: Distribution by Year of Establishment
- Table 12.40 Upstream Controller Developers: Distribution by Company Size
- Table 12.41 Upstream Controller Developers: Distribution by Location of Headquarters
- Table 12.42 Downstream Controller Systems: Distribution by Scale of Operation
- Table 12.43 Downstream Controller Systems: Distribution by Key Features
- Table 12.44 Downstream Controller Systems: Distribution by Type of System
- Table 12.45 Downstream Controller Systems: Distribution by Type of Bioprocess
- Table 12.46 Downstream Controller Systems: Distribution by Application Area
- Table 12.47 Downstream Controller System Developers: Distribution by Year of Establishment
- Table 12.48 Downstream Controller System Developers: Distribution by Company Size
- Table 12.49 Downstream Controller System Developers: Distribution by Location of Headquarters
- Table 12.50 Global Fermenters and Bioreactors Market, Till 2035 (USD Billion)
- Table 12.51 Global Fermenters and Bioreactors Market, Till 2035: Distribution by Type of Product (USD Billion)
- Table 12.52 Global Bioreactors Market, Till 2035 (USD Billion)
- Table 12.53 Global Fermenters Market, Till 2035 (USD Billion)
- Table 12.54 Global Fermenters and Bioreactors Market, Till 2035: Distribution by Fabrication Material
- Table 12.55 Global Glass Fermenters and Bioreactors Market, Till 2035
- Table 12.56 Global Stainless Steel Fermenters and Bioreactors Market, Till 2035
- Table 12.57 Global Single Use Fermenters and Bioreactors Market, Till 2035
- Table 12.58 Global Fermenters and Bioreactors Market, Till 2035: Distribution by Type of Bioprocess
- Table 12.59 Global Fermenters and Bioreactors Market for Batch and Fed-batch Process, Till 2035
- Table 12.60 Global Fermenters and Bioreactors Market for Continuous Process, Till 2035
- Table 12.61 Global Fermenters and Bioreactors Market, Till 2035: Distribution by Type of Biologic
- Table 12.62 Global Fermenters and Bioreactors Market for Antibodies, Till 2035
- Table 12.63 Global Fermenters and Bioreactors Market for Vaccines, Till 2035
- Table 12.64 Global Fermenters and Bioreactors Market for Cell Therapies, Till 2035
- Table 12.65 Global Fermenters and Bioreactors Market for Other Biologics, Till 2035
- Table 12.66 Global Fermenters and Bioreactors Market, Till 2035: Distribution by Key Geographical Regions
- Table 12.67 Fermenters and Bioreactors Market in North America, Till 2035
- Table 12.68 Fermenters and Bioreactors Market in Europe, Till 2035
- Table 12.69 Fermenters and Bioreactors Market in Asia-Pacific, Till 2035
- Table 12.70 Fermenters and Bioreactors in Middle East and North Africa, Till 2035
- Table 12.71 Fermenters and Bioreactors Market in Latin America, Till 2035
List of Figures
- Figure 2.1 Executive Summary: Overall Market Landscape
- Figure 2.2 Executive Summary: Capacity Analysis
- Figure 2.3 Executive Summary: Market Forecast
- Figure 3.1 Components of a Bioreactor
- Figure 3.2 Types of Bioreactors (based on Type of Bioprocess)
- Figure 3.3 Types of Bioreactors (based on Mode of Action)
- Figure 3.4 Industries Employing Bioreactors
- Figure 3.5 Applications of Bioreactors in Pharmaceutical Industry
- Figure 4.1 Fermenter and Bioreactor Manufacturers: Distribution by Year of Establishment
- Figure 4.2 Fermenter and Bioreactor Manufacturers: Distribution by Company Size
- Figure 4.3 Fermenter and Bioreactor Manufacturers: Distribution by Region of Headquarters
- Figure 4.4 Fermenter and Bioreactor Manufacturers: Distribution by Location of Headquarters
- Figure 4.5 Fermenter and Bioreactor Manufacturers: Distribution by Year of Establishment and Region of Headquarters
- Figure 4.6 Fermenter and Bioreactor Manufacturers: Distribution by Company Size and Region of Headquarters
- Figure 4.7 Fermenter and Bioreactor Manufacturers: Distribution by Year of Establishment, Company Size and Region of Headquarters
- Figure 4.8 Fermenter and Bioreactor Manufacturers: Distribution by Geographical Reach
- Figure 4.9 Fermenter and Bioreactor Manufacturers: Distribution by Region of Headquarters and Geographical Reach
- Figure 4.10 Fermenter and Bioreactor Manufacturers: Distribution by Type of Product
- Figure 4.11 Fermenter and Bioreactor Manufacturers: Distribution by Capacity
- Figure 4.12 Fermenter and Bioreactor Manufacturers: Distribution by Scale of Operation
- Figure 4.13 Fermenter and Bioreactor Manufacturers: Distribution by Scalability
- Figure 4.14 Fermenter and Bioreactor Manufacturers: Distribution by Type of Bioprocess
- Figure 4.15 Fermenter and Bioreactor Manufacturers: Distribution by Type of Cell Culture
- Figure 4.16 Fermenter and Bioreactor Manufacturers: Distribution by Mode of Operation
- Figure 4.17 Fermenter and Bioreactor Manufacturers: Distribution by Type of End-user
- Figure 5.1 Competitiveness Analysis: Small Companies
- Figure 5.2 Competitiveness Analysis: Small Companies based in North America
- Figure 5.3 Competitiveness Analysis: Small Companies based in Europe
- Figure 5.4 Competitiveness Analysis: Small Companies based in Asia-Pacific and Rest of the World
- Figure 5.5 Competitiveness Analysis: Mid-sized Companies
- Figure 5.6 Competitiveness Analysis: Mid-sized Companies based in North America
- Figure 5.7 Competitiveness Analysis: Mid-sized Companies based in Europe
- Figure 5.8 Competitiveness Analysis: Mid-sized Companies based in Asia-Pacific and Rest of the World
- Figure 5.9 Competitiveness Analysis: Large and Very Large Companies
- Figure 5.10 Competitiveness Analysis of Fermenter and Bioreactor Manufacturers: Competitiveness Score of Top Players
- Figure 6.1 Cytiva: Annual Revenues, Since FY 2017 (USD Million)
- Figure 6.2 Eppendorf: Annual Revenues, Since FY 2017 (EUR Million)
- Figure 6.3 Merck: Annual Revenues, Since FY 2017 (EUR Billion)
- Figure 6.4 Sartorius: Annual Revenues, Since FY 2017 (EUR Billion)
- Figure 7.1 Global Installed Bioreactors and Fermenters Capacity (by Million Liters): Distribution by Fabrication Material
- Figure 7.2 Global Installed Bioreactors and Fermenters Capacity (by Million Liters): Distribution by Source of Cell Culture
- Figure 7.3 Global Installed Bioreactors and Fermenters Capacity (by Million Liters): Distribution by Reactor Volume
- Figure 7.4 Global Installed Bioreactors and Fermenters Capacity (by Million Liters): Distribution by Type of Manufacturer
- Figure 7.5 Global Installed Bioreactors and Fermenters Capacity (by Million Liters): Distribution by Key Geographical Regions
- Figure 8.1 Bioprocess Control Software: Distribution by Scale of Operation
- Figure 8.2 Bioprocess Control Software: Distribution by Key Features
- Figure 8.3 Bioprocess Control Software: Distribution by Compatibility with System
- Figure 8.4 Bioprocess Control Software: Distribution by Type of Process Controlled
- Figure 8.5 Bioprocess Control Software Developers: Distribution by Year of Establishment
- Figure 8.6 Bioprocess Control Software Developers: Distribution by Company Size
- Figure 8.7 Bioprocess Control Software Developers: Distribution by Location of Headquarters
- Figure 8.8 Upstream Controllers: Distribution by Scale of Operation
- Figure 8.9 Upstream Controllers: Distribution by Key Features
- Figure 8.10 Upstream Controllers: Distribution by Compatibility with Bioreactor System
- Figure 8.11 Upstream Controllers: Distribution by Type of Bioprocess
- Figure 8.12 Upstream Controllers: Distribution by Type of Process Controlled
- Figure 8.13 Upstream Controller Developers: Distribution by Year of Establishment
- Figure 8.14 Upstream Controller Developers: Distribution by Company Size
- Figure 8.15 Upstream Controller Developers: Distribution by Location of Headquarters
- Figure 8.16 Downstream Controller Systems: Distribution by Scale of Operation
- Figure 8.17 Downstream Controller Systems: Distribution by Key Features
- Figure 8.18 Downstream Controller Systems: Distribution by Type of System
- Figure 8.19 Downstream Controller Systems: Distribution by Type of Bioprocess
- Figure 8.20 Downstream Controller Systems: Distribution by Application Area
- Figure 8.21 Downstream Controller System Developers: Distribution by Year of Establishment
- Figure 8.22 Downstream Controller System Developers: Distribution by Company Size
- Figure 8.23 Downstream Controller System Developers: Distribution by Location of Headquarters
- Figure 9.1 Global Fermenters and Bioreactors Market, Till 2035 (USD Billion)
- Figure 9.2 Global Fermenters and Bioreactors Market, Till 2035: Distribution by Type of Product (USD Billion)
- Figure 9.3 Global Bioreactors Market, Till 2035 (USD Billion)
- Figure 9.4 Global Fermenters Market, Till 2035 (USD Billion)
- Figure 9.5 Global Fermenters and Bioreactors Market, Till 2035: Distribution by Fabrication Material
- Figure 9.6 Global Glass Fermenters and Bioreactors Market, Till 2035
- Figure 9.7 Global Stainless Steel Fermenters and Bioreactors Market, Till 2035
- Figure 9.7 Global Single Use Fermenters and Bioreactors Market, Till 2035
- Figure 9.8 Global Fermenters and Bioreactors Market, Till 2035: Distribution by Type of Bioprocess
- Figure 9.9 Global Fermenters and Bioreactors Market for Batch and Fed-batch Process, Till 2035
- Figure 9.10 Global Fermenters and Bioreactors Market for Continuous Process, Till 2035
- Figure 9.11 Global Fermenters and Bioreactors Market, Till 2035: Distribution by Type of Biologic
- Figure 9.12 Global Fermenters and Bioreactors Market for Antibodies, Till 2035
- Figure 9.13 Global Fermenters and Bioreactors Market for Vaccines, Till 2035
- Figure 9.14 Global Fermenters and Bioreactors Market for Cell Therapies, Till 2035
- Figure 9.15 Global Fermenters and Bioreactors Market for Other Biologics, Till 2035
- Figure 9.16 Global Fermenters and Bioreactors Market, Till 2035: Distribution by Key Geographical Regions
- Figure 9.17 Fermenters and Bioreactors Market in North America, Till 2035
- Figure 9.18 Fermenters and Bioreactors Market in Europe, Till 2035
- Figure 9.19 Fermenters and Bioreactors Market in Asia-Pacific, Till 2035
- Figure 9.20 Fermenters and Bioreactors Market in Middle East and North Africa, Till 2035
- Figure 9.21 Fermenters and Bioreactors Market in Latin America, Till 2035
- Figure 11.1 Concluding Remarks: Overall Market Landscape of Fermenter and Bioreactor Manufacturers
- Figure 11.2 Concluding Remarks: Geographical Distribution of Fermenter and Bioreactor Manufacturers
- Figure 11.3 Concluding Remarks: Capacity Analysis
- Figure 11.4 Concluding Remarks: Market Forecast
BIOREACTORS AND FERMENTERS MARKET: OVERVIEW
As per Roots Analysis, the global bioreactors and fermenters market is estimated to grow from USD 23.2 billion in the current year to USD 73.9 billion by 2035, at a CAGR of 11.1% during the forecast period, till 2035.
The market sizing and opportunity analysis has been segmented across the following parameters:
Type of Product
- Bioreactors
- Fermenters
Fabrication Material
- Glass
- Stainless Steel
- Single Use
Type of Bioprocess
- Batch and Fed-batch
- Continuous
Type of Biologic
- Antibodies
- Vaccines
- Cell Therapies
- Other Biologics
Key Geographical Regions
- North America
- Europe
- Asia-Pacific
- Middle East and North Africa
- Latin America
BIOREACTORS AND FERMENTERS MARKET: GROWTH AND TRENDS
Bioreactors and fermenters play an indispensable role in upstream biomanufacturing by providing the requisite conditions for producing high-value products, including recombinant proteins, tissue- engineered constructs and in vitro cell-based models. The technique of culturing cells via bioreactors was developed in the early twentieth century. The usage and scalability of such instruments evolved with the ever-increasing demand for novel biological products. In fact, biopharma companies, CMOs, and non-industry players have significantly invested in bioreactors to meet the rising demand for various therapies, including vaccines, fusion proteins, antibodies, hormones, interleukins, interferons, enzymes, and advanced therapeutic medicinal products (ATMPs).
In contrast to bioreactors, fermenters are used for the anaerobic cultivation of microbial (fungal or bacterial) cell populations to produce biologics that do not require significant post-translational modifications. The overall growth of the biopharmaceutical market, specifically post the COVID-19 pandemic, has led to a rise in demand for advanced upstream bioprocessing technologies, including bioreactors, offering lucrative opportunities to equipment manufacturers.
BIOREACTORS AND FERMENTERS MARKET: KEY INSIGHTS
The report delves into the current state of the bioreactors and fermenters market and identifies potential growth opportunities within the industry. Some key findings from the report include:
- Presently, over 255 companies have the required expertise to manufacture various types of bioreactors and fermenters across the globe.
- The current market landscape features the presence of both established and emerging players engaged in the manufacturing of bioreactors and fermenters of variable capacity ranges and modes of operation.
- Close to 80% of firms manufacture bioreactors and fermenters for batch processes; of these, 55% of the manufacturers have the capability to scale up their equipment from lab to commercial scale.
- The bioreactors and fermenters market landscape is fragmented; most of the well-established players are located in developed regions, while majority of small players are located in the Asia-Pacific region.
- Owing to the rise in demand for complex biologics, the requirement of novel bioreactors and fermenters is increasing, which has prompted the bioreactor and fermenter manufacturers to upgrade their capabilities.
- The global installed bioreactors and fermenters capacity is distributed across various geographies; over 60% of this capacity is installed in the in-house facilities of biologics manufacturers.
- Stainless steel bioreactors hold a prominent share of the current installed biomanufacturing capacity; the majority of this share is dedicated to the manufacturing of mammalian and microbial-based therapeutics.
- The global bioreactors and fermenters market is likely to grow at a CAGR of 11.1%, till 2035; the projected opportunity is likely to be driven by continuous manufacturing bioprocesses.
- In the long term, the disposable / single-use systems used for the manufacturing of antibodies and other novel biologics will likely emerge as the key growth drivers of the overall market.
BIOREACTORS AND FERMENTERS MARKET: KEY SEGMENTS
Bioreactors Segment Occupy the Largest Share of the Bioreactors and Fermenters Market
Based on the type of product, the market is segmented into bioreactors and fermenters. At present, the bioreactors segment holds the maximum share of the global bioreactors and fermenters market. Additionally, the fermenters segment is likely to grow at a faster pace during the forecasted period.
By Fabrication Material, Single Use Bioreactors is the Fastest Growing Segment of the Global Bioreactors and Fermenters Market
Based on the fabrication material, the market is segmented into glass, stainless steel and single use bioreactors. Currently, the stainless-steel bioreactors segment captures the highest proportion of the global bioreactors and fermenters market. Further, the bioreactors and fermenters market for single use bioreactors is likely to grow at a relatively higher CAGR owing to its several benefits, such as ~50% reduction in total energy and water consumption and ~40% cost saving by elimination of cleaning and sterilization processes after every batch production.
Batch and Fed-Batch Segment Occupy the Largest Share of the Bioreactors and Fermenters Market by Type of Bioprocess
Based on the type of bioprocess, the market is segmented into batch and fed batch, and continuous. At present, bioreactors used in batch and fed-batch mode hold the maximum share of the bioreactors and fermenters market. Further, it is worth highlighting that the bioreactors and fermenters market for the continuous type of bioprocess segment is likely to grow at a relatively higher CAGR.
Currently, the Antibodies Segment Holds the Largest Share of the Bioreactors and Fermenters Market
Based on the type of biologic, the global market is segmented into antibodies, vaccines, cell therapies and other biologics. Currently, the antibodies segment holds the largest market share. However, the bioreactors and fermenters market for vaccines segment is expected to witness substantial growth in the coming years.
Europe Accounts for the Largest Share of the Market
Based on key geographical regions, the market is segmented into North America, Europe, Asia-Pacific, Middle East and North Africa, and Latin America. Currently, Europe dominates the global bioreactors and fermenters market and accounts for the largest revenue share. Further, the market in Europe is expected to grow at a higher CAGR in the coming years.
Example Players in the Bioreactors and Fermenters Market
- Applikon Biotechnology
- Bionet
- Cytiva
- Eppendorf
- Merck
- Ollital Technology
- Parr Instrument Company
- Sartorius
- Shanghai Bailun Biological Technology
- Solaris Biotech
- Solida Biotech
- Zhengzhou Laboao Instrument Equipment (LABAO)
BIOREACTORS AND FERMENTERS MARKET: RESEARCH COVERAGE
- Market Sizing and Opportunity Analysis: The report features an in-depth analysis of the global bioreactors and fermenters market, focusing on key market segments, including [A] type of product, [B] fabrication material, [C] type of bioprocess, [D] type of biologic and [E] key geographical regions.
- Market Landscape: A comprehensive evaluation of the companies engaged in manufacturing of bioreactors and fermenters, based on several relevant parameters, such as [A] year of establishment, [B] company size, [C] region of headquarters, [D] geographical reach, [E] capacity, [F] scale of operation, [G] scalability, [H] type of bioprocess, [I] type of cell culture, [J] mode of operation and [K] type of end user.
- Company Competitiveness Analysis: A comprehensive competitive analysis of bioreactors and fermenter manufacturers, examining factors, such as [A] manufacturer strength and [B] portfolio strength.
- Company Profiles: In-depth profiles of key manufacturers engaged in the bioreactors and fermenter market, focusing on [A] overview of the company, [B] financial information (if available), [C] product portfolio, and [D] recent developments and [E] an informed future outlook.
- Capacity Analysis: An insightful analysis of the global installed bioreactors and fermenters capacity of biologics, based on several relevant parameters, such as [A] fabrication material, [B] target disease indication, [C] source of cell culture, [D] reactor volume, [E] type of manufacturer and [F] key geographical regions.
- Case Study: A detailed discussion on the market landscape of bioprocess controllers and automation systems, based on several parameters, such as [A] scale of operation, [B] key features, [C] compatibility with bioreactor system, [D] type of bioprocess and [E] type of process controlled. Additionally, a comprehensive evaluation of companies involved in the development of bioprocess control software, and upstream and downstream controllers, based on several relevant parameters, such as [A] year of establishment, [B] company size, and [C] location of headquarters.
KEY QUESTIONS ANSWERED IN THIS REPORT
- How many companies are currently engaged in this market?
- Which are the leading companies in this market?
- What factors are likely to influence the evolution of this market?
- What is the current and future market size?
- What is the CAGR of this market?
- How is the current and future market opportunity likely to be distributed across key market segments?
REASONS TO BUY THIS REPORT
- The report provides a comprehensive market analysis, offering detailed revenue projections of the overall market and its specific sub-segments. This information is valuable to both established market leaders and emerging entrants.
- Stakeholders can leverage the report to gain a deeper understanding of the competitive dynamics within the market. By analyzing the competitive landscape, businesses can make informed decisions to optimize their market positioning and develop effective go-to-market strategies.
- The report offers stakeholders a comprehensive overview of the market, including key drivers, barriers, opportunities, and challenges. This information empowers stakeholders to stay abreast of market trends and make data-driven decisions to capitalize on growth prospects.
ADDITIONAL BENEFITS
- Complimentary PPT Insights Packs
- Complimentary Excel Data Packs for all Analytical Modules in the Report
- 15% Free Content Customization
- Detailed Report Walkthrough Session with Research Team
- Free Updated report if the report is 6-12 months old or older
TABLE OF CONTENTS
1. PREFACE
- 1.1. Introduction
- 1.2. Key Market Insights
- 1.3. Scope of the Report
- 1.4. Research Methodology
- 1.5. Frequently Asked Questions
- 1.6. Chapter Outlines
2. EXECUTIVE SUMMARY
3. INTRODUCTION
- 3.1. Chapter Overview
- 3.2. Overview of Bioreactors
- 3.3. Components of a Bioreactor
- 3.4. Types of Bioreactors
- 3.4.1. Classification based on Type of Bioprocess
- 3.4.2. Classification based on Mode of Action
- 3.5. Applications of Bioreactors
- 3.6. Future Perspectives
4. FERMENTER AND BIOREACTOR MANUFACTURERS: MARKET LANDSCAPE
- 4.1. Chapter Overview
- 4.2. Fermenter and Bioreactor Manufacturers: Overall Market Landscape
- 4.2.1. Analysis by Year of Establishment
- 4.2.2. Analysis by Company Size
- 4.2.3. Analysis by Region of Headquarters
- 4.2.4. Analysis by Location of Headquarters
- 4.2.5. Analysis by Year of Establishment and Region of Headquarters
- 4.2.6. Analysis by Company Size and Region of Headquarters
- 4.2.7. Analysis by Year of Establishment, Company Size and Region of Headquarters
- 4.2.8. Analysis by Geographical Reach
- 4.2.9. Analysis by Region of Headquarters and Geographical Reach
- 4.2.10. Analysis by Type of Product
- 4.2.11. Analysis by Capacity
- 4.2.12. Analysis by Scale of Operation
- 4.2.13. Analysis by Scalability
- 4.2.14. Analysis by Type of Bioprocess
- 4.2.15. Analysis by Type of Cell Culture
- 4.2.16. Analysis by Mode of Operation
- 4.2.17. Analysis by Type of End-user
5. COMPANY COMPETITIVENESS ANALYSIS
- 5.1. Chapter Overview
- 5.2. Assumptions / Key Parameters
- 5.3. Methodology
- 5.4. Company Competitiveness Analysis: Small Companies
- 5.4.1. Company Competitiveness Analysis: Small Companies based in North America
- 5.4.2. Company Competitiveness Analysis: Small Companies based in Europe
- 5.4.3. Company Competitiveness Analysis: Small Companies based in Asia-Pacific and Rest of the World
- 5.5. Company Competitiveness Analysis: Mid-sized Companies
- 5.5.1. Company Competitiveness Analysis: Mid-sized Companies based in North America
- 5.5.2. Company Competitiveness Analysis: Mid-sized Companies based in Europe
- 5.5.3. Company Competitiveness Analysis: Mid-sized Companies based in Asia-Pacific and Rest of the World
- 5.6. Company Competitiveness Analysis: Large and Very Large Companies
6. COMPANY PROFILES
- 6.1. Chapter Overview
- 6.2. Applikon Biotechnology (acquired by Getinge)
- 6.2.1. Company Overview
- 6.2.2. Product Portfolio
- 6.2.3. Recent Developments and Future Outlook
- 6.3. Bionet
- 6.3.1. Company Overview
- 6.3.2. Product Portfolio
- 6.3.3. Recent Developments and Future Outlook
- 6.4. Cytiva
- 6.4.1. Company Overview
- 6.4.2. Financial Information
- 6.4.3. Product Portfolio
- 6.4.4. Recent Developments and Future Outlook
- 6.5. Eppendorf
- 6.5.1. Company Overview
- 6.5.2. Financial Information
- 6.5.3. Product Portfolio
- 6.5.4. Recent Developments and Future Outlook
- 6.6. Merck
- 6.6.1. Company Overview
- 6.6.2. Financial Information
- 6.6.3. Product Portfolio
- 6.6.4. Recent Developments and Future Outlook
- 6.7. Ollital Technology
- 6.7.1. Company Overview
- 6.7.2. Product Portfolio
- 6.7.3. Recent Developments and Future Outlook
- 6.8. Parr Instrument Company
- 6.8.1. Company Overview
- 6.8.2. Product Portfolio
- 6.8.3. Recent Developments and Future Outlook
- 6.9. Sartorius
- 6.9.1. Company Overview
- 6.9.2. Financial Information
- 6.9.3. Product Portfolio
- 6.9.4. Recent Developments and Future Outlook
- 6.10. Shanghai Bailun Biological Technology
- 6.10.1. Company Overview
- 6.10.2. Product Portfolio
- 6.10.3. Recent Developments and Future Outlook
- 6.11. Solaris Biotech (acquired by Donaldson Company)
- 6.11.1. Company Overview
- 6.11.2. Product Portfolio
- 6.11.3. Recent Developments and Future Outlook
- 6.12. Solida Biotech
- 6.12.1. Company Overview
- 6.12.2. Product Portfolio
- 6.12.3. Recent Developments and Future Outlook
- 6.13. Zhengzhou Laboao Instrument Equipment (LABAO)
- 6.13.1. Company Overview
- 6.13.2. Product Portfolio
- 6.13.3. Recent Developments and Future Outlook
7. CAPACITY ANALYSIS
- 7.1. Chapter Overview
- 7.2. Key Assumptions and Methodology
- 7.2.1. Bioreactors and Fermenters: Global Installed Capacity of Biologics
- 7.2.1.1. Analysis by Fabrication Material
- 7.2.1.2. Analysis by Source of Cell Culture
- 7.2.1.3. Analysis by Reactor Volume
- 7.2.1.4. Analysis by Type of Manufacturer
- 7.2.1.5. Analysis by Key Geographical Regions
- 7.2.1. Bioreactors and Fermenters: Global Installed Capacity of Biologics
- 7.3. Concluding Remarks
8. CASE STUDY: BIOPROCESS CONTROLLERS AND AUTOMATION SYSTEMS
- 8.1. Chapter Overview
- 8.2. Bioprocess Control Software: Overall Market Landscape
- 8.2.1. Analysis by Scale of Operation
- 8.2.2. Analysis by Key Features
- 8.2.3. Analysis by Compatibility with System
- 8.2.4. Analysis by Type of Process Controlled
- 8.3. Bioprocess Control Software Developers: Overall Market Landscape
- 8.3.1. Analysis by Year of Establishment
- 8.3.2. Analysis by Company Size
- 8.3.3. Analysis by Location of Headquarters
- 8.4. Upstream Controllers: Overall Market Landscape
- 8.4.1. Analysis by Scale of Operation
- 8.4.2. Analysis by Key Features
- 8.4.3. Analysis by Compatibility with Bioreactor System
- 8.4.4. Analysis by Type of Bioprocess
- 8.4.5. Analysis by Type of Process Controlled
- 8.5. Upstream Controller Developers: Overall Market Landscape
- 8.5.1. Analysis by Year of Establishment
- 8.5.2. Analysis by Company Size
- 8.5.3. Analysis by Location of Headquarters
- 8.6. Downstream Controller Systems: Overall Market Landscape
- 8.6.1. Analysis by Scale of Operation
- 8.6.2. Analysis by Key Features
- 8.6.3. Analysis by Type of System
- 8.6.4. Analysis by Type of Bioprocess
- 8.6.5. Analysis by Application Area
- 8.7. Downstream Controller System Developers: Overall Market Landscape
- 8.7.1. Analysis by Year of Establishment
- 8.7.2. Analysis by Company Size
- 8.7.3. Analysis by Location of Headquarters
9. MARKET FORECAST
- 9.1. Chapter Overview
- 9.2. Key Assumptions and Forecast Methodology
- 9.3. Global Fermenters and Bioreactors Market, Till 2035
- 9.3.1. Global Fermenters and Bioreactors Market, Till 2035: Distribution by Type of Product
- 9.3.1.1. Global Bioreactors Market, Till 2035
- 9.3.1.2. Global Fermenters Market, Till 2035
- 9.3.2. Global Fermenters and Bioreactors Market, Till 2035: Distribution by Fabrication Material
- 9.3.2.1. Global Glass Fermenters and Bioreactors Market, Till 2035
- 9.3.2.2. Global Stainless Steel Fermenters and Bioreactors Market, Till 2035
- 9.3.2.3. Global Single Use Fermenters and Bioreactors Market, Till 2035
- 9.3.3. Global Fermenters and Bioreactors Market, Till 2035: Distribution by Type of Bioprocess
- 9.3.3.1. Global Fermenters and Bioreactors Market for Batch and Fed-batch Process, Till 2035
- 9.3.3.2. Global Fermenters and Bioreactors Market for Continuous Process, Till 2035
- 9.3.4. Global Fermenters and Bioreactors Market, Till 2035: Distribution by Type of Biologic
- 9.3.4.1. Global Fermenters and Bioreactors Market for Antibodies, Till 2035
- 9.3.4.2. Global Fermenters and Bioreactors Market for Vaccines, Till 2035
- 9.3.4.3. Global Fermenters and Bioreactors Market for Cell Therapies, Till 2035
- 9.3.4.4. Global Fermenters and Bioreactors Market for Other Biologics, Till 2035
- 9.3.5. Global Fermenters and Bioreactors Market, Till 2035: Distribution by Key Geographical Regions
- 9.3.5.1. Global Fermenters and Bioreactors Market in North America, Till 2035
- 9.3.5.2. Global Fermenters and Bioreactors Market in Europe, Till 2035
- 9.3.5.3. Global Fermenters and Bioreactors Market in Asia-Pacific, Till 2035
- 9.3.5.4. Global Fermenters and Bioreactors Market in Middle East and North Africa, Till 2035
- 9.3.5.5. Global Fermenters and Bioreactors Market in Latin America, Till 2035
- 9.3.1. Global Fermenters and Bioreactors Market, Till 2035: Distribution by Type of Product
