
|
市場調査レポート
商品コード
1737048
オートインジェクターの世界市場:使用法別、投与経路別、送達分子タイプ別、作用機序タイプ別、容器の容量別、エンドユーザー別、標的適応症別、主要地域別Global Autoinjectors Market by Usability, Route of Administration, Type of Molecule Delivered, Type of Actuation Mechanism, Volume of Container, End-user, Target Indication and Key Geographical Regions |
||||||
カスタマイズ可能
|
|||||||
| オートインジェクターの世界市場:使用法別、投与経路別、送達分子タイプ別、作用機序タイプ別、容器の容量別、エンドユーザー別、標的適応症別、主要地域別 |
|
出版日: 2025年05月26日
発行: Roots Analysis
ページ情報: 英文 593 Pages
納期: 即日から翌営業日
|

全表示
- 概要
- 図表
- 目次
世界のオートインジェクターの市場規模は、2035年までの予測期間中に6.2%のCAGRで拡大し、現在の906億米ドルから2035年までに1,759億米ドルに成長すると予測されています。
市場セグメンテーションと機会分析は、以下のパラメータでセグメント化されています:
使用法別
- 使い捨て
- 再利用型
投与経路別
- 皮下
- 静脈内
- 筋肉内
送達分子タイプ別
- 抗体
- ペプチド
- タンパク質
- 低分子
- その他
作用機序タイプ別
- 手動
- 自動
容器の容量別
- 1mL未満
- 1~2 mL
- 2mL以上
エンドユーザー別
- 外来手術センター
- 在宅医療
- 病院および診療所
標的適応症別
- アナフィラキシー
- 糖尿病
- 片頭痛
- 多発性硬化症
- 関節リウマチ
- 体重減少
- その他
主要地域別
- 北米
- 欧州
- アジア太平洋
- 中東・北アフリカ
- ラテンアメリカ
世界のオートインジェクター市場(第5版):成長と動向
糖尿病、多発性硬化症、関節リウマチ、重度のアレルギーなどの慢性疾患の世界的な増加により、より効率的で革新的、かつユーザーフレンドリーなドラッグデリバリーシステムが急務となっています。これらの慢性疾患が患者に与える影響は相当なものであり、関連する費用や合併症が長期間に渡って劇的にエスカレートする可能性があることは注目に値します。その結果、医療業界は、オートインジェクターを含む新しいドラッグデリバリーデバイスの開発に多大な努力を払ってきました。
オートインジェクターは、皮下または筋肉内ルートからのドラッグデリバリーに使用される自動注射器です。これらは主に、プレフィルドシリンジやカートリッジを主容器として使用するスプリング駆動の装置です。ドラッグデリバリーのプロセスを完全または部分的に自動化することで、これらの装置は投与プロセスをより便利にします。そのため、オートインジェクターは、安全で信頼性の高い注射薬の送達が可能な、患者中心の次世代機器として大きな可能性を示しています。さらに、新しい生物製剤の出現により、より粘度の高い薬剤を大量に注射する需要が高まっています。その結果、BDメディカルやSHLなど多くの機器メーカーが大容量のオートインジェクターを導入しています。さらに、現在開発中の新しいオートインジェクターは、個々の患者の特定のニーズや要望に対応することができます。これらは、使用者の要求に基づいて、投与量や装置の機能を調整できるように設計されています。実際、注射器を様々な製品やプラットフォームにデジタル接続することで、患者の服薬アドヒアランスや生活の質の向上が期待されています。オートインジェクターにおけるこのような進歩を踏まえると、効果的なドラッグデリバリーシステムと疾病管理に対するニーズの高まりに、将来的に効率的に対処することができます。
世界オのートインジェクター市場:主要インサイト
本レポートでは、世界のオートインジェクター市場の現状を掘り下げ、業界内の潜在的な成長機会を特定しています。主な調査結果は以下の通り:
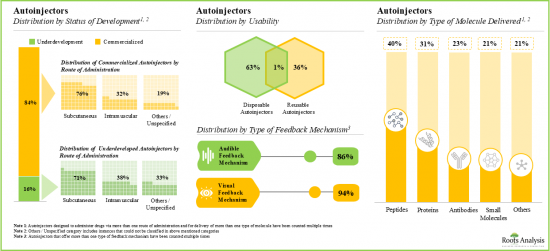
現在、150近いオートインジェクターが、世界の様々な参入企業によって入手可能/製造されています。
市販されているオートインジェクターのほとんどは皮下投与に適しています。これらのオートインジェクターは、可聴・視覚インジケータと統合されており、無数の分子を送達することができます。
さらに、大陸間および大陸内のパートナーシップのほとんどは、欧州を拠点とする参入企業によって締結されています。
2019年以降、オートインジェクターに関連する1,100件以上の特許が、この領域内で生成された知的財産を保護するために、様々な利害関係者によって出願され/様々な利害関係者に付与されています。
学術/医療/商業組織に所属する複数の科学者、臨床医、業界のベテランが、オートインジェクターに関連する研究の先頭に立っています。
また、オートインジェクター配合剤開発企業の60%近くが超大手企業です。
市販されているオートインジェクター配合剤の約75%は注射器と互換性があり、特に、これらの配合剤の大部分は成人の在宅医療での使用を目的としています。
様々な適応症の治療を目的とした70以上のオートインジェクター配合剤が、現在開発の初期段階と後期段階で評価されています。
初期および後期段階の配合剤の約90%は、現在さまざまな臨床段階の開発段階にあり、これらの大部分は慢性疾患(主に関節リウマチ)の治療用に開発されています。
オートインジェクター市場は安定した速度で成長すると予想されています。特に、ディスポーザブルオートインジェクターは、手作業で薬剤を充填する必要がなく、汚染のリスクが低いため、2024年には88%以上の市場シェアを獲得すると思われます。
自動作用機序を持つオートインジェクターは、2035年までより速いペース(~7%)で成長すると予測されています。さらに、関節リウマチをターゲットとした薬剤の送達を目的としたオートインジェクターが、現在の市場を独占する可能性が高いです。
在宅医療に適したオートインジェクターは、予測期間中に市場の大半のシェアを獲得するとみられています。アジア太平洋は、2035年まで、この領域でより高い成長率で成長すると予想されます。
世界のオートインジェクター市場(第5版):主要セグメント
使用法別では、市場は使い捨てオートインジェクターと再利用型オートインジェクターに区分されます。現在、世界のオートインジェクター市場で最大のシェアを占めているのは使い捨てオートインジェクターです。この動向は今後数年間も変わらないと思われます。
静脈内ドラッグデリバリー用オートインジェクターは、予測期間中、世界のオートインジェクター市場で最も急成長しているセグメントです。
投与経路別では、市場は皮下、筋肉内、静脈内に区分されます。現在、皮下ドラッグデリバリーに使用されるオートインジェクターが世界のオートインジェクター市場で最も高い割合を占めています。静脈内オートインジェクターセグメントの世界オートインジェクター市場は、比較的高いCAGRで成長する可能性が高いことは注目に値します。
送達分子タイプ別では、市場は抗体、ペプチド、タンパク質、低分子、その他に区分されます。現在、タンパク質送達用に設計されたオートインジェクターが世界のオートインジェクター市場で最大のシェアを占めています。この動向は、近い将来変化する可能性が高いです。
作用機序タイプ別では、市場は手動作用機序と自動作用機序ベースのオートインジェクターに区分されます。現在、自動作用機序を備えたオートインジェクターが世界のオートインジェクター市場で最も高い割合を占めています。さらに、自動作用機序ベースのオートインジェクターの世界市場は、比較的高いCAGRで成長する可能性が高いことは注目に値します。
容器の容量別では、市場は保存容量が1mL未満、1~2mL、2mL以上のオートインジェクターに区分されます。現在、薬剤保存容量が1~2mlのオートインジェクターが世界のオートインジェクター市場で最大のシェアを占めています。この動向は今後10年間も変わらないと思われます。
エンドユーザー別に見ると、市場は在宅医療、病院・診療所、外来手術センターに区分されます。現在、在宅医療分野で使用されるオートインジェクターが世界のオートインジェクター市場で最大のシェアを占めています。さらに、このセグメントは他のセグメントに比べて速いペースで成長する可能性が高いです。
標的適応症別では、市場はアナフィラキシー、糖尿病、片頭痛、多発性硬化症、関節リウマチ、体重減少、その他の適応症に区分されます。関節リウマチの適応症が市場全体の主な促進要因になると予想されるが、減量分野のオートインジェクターの世界市場が相対的に高いCAGRで成長する可能性が高いことは注目に値します。
主要地域別に見ると、市場は北米、欧州、アジア太平洋、ラテンアメリカ、中東・北アフリカに区分されます。北米と欧州を拠点とする企業がシェアの大半を占めると予想されます。
オートインジェクターの世界市場における参入企業例
- Amgen
- Antares Pharma
- ChemProtect.SK
- Elcam Medical
- Eli Lilly and Company
- Jiangsu Delfu Medical Device
- Kindeva Drug Delivery
- Merck
- Novartis
- Novo Nordisk
- Oval Medical Technologies
- Owen Mumford
- PreciHealth
- Recipharm
- Sanofi
- SHL Medical
- Teva Pharmaceuticals
- Union Medico
- Ypsomed
当レポートでは、世界のオートインジェクター市場について調査し、市場の概要とともに、使用法別、投与経路別、送達分子タイプ別、作用機序タイプ別、容器の容量別、エンドユーザー別、標的適応症別、主要地域別の動向、および市場に参入する企業のプロファイルなどを提供しています。
目次
第1章 序文
第2章 調査手法
第3章 経済的およびその他のプロジェクト特有の考慮事項
第4章 エグゼクティブサマリー
第5章 イントロダクション
- 章の概要
- ドラッグデリバリーシステムの種類
- 従来の非経口投与システムの欠点
- 自己管理の新たな潮流
- 自己投与デバイスの種類
- オートインジェクターの概要
- 規制上の考慮事項
- 将来の展望
第6章 オートインジェクターで使用される主な薬剤容器
- 章の概要
- 包装の種類
- 主な医薬品容器
- 一次医薬品容器の役割
- カートリッジ
- 注射器
- バイアル
- さまざまな製造材料の比較
第7章 オートインジェクター:市場概要
- 章の概要
- オートインジェクター:市場情勢
- オートインジェクターメーカー:市場情勢
第8章 製品競争力分析
- 章の概要
- 前提と主要なパラメータ
- 調査手法
- オートインジェクター:製品競争力分析
- 使い捨てオートインジェクター
- 再利用型オートインジェクター
第9章 ブランドポジショニング分析
- 章の概要
- 前提と主要なパラメータ
- 調査手法
- オートインジェクターメーカー:ブランドポジショニングフレームワーク
- ブランドポジショニングフレームワーク:Owen Mumford
- ブランドポジショニングフレームワーク:Ypsomed
- ブランドポジショニングフレームワーク:Elcam Medical
- ブランドポジショニングフレームワーク:SHL Medical
- ブランドポジショニングフレームワーク:Union Medico
- ブランドポジショニングフレームワーク:Antares Pharma
- ブランドポジショニングフレームワーク:PreciHealth
- ブランドポジショニングフレームワーク:Jiangsu Delfu Medical Device
- ブランドポジショニングフレームワーク:Oval Medical Technologies
- ブランドポジショニングフレームワーク:Recipharm
第10章 オートインジェクターメーカー:詳細な企業プロファイル
- 章の概要
- Antares Pharma
- Elcam Medical
- Jiangsu Delfu Medical Device
- Oval Medical Technologies
- Owen Mumford
- PreciHealth
- Recipharm
- SHL Medical
- Union Medico
- Ypsomed
第11章 パートナーシップとコラボレーション
- 章の概要
- パートナーシップモデル
- オートインジェクター:パートナーシップとコラボレーション
第12章 特許分析
- 章の概要
- 範囲と調査手法
- オートインジェクター:特許分析
- 特許ベンチマーク分析
- 特許評価
- 引用数上位の特許
第13章 薬剤・デバイスの組み合わせ:上市済みオートインジェクター
- 章の概要
- 薬剤・デバイスの組み合わせ:上市済みオートインジェクター
- 薬剤・デバイスの組み合わせ:上市済みオートインジェクター開発者
第14章 薬剤・デバイスの組み合わせ:初期段階および後期段階のオートインジェクター
- 章の概要
- 薬剤・デバイスの組み合わせ:初期段階および後期段階のオートインジェクター
- 医薬品デバイスの組み合わせ:初期段階および後期段階のオートインジェクター開発者の情勢
第15章 企業プロファイル:オートインジェクター複合製品開発企業
- 章の概要
- Amgen
- ChemProtect.SK
- Eli Lilly and Company
- Kindeva Drug Delivery
- Merck
- Novartis
- Novo Nordisk
- Sanofi
- Teva Pharmaceutical Industries
第16章 KOL分析
第17章 ケーススタディ:主な治療適応
- 章の概要
- アナフィラキシー
- 多発性硬化症
- 片頭痛
- 関節リウマチ
第18章 ケーススタディ:医療機器契約サービスプロバイダー
- 章の概要
- 医療機器製造に伴う課題
- 医療機器製造におけるCMOの役割
- 医療機器CMOが提供するサービス
- 医療機器CMOが提供するメリット
- CMOへのアウトソーシングに伴うリスク
- ドラッグデリバリーデバイスサービスプロバイダー
- 結論
第19章 ケーススタディ:プレフィルドシリンジ
- 章の概要
- プレフィルドシリンジ:市場情勢
- プレフィルドシリンジメーカー:市場情勢
- 将来の展望
第20章 SWOT分析
第21章 世界のオートインジェクター市場
- 章の概要
- 主要な前提と調査手法
- 世界のオートインジェクター市場、歴史的動向(2018年以降)および予測(2035年まで)
- シナリオ分析
- 主要な市場セグメンテーション
第22章 関節リウマチ用オートインジェクター市場
第23章 多発性硬化症用オートインジェクター市場
第24章 糖尿病用オートインジェクター市場
第25章 減量用オートインジェクター市場
第26章 アナフィラキシー用オートインジェクター市場
第27章 片頭痛治療用オートインジェクター市場
第28章 その他の適応症用オートインジェクター市場
第29章 オートインジェクター市場、使用法別
第30章 オートインジェクター市場、投与経路別
第31章 オートインジェクター市場、送達分子タイプ別
第32章 オートインジェクター市場、作用機序タイプ別
第33章 オートインジェクター市場、容器の容量別
第34章 オートインジェクター市場、エンドユーザー別
第35章 オートインジェクター市場、標的適応症別
第36章 オートインジェクター市場、主要地域別
第37章 結論
第38章 エグゼクティブ洞察
第39章 付録1:表形式データ
第40章 付録2:企業および組織の一覧
List of Tables
- Table 5.1 Comparison of Self-Injection Devices
- Table 5.2 Benefits of Autoinjectors
- Table 6.1 Commercially Available Cartridges
- Table 6.2 Classification of Syringes
- Table 6.3 Commercially Available Glass Syringes
- Table 6.4 Commercially Available Plastic Syringes
- Table 6.5 Commercially Available Vials
- Table 6.6 Comparison of Fabrication Material Used for Primary Drug Containers
- Table 7.1 Autoinjectors: Overall Market Landscape
- Table 7.2 Autoinjectors: Information on Requirement of Needle, Volume of Container, Type of Dose Delivered and Route of Administration
- Table 7.3 Autoinjectors: Information on Type of Actuation Mechanism, Type of Feedback Mechanism, Availability of Connectivity Feature and Target Indication
- Table 7.4 Autoinjectors: Information on Type of Molecule Delivered and End-user
- Table 7.5 Autoinjector Manufacturers: Overall Market Landscape
- Table 10.1 Autoinjector Manufacturers: List of Companies Profiled
- Table 10.2 Antares Pharma: Company Snapshot
- Table 10.3 Antares Pharma: Autoinjectors Portfolio
- Table 10.4 Halozyme (Parent Company of Antares Pharma): Recent Developments and Future Outlook
- Table 10.5 Elcam Medical: Company Snapshot
- Table 10.6 Elcam Medical: Autoinjectors Portfolio
- Table 10.7 Jiangsu Delfu Medical Device: Company Snapshot
- Table 10.8 Jiangsu Delfu Medical Device: Autoinjectors Portfolio
- Table 10.9 Oval Medical Technologies: Company Snapshot
- Table 10.10 Oval Medical Technologies: Autoinjectors Portfolio
- Table 10.11 Oval Medical Technologies: Recent Developments and Future Outlook
- Table 10.12 Owen Mumford: Company Snapshot
- Table 10.13 Owen Mumford: Autoinjectors Portfolio
- Table 10.14 Owen Mumford: Recent Developments and Future Outlook
- Table 10.15 PreciHealth: Company Snapshot
- Table 10.16 PreciHealth: Autoinjectors Portfolio
- Table 10.17 PreciHealth: Recent Developments and Future Outlook
- Table 10.18 Recipharm: Company Snapshot
- Table 10.19 Recipharm: Autoinjectors Portfolio
- Table 10.20 Recipharm: Recent Developments and Future Outlook
- Table 10.21 SHL Medical: Company Snapshot
- Table 10.22 SHL Medical: Autoinjectors Portfolio
- Table 10.23 SHL Medical: Recent Developments and Future Outlook
- Table 10.24 Union Medico: Company Snapshot
- Table 10.25 Union Medico: Autoinjectors Portfolio
- Table 10.26 Ypsomed: Company Snapshot
- Table 10.27 Ypsomed: Autoinjectors Portfolio
- Table 10.28 Ypsomed: Recent Developments and Future Outlook
- Table 11.1 Autoinjectors: List of Partnerships and Collaborations, Since 2016
- Table 12.1 Patent Analysis: Top CPC Sections
- Table 12.2 Patent Analysis: Top CPC Symbols
- Table 12.3 Patent Analysis: Top CPC Codes
- Table 12.4 Patent Analysis: Summary of Benchmarking Analysis
- Table 12.5 Patent Analysis: Categorization based on Weighted Valuation Scores
- Table 12.6 Patent Portfolio: List of Leading Patents (by Highest Relative Valuation)
- Table 12.7 Patent Portfolio: List of Leading Patents (by Number of Citations)
- Table 13.1 Drug Device Combinations: Commercialized Autoinjectors
- Table 13.2 Commercialized Autoinjector Combination Products: Information on Requirement of Needle, Volume of Container, Injection Time and Type of Dose Delivered
- Table 13.3 Commercialized Autoinjector Combination Products: Information on Route of Administration, Type of Actuation Mechanism, Type of Feedback Mechanism and
- Table 13.4 Commercialized Autoinjector Combination Products: Information on Target Therapeutic Indication and Severity of Indication
- Table 13.5 Commercialized Autoinjector Combination Products: Information on Type of Molecule Delivered, End-user and Target Population
- Table 13.6 Commercialized Autoinjector Combination Products: List of Developers
- Table 14.1 Drug Device Combinations: Early and Late Stage Autoinjectors
- Table 14.2 Early and Late Stage Autoinjector Combination Products: Information on Dose Strength, Target Indication and Severity of Indication
- Table 14.3 Early and Late Stage Autoinjector Combination Products: Information on Type of Molecule Delivered and End-user
- Table 14.4 Early and Late Stage Autoinjector Combination Products: Information on Target Population and Gender of Target Population
- Table 14.5 Early and Late Stage Autoinjector Combination Products: List of Developers
- Table 15.1 Autoinjector Combination Products Developers: List of Companies Profiled
- Table 15.2 Amgen: Company Snapshot
- Table 15.3 Amgen: Autoinjector Combination Product Portfolio
- Table 15.4 ChemProtect.SK: Company Snapshot
- Table 15.5 ChemProtect.SK: Autoinjector Combination Product Portfolio
- Table 15.6 Eli Lilly and Company: Company Snapshot
- Table 15.7 Eli Lilly and Company: Autoinjector Combination Product Portfolio
- Table 15.8 Kindeva Drug Delivery: Company Snapshot
- Table 15.9 Kindeva Drug Delivery: Autoinjector Combination Product Portfolio
- Table 15.10 Merck: Company Snapshot
- Table 15.11 Merck: Autoinjector Combination Product Portfolio
- Table 15.12 Novartis: Company Snapshot
- Table 15.13 Novartis: Autoinjector Combination Product Portfolio
- Table 15.14 Novo Nordisk: Company Snapshot
- Table 15.15 Novo Nordisk: Autoinjector Combination Product Portfolio
- Table 15.16 Sanofi: Company Snapshot
- Table 15.17 Sanofi: Autoinjector Combination Product Portfolio
- Table 15.18 Teva Pharmaceutical Industries: Company Snapshot
- Table 15.19 Teva Pharmaceutical Industries: Autoinjector Combination Product Portfolio
- Table 16.1 Autoinjectors: List of Key Opinion Leaders
- Table 17.1 Anaphylaxis: Commercially Available Autoinjector Combination Products
- Table 17.2 Multiple Sclerosis: Commercially Available Autoinjector Combination Products
- Table 17.3 Migraine: Commercially Available Autoinjector Combination Products
- Table 17.4 Rheumatoid Arthritis: Commercially Available Autoinjector Combination Products
- Table 18.1 List of Medical Device CMOs Offering Services for Drug Delivery Devices
- Table 18.2 Medical Device CMOs Offering Services for Drug Delivery Devices: Information on Production Services
- Table 19.1 Prefilled Syringes: List of Products
- Table 19.2 Prefilled Syringes: List of Manufacturers
- Table 39.1 Autoinjectors: Distribution by Stage of Development
- Table 39.2 Autoinjectors: Distribution by Usability
- Table 39.3 Autoinjectors: Distribution by Type of Primary Drug Container
- Table 39.4 Autoinjectors: Distribution by Requirement of Needle
- Table 39.5 Autoinjectors: Distribution by Volume of Container
- Table 39.6 Autoinjectors: Distribution by Type of Dose Delivered
- Table 39.7 Autoinjectors: Distribution by Route of Administration
- Table 39.8 Autoinjectors: Distribution by Type of Actuation Mechanism
- Table 39.9 Autoinjectors: Distribution by Type of Feedback Mechanism
- Table 39.10 Autoinjectors: Distribution by Availability of Connectivity Feature
- Table 39.11 Autoinjectors: Distribution by Target Indication
- Table 39.12 Autoinjectors: Distribution by Type of Molecule Delivered
- Table 39.13 Autoinjectors: Distribution by End-user
- Table 39.14 Autoinjector Manufacturers: Distribution by Year of Establishment
- Table 39.15 Autoinjector Manufacturers: Distribution by Company Size
- Table 39.16 Autoinjector Manufacturers: Distribution by Location of Headquarters (Region)
- Table 39.17 Autoinjector Manufacturers: Distribution by Location of Headquarters (Country)
- Table 39.18 Autoinjector Manufacturers: Distribution by Company Size and Location of Headquarters
- Table 39.19 Autoinjector Manufacturers: Distribution by Type of Company
- Table 39.20 Most Active Players: Distribution by Number of Autoinjectors
- Table 39.21 Antares Pharma: Annual Revenues, Since FY 2017 (USD Billion)
- Table 39.22 Recipharm: Annual Revenues, Since FY 2018 (SEK Billion)
- Table 39.23 Ypsomed: Annual Revenues, Since FY 2018 (CHF Billion)
- Table 39.24 Partnerships and Collaborations: Cumulative Year-wise Trend, Since 2019
- Table 39.25 Partnerships and Collaborations: Distribution by Type of Partnership
- Table 39.26 Partnerships and Collaborations: Distribution by Year and Type of Partnership
- Table 39.27 Partnerships and Collaborations: Distribution by Type of Product
- Table 39.28 Partnerships and Collaborations: Distribution by Type of Partner
- Table 39.29 Most Active Players: Distribution by Number of Partnerships
- Table 39.90 Partnerships and Collaborations: Intracontinental and Intercontinental Deals
- Table 39.31 Partnerships and Collaborations: International and Local Deals
- Table 39.32 Patent Analysis: Distribution by Type of Patent
- Table 39.33 Patent Analysis: Distribution by Patent Publication Year, Since 2019
- Table 39.34 Patent Analysis: Distribution by Type of Patent and Publication Year
- Table 39.35 Patent Analysis: Distribution by Patent Application Year, Since Pre-2014
- Table 39.36 Patent Analysis: Distribution by Patent Jurisdiction
- Table 39.37 Patent Analysis: Cumulative Year-wise Distribution by Type of Applicant, Since 2019
- Table 39.38 Leading Industry Players: Distribution by Number of Patents
- Table 39.39 Leading Individual Assignees: Distribution by Number of Patents
- Table 39.40 Patent Analysis: Distribution by Patent Age
- Table 39.41 Patent Analysis: Patent Valuation
- Table 39.42 Commercialized Autoinjector Combination Products: Distribution by Approval Year
- Table 39.43 Commercialized Autoinjector Combination Products: Distribution by Usability
- Table 39.44 Commercialized Autoinjector Combination Products: Distribution by Type of Primary Drug Container
- Table 39.45 Commercialized Autoinjector Combination Products: Distribution by Requirement of Needle
- Table 39.46 Commercialized Autoinjector Combination Products: Distribution by Volume of Container
- Table 39.47 Commercialized Autoinjector Combination Products: Distribution by Injection Time
- Table 39.48 Commercialized Autoinjector Combination Products: Distribution by Type of Dose Delivered
- Table 39.49 Commercialized Autoinjector Combination Products: Distribution by Route of Administration
- Table 39.50 Commercialized Autoinjector Combination Products: Distribution by Type of Actuation Mechanism
- Table 39.51 Commercialized Autoinjector Combination Products: Distribution by Type of Feedback Mechanism
- Table 39.52 Commercialized Autoinjector Combination Products: Distribution by Availability of Connectivity Feature
- Table 39.53 Commercialized Autoinjector Combination Products: Distribution by Target Indication
- Table 39.54 Commercialized Autoinjector Combination Products: Distribution by Severity of Indication
- Table 39.55 Commercialized Autoinjector Combination Products: Distribution by Type of Molecule Delivered
- Table 39.56 Commercialized Autoinjector Combination Products: Distribution by End-user
- Table 39.57 Commercialized Autoinjector Combination Products: Distribution by Target Population
- Table 39.58 Commercialized Autoinjector Combination Product Developers: Distribution by Year of Establishment
- Table 39.59 Commercialized Autoinjector Combination Product Developers: Distribution by Company Size
- Table 39.60 Commercialized Autoinjector Combination Product Developers: Distribution by Location of Headquarters (Region)
- Table 39.61 Commercialized Autoinjector Combination Product Developers: Distribution by Location of Headquarters (Country)
- Table 39.62 Commercialized Autoinjector Combination Product Developers: Distribution by Company Size and Location of Headquarters
- Table 39.63 Commercialized Autoinjector Combination Product Developers: Distribution by Type of Company
- Table 39.64 Most Active Players: Distribution by Number of Commercialized Autoinjector Combination Products
- Table 39.65 Early and Late Stage Autoinjector Combination Products: Distribution by Stage of Development
- Table 39.66 Early and Late Stage Autoinjector Combination Products: Distribution by Route of Administration
- Table 39.67 Early and Late Stage Autoinjector Combination Products: Distribution by Dose Strength
- Table 39.68 Early and Late Stage Autoinjector Combination Products: Distribution by Target Indication
- Table 39.69 Early and Late Stage Autoinjector Combination Products: Distribution by Severity of Indication
- Table 39.70 Early and Late Stage Autoinjector Combination Products: Distribution by Type of Molecule Delivered
- Table 39.71 Early and Late Stage Autoinjector Combination Products: Distribution by End- user
- Table 39.72 Early and Late Stage Autoinjector Combination Products: Distribution by Target Population
- Table 39.73 Early and Late Stage Autoinjector Combination Products: Distribution by Gender of Target Population
- Table 39.74 Early and Late Stage Autoinjector Combination Product Developers: Distribution by Year of Establishment
- Table 39.75 Early and Late Stage Autoinjector Combination Product Developers: Distribution by Company Size
- Table 39.76 Early and Late Stage Autoinjector Combination Product Developers: Distribution by Location of Headquarters
- Table 39.77 Early and Late Stage Autoinjector Combination Product Developers: Distribution by Company Size and Location of Headquarters
- Table 39.78 Early and Late Stage Autoinjector Combination Product Developers: Distribution by Type of Company
- Table 39.79 KOL Analysis: Distribution by Role of KOLs
- Table 39.80 KOL Analysis: Distribution by Type of Sponsor Organization
- Table 39.81 KOL Analysis: Distribution by Affiliated Organization
- Table 39.82 KOL Analysis: Distribution by Target Indication
- Table 39.83 KOL Analysis: Distribution by Location of Clinical Trials
- Table 39.84 Most Prominent KOLs: Distribution by Roots Analysis Score
- Table 39.85 Medical Device CMOs Offering Services for Drug Delivery Devices: Distribution by Year of Establishment
- Table 39.86 Medical Device CMOs Offering Services for Drug Delivery Devices: Distribution by Company Size
- Table 39.87 Medical Device CMOs Offering Services for Drug Delivery Devices: Distribution by Location of Headquarters
- Table 39.88 Medical Device CMOs Offering Services for Drug Delivery Devices: Distribution by Types of Services
- Table 39.89 Prefilled Syringes: Distribution by Type of Barrel Fabrication Material
- Table 39.90 Prefilled Syringes: Distribution by Number of Barrel Chambers
- Table 39.91 Prefilled Syringes: Distribution by Type of Needle System
- Table 39.92 Prefilled Syringe Manufacturers: Distribution by Year of Establishment
- Table 39.93 Prefilled Syringe Manufacturers: Distribution by Company Size
- Table 39.94 Prefilled Syringe Manufacturers: Distribution by Location of Headquarters
- Table 39.99 Global Autoinjectors Market, Historical Trends (Since 2018) (USD Billion)
- Table 39.100 Global Autoinjectors Market, Forecasted Estimates (Till 2035), Conservative, Base and Optimistic Scenario (USD Billion)
- Table 39.101 Disposable Autoinjectors Market for Rheumatoid Arthritis, Historical Trends (Since 2018) (USD Billion)
- Table 39.102 Disposable Autoinjectors Market for Rheumatoid Arthritis, Forecasted Estimates (Till 2035), Conservative, Base and Optimistic Scenario (USD Billion)
- Table 39.103 Reusable Autoinjectors Market for Rheumatoid Arthritis, Historical Trends (Since 2018) (USD Billion)
- Table 39.104 Reusable Autoinjectors Market for Rheumatoid Arthritis, Forecasted Estimates (Till 2035), Conservative, Base and Optimistic Scenario (USD Billion)
- Table 39.105 Subcutaneous Autoinjectors Market for Rheumatoid Arthritis, Historical Trends (Since 2018) (USD Billion)
- Table 39.106 Subcutaneous Autoinjectors Market for Rheumatoid Arthritis, Forecasted Estimates (Till 2035), Conservative, Base and Optimistic Scenario (USD Billion)
- Table 39.107 Subcutaneous / Intravenous Autoinjectors Market for Rheumatoid Arthritis, Historical Trends (Since 2018) (USD Billion)
- Table 39.108 Subcutaneous / Intravenous Autoinjectors Market for Rheumatoid Arthritis, Forecasted Estimates (Till 2035), Conservative, Base and Optimistic Scenario (USD Billion)
- Table 39.109 Intravenous Autoinjectors Market for Rheumatoid Arthritis, Historical Trends (Since 2018) (USD Billion)
- Table 39.110 Intravenous Autoinjectors Market for Rheumatoid Arthritis, Forecasted Estimates (Till 2035), Conservative, Base and Optimistic Scenario (USD Billion)
- Table 39.111 Proteins Autoinjectors Market for Rheumatoid Arthritis, Historical Trends (Since 2018) (USD Billion)
- Table 39.112 Proteins Autoinjectors Market for Rheumatoid Arthritis, Forecasted Estimates (Till 2035), Conservative, Base and Optimistic Scenario (USD Billion)
- Table 39.113 Antibody-based Autoinjectors Market for Rheumatoid Arthritis, Historical Trends (Since 2018) (USD Billion)
- Table 39.114 Antibody-based Autoinjectors Market for Rheumatoid Arthritis, Forecasted Estimates (Till 2035), Conservative, Base and Optimistic Scenario (USD Billion)
- Table 39.115 Small Molecule-based Autoinjectors Market for Rheumatoid Arthritis, Historical Trends (Since 2018) (USD Billion)
- Table 39.116 Small Molecule-based Autoinjectors Market for Rheumatoid Arthritis, Forecasted Estimates (Till 2035), Conservative, Base and Optimistic Scenario (USD Billion)
- Table 39.117 Disposable Autoinjectors Market for Multiple Sclerosis, Historical Trends (Since 2018) (USD Billion)
- Table 39.118 Disposable Autoinjectors Market for Multiple Sclerosis, Forecasted Estimates (Till 2035), Conservative, Base and Optimistic Scenario (USD Billion)
- Table 39.119 Reusable Autoinjectors Market for Multiple Sclerosis, Historical Trends (Since 2018) (USD Billion)
- Table 39.120 Reusable Autoinjectors Market for Multiple Sclerosis, Forecasted Estimates (Till 2035), Conservative, Base and Optimistic Scenario (USD Billion)
- Table 39.121 Subcutaneous Autoinjectors Market for Multiple Sclerosis, Historical Trends (Since 2018) (USD Billion)
- Table 39.122 Subcutaneous Autoinjectors Market for Multiple Sclerosis, Forecasted Estimates (Till 2035), Conservative, Base and Optimistic Scenario (USD Billion)
- Table 39.123 Intramuscular Autoinjectors Market for Multiple Sclerosis, Historical Trends (Since 2018) (USD Billion)
- Table 39.124 Intramuscular Autoinjectors Market for Multiple Sclerosis, Forecasted Estimates (Till 2035), Conservative, Base and Optimistic Scenario (USD Billion)
- Table 39.125 Protein-based Autoinjectors Market for Multiple Sclerosis, Historical Trends (Since 2018) (USD Billion)
- Table 39.126 Protein-based Autoinjectors Market for Multiple Sclerosis, Forecasted Estimates (Till 2035), Conservative, Base and Optimistic Scenario (USD Billion)
- Table 39.127 Peptide-based Autoinjectors Market for Multiple Sclerosis, Historical Trends (Since 2018) (USD Billion)
- Table 39.128 Peptide-based Autoinjectors Market for Multiple Sclerosis, Forecasted Estimates (Till 2035), Conservative, Base and Optimistic Scenario (USD Billion)
- Table 39.129 Antibody-based Autoinjectors Market for Multiple Sclerosis, Historical Trends (Since 2018) (USD Billion)
- Table 39.130 Antibody-based Autoinjector Market for Multiple Sclerosis, Forecasted Estimates (Till 2035), Conservative, Base and Optimistic Scenario (USD Billion)
- Table 39.131 Disposable Autoinjectors Market for Diabetes, Historical Trends (Since 2018) (USD Billion)
- Table 39.132 Disposable Autoinjectors Market for Diabetes, Forecasted Estimates (Till 2035), Conservative, Base and Optimistic Scenario (USD Billion)
- Table 39.133 Reusable Autoinjectors Market for Diabetes, Historical Trends (Since 2018) (USD Billion)
- Table 39.134 Reusable Autoinjectors Market for Diabetes, Forecasted Estimates (Till 2035), Conservative, Base and Optimistic Scenario (USD Billion)
- Table 39.135 Subcutaneous Autoinjectors Market for Diabetes, Historical Trends (Since 2018) (USD Billion)
- Table 39.136 Subcutaneous Autoinjectors Market for Diabetes, Forecasted Estimates (Till 2035), Conservative, Base and Optimistic Scenario (USD Billion)
- Table 39.137 Protein-based Autoinjectors Market for Diabetes, Historical Trends (Since 2018) (USD Billion)
- Table 39.138 Protein-based Autoinjectors Market for Diabetes, Forecasted Estimates (Till 2035), Conservative, Base and Optimistic Scenario (USD Billion)
- Table 39.139 Antibody-based Autoinjectors Market for Diabetes, Historical Trends (Since 2018) (USD Billion)
- Table 39.140 Antibody-based Autoinjectors Market for Diabetes, Forecasted Estimates (Till 2035), Conservative, Base and Optimistic Scenario (USD Billion)
- Table 39.141 Disposable Autoinjectors Market for Anaphylaxis, Historical Trends (Since 2018) (USD Billion)
- Table 39.142 Disposable Autoinjectors Market for Anaphylaxis, Forecasted Estimates (Till 2035), Conservative, Base and Optimistic Scenario (USD Billion)
- Table 39.143 Intramuscular Autoinjectors Market for Anaphylaxis, Historical Trends (Since 2018) (USD Billion)
- Table 39.144 Intramuscular Autoinjectors Market for Anaphylaxis, Forecasted Estimates (Till 2035), Conservative, Base and Optimistic Scenario (USD Billion)
- Table 39.145 Subcutaneous / Intramuscular Autoinjectors Market for Anaphylaxis, Historical Trends (Since 2018) (USD Billion)
- Table 39.146 Subcutaneous / Intramuscular Autoinjectors Market for Anaphylaxis, Forecasted Estimates (Till 2035), Conservative, Base and Optimistic Scenario (USD Billion)
- Table 39.147 Small Molecule-based Autoinjectors Market for Anaphylaxis, Historical Trends (Since 2018) (USD Billion)
- Table 39.148 Small Molecule-based Autoinjectors Market for Anaphylaxis, Forecasted Estimates (Till 2035), Conservative, Base and Optimistic Scenario (USD Billion)
- Table 39.149 Disposable Autoinjectors Market for Weight Loss, Historical Trends (Since 2018) (USD Billion)
- Table 39.150 Disposable Autoinjectors Market for Weight Loss, Forecasted Estimates (Till 2035), Conservative, Base and Optimistic Scenario (USD Billion)
- Table 39.151 Subcutaneous Autoinjectors Market for Weight Loss, Historical Trends (Since 2018) (USD Billion)
- Table 39.152 Subcutaneous Autoinjectors Market for Weight Loss, Forecasted Estimates (Till 2035), Conservative, Base and Optimistic Scenario (USD Billion)
- Table 39.153 Peptide-based Autoinjectors Market for Weight Loss, Historical Trends (Since 2018) (USD Billion)
- Table 39.154 Peptide-based Autoinjectors Market for Weight Loss, Forecasted Estimates (Till 2035), Conservative, Base and Optimistic Scenario (USD Billion)
- Table 39.155 Small Molecule-based Autoinjectors Market for Anaphylaxis, Historical Trends (Since 2018) (USD Billion)
- Table 39.156 Small Molecule-based Autoinjectors Market for Anaphylaxis, Forecasted Estimates (Till 2035), Conservative, Base and Optimistic Scenario (USD Billion)
- Table 39.157 Disposable Autoinjectors Market for Migraine, Historical Trends (Since 2018) (USD Billion)
- Table 39.158 Disposable Autoinjectors Market for Migraine, Forecasted Estimates (Till 2035), Conservative, Base and Optimistic Scenario (USD Billion)
- Table 39.159 Subcutaneous Autoinjectors Market for Migraine, Historical Trends (Since 2018) (USD Billion)
- Table 39.160 Subcutaneous Autoinjectors Market for Migraine, Forecasted Estimates (Till 2035), Conservative, Base and Optimistic Scenario (USD Billion)
- Table 39.161 Antibody-based Autoinjectors Market for Migraine, Historical Trends (Since 2018) (USD Billion)
- Table 39.162 Antibody-based Autoinjectors Market for Migraine, Forecasted Estimates (Till 2035), Conservative, Base and Optimistic Scenario (USD Billion)
- Table 39.163 Protein-based Autoinjectors Market for Migraine, Historical Trends (Since 2018) (USD Billion)
- Table 39.164 Protein-based Autoinjectors Market for Migraine, Forecasted Estimates (Till 2035), Conservative, Base and Optimistic Scenario (USD Billion)
- Table 39.165 Small Molecule-based Autoinjectors Market for Migraine, Historical Trends (Since 2018) (USD Billion)
- Table 39.166 Small Molecule-based Autoinjectors Market for Migraine, Forecasted Estimates (Till 2035), Conservative, Base and Optimistic Scenario (USD Billion)
- Table 39.167 Disposable Autoinjectors Market for Other Indications, Historical Trends (Since 2018) (USD Billion)
- Table 39.168 Disposable Autoinjectors Market for Other Indications, Forecasted Estimates (Till 2035), Conservative, Base and Optimistic Scenario (USD Billion)
- Table 39.169 Reusable Autoinjectors Market for Other Indications, Historical Trends (Since 2018) (USD Billion)
- Table 39.170 Reusable Autoinjectors Market for Other Indications, Forecasted Estimates (Till 2035), Conservative, Base and Optimistic Scenario (USD Billion)
- Table 39.171 Subcutaneous Autoinjectors Market for Other Indications, Historical Trends (Since 2018) (USD Billion)
- Table 39.172 Subcutaneous Autoinjectors Market for Other Indications, Forecasted Estimates (Till 2035), Conservative, Base and Optimistic Scenario (USD Billion)
- Table 39.173 Subcutaneous / Intramuscular Autoinjectors Market for Other Indications, Historical Trends (Since 2018) (USD Billion)
- Table 39.174 Subcutaneous / Intramuscular Autoinjectors Market for Other Indications, Forecasted Estimates (Till 2035), Conservative, Base and Optimistic Scenario (USD Billion)
- Table 39.175 Subcutaneous / Intravenous Autoinjectors Market for Other Indications, Historical Trends (Since 2018) (USD Billion)
- Table 39.176 Subcutaneous / Intravenous Autoinjectors Market for Other Indications, Forecasted Estimates (Till 2035), Conservative, Base and Optimistic Scenario (USD Billion)
- Table 39.177 Antibody-based Autoinjectors Market for Other Indications, Historical Trends (Since 2018) (USD Billion)
- Table 39.178 Antibody-based Autoinjectors Market for Other Indications, Forecasted Estimates (Till 2035), Conservative, Base and Optimistic Scenario (USD Billion)
- Table 39.179 Protein-based Autoinjectors Market for Other Indications, Historical Trends (Since 2018) (USD Billion)
- Table 39.180 Protein-based Autoinjectors Market for Other Indications, Forecasted Estimates (Till 2035), Conservative, Base and Optimistic Scenario (USD Billion)
- Table 39.181 Small Molecule-based Autoinjectors Market for Other Indications, Historical Trends (Since 2018) (USD Billion)
- Table 39.182 Small Molecule-based Autoinjectors Market for Other Indications, Forecasted Estimates (Till 2035), Conservative, Base and Optimistic Scenario (USD Billion)
- Table 39.183 Other Molecule-based Autoinjectors Market for Other Indications, Historical Trends (Since 2018) (USD Billion)
- Table 39.184 Other Molecule-based Autoinjectors Market for Other Indications, Forecasted Estimates (Till 2035), Conservative, Base and Optimistic Scenario (USD Billion)
- Table 39.185 Autoinjectors Market: Distribution by Usability
- Table 39.186 Disposable Autoinjectors Market, Historical Trends (Since 2018) (USD Billion)
- Table 39.187 Disposable Autoinjectors Market, Forecasted Estimates (Till 2035), Conservative, Base and Optimistic Scenario (USD Billion)
- Table 39.188 Reusable Autoinjectors Market, Historical Trends (Since 2018) (USD Billion)
- Table 39.189 Reusable Autoinjectors Market, Forecasted Estimates (Till 2035), Conservative, Base and Optimistic Scenario (USD Billion)
- Table 39.190 Autoinjectors Market: Distribution by Route of Administration
- Table 39.191 Autoinjectors Market for Subcutaneous Administration, Historical Trends (Since 2018) (USD Billion)
- Table 39.192 Autoinjectors Market for Subcutaneous Administration, Forecasted Estimates (Till 2035), Conservative, Base and Optimistic Scenario (USD Billion)
- Table 39.193 Autoinjectors Market for Intramuscular Administration, Historical Trends (Since 2018) (USD Billion)
- Table 39.194 Autoinjectors Market for Intramuscular Administration, Forecasted Estimates (Till 2035), Conservative, Base and Optimistic Scenario (USD Billion)
- Table 39.195 Autoinjectors Market for Intravenous Administration, Historical Trends (Since 2018) (USD Billion)
- Table 39.196 Autoinjectors Market for Intravenous Administration t, Forecasted Estimates (Till 2035), Conservative, Base and Optimistic Scenario (USD Billion)
- Table 39.197 Autoinjectors Market for Subcutaneous / Intramuscular Administration, Historical Trends (Since 2018) (USD Billion)
- Table 39.198 Autoinjectors Market for Subcutaneous / Intramuscular Administration, Forecasted Estimates (Till 2035), Conservative, Base and Optimistic Scenario (USD Billion)
- Table 39.199 Autoinjectors Market for Subcutaneous / Intravenous Administration, Historical Trends (Since 2018) (USD Billion)
- Table 39.200 Autoinjectors Market for Subcutaneous / Intravenous Administration, Forecasted Estimates (Till 2035), Conservative, Base and Optimistic Scenario (USD Billion)
- Table 39.201 Autoinjectors Market: Distribution by Type of Molecule Delivered
- Table 39.202 Autoinjectors Market for Proteins, Historical Trends (Since 2018) (USD Billion)
- Table 39.203 Autoinjectors Market for Proteins, Forecasted Estimates (Till 2035), Conservative, Base and Optimistic Scenario (USD Billion)
- Table 39.204 Autoinjectors Market for Small Molecules, Historical Trends (Since 2018) (USD Billion)
- Table 39.205 Autoinjectors Market for Small Molecules, Forecasted Estimates (Till 2035), Conservative, Base and Optimistic Scenario (USD Billion)
- Table 39.206 Autoinjectors Market for Antibodies, Historical Trends (Since 2018) (USD Billion)
- Table 39.207 Autoinjectors Market for Antibodies, Forecasted Estimates (Till 2035), Conservative, Base and Optimistic Scenario (USD Billion)
- Table 39.208 Autoinjectors Market for Peptides, Historical Trends (Since 2018) (USD Billion)
- Table 39.209 Autoinjectors Market for Peptides, Forecasted Estimates (Till 2035), Conservative, Base and Optimistic Scenario (USD Billion)
- Table 39.210 Autoinjectors Market for Other Molecules, Historical Trends (Since 2018) (USD Billion)
- Table 39.211 Autoinjectors Market for Other Molecules, Forecasted Estimates (Till 2035), Conservative, Base and Optimistic Scenario (USD Billion)
- Table 39.212 Autoinjectors Market: Distribution by Type of Actuation Mechanism
- Table 39.213 Autoinjectors Market for Manual Actuation, Historical Trends (Since 2018) (USD Billion)
- Table 39.214 Autoinjectors Market for Manual Actuation, Forecasted Estimates (Till 2035), Conservative, Base and Optimistic Scenario (USD Billion)
- Table 39.215 Autoinjectors Market for Automatic Actuation, Historical Trends (Since 2018) (USD Billion)
- Table 39.216 Autoinjectors Market for Automatic Actuation, Forecasted Estimates (Till 2035), Conservative, Base and Optimistic Scenario (USD Billion)
- Table 39.217 Autoinjectors Market: Distribution by Volume of Container
- Table 39.218 Autoinjectors Market for Less than 1 mL Volume, Historical Trends (Since 2018) (USD Billion)
- Table 39.219 Autoinjectors Market for Less than 1 mL Volume, Forecasted Estimates (Till 2035), Conservative, Base and Optimistic Scenario (USD Billion)
- Table 39.220 Autoinjectors Market for 1-2 mL Volume, Historical Trends (Since 2018) (USD Billion)
- Table 39.221 Autoinjectors Market for 1-2 mL Volume, Forecasted Estimates (Till 2035), Conservative, Base and Optimistic Scenario (USD Billion)
- Table 39.222 Autoinjectors Market for More than 2 mL Volume, Historical Trends (Since 2018) (USD Billion)
- Table 39.223 Autoinjectors Market for More than 2 mL Volume, Forecasted Estimates (Till 2035), Conservative, Base and Optimistic Scenario (USD Billion)
- Table 39.224 Autoinjectors Market: Distribution by End-user
- Table 39.225 Autoinjectors Market for Home Care, Historical Trends (Since 2018) (USD Billion)
- Table 39.226 Autoinjectors Market for Home Care, Forecasted Estimates (Till 2035), Conservative, Base and Optimistic Scenario (USD Billion)
- Table 39.227 Autoinjectors Market for Hospitals and Clinics, Historical Trends (Since 2018) (USD Billion)
- Table 39.228 Autoinjectors Market for Hospitals and Clinics, Forecasted Estimates (Till 2035), Conservative, Base and Optimistic Scenario (USD Billion)
- Table 39.229 Autoinjectors Market for Ambulatory Surgical Centers, Historical Trends (Since 2018) (USD Billion)
- Table 39.230 Autoinjectors Market for Ambulatory Surgical Centers, Forecasted Estimates (Till 2035), Conservative, Base and Optimistic Scenario (USD Billion)
- Table 39.231 Autoinjectors Market: Distribution by Target Indication
- Table 39.232 Autoinjectors Market for Rheumatoid Arthritis, Historical Trends (Since 2018) (USD Billion)
- Table 39.233 Autoinjectors Market for Rheumatoid Arthritis, Forecasted Estimates (Till 2035)
List of Figures
- Figure 2.1 Research Methodology: Project Methodology
- Figure 2.2 Research Methodology: Secondary Research: Data Sources
- Figure 3.1 Lessons Learnt from Past Recessions
- Figure 4.1 Executive Summary: Autoinjectors Market Overview
- Figure 4.2 Executive Summary: Partnerships and Collaborations
- Figure 4.3 Executive Summary: Patent Analysis
- Figure 4.4 Executive Summary: Commercialized Autoinjector Combination Products Market Overview
- Figure 4.5 Executive Summary: Early and Late Stage Autoinjector Combination Products Market Overview
- Figure 4.6 Executive Summary: Market Forecast and Opportunity Analysis
- Figure 5.1 Drug Delivery Systems
- Figure 5.2 Types of Self-Injection Devices
- Figure 5.3 Components of Autoinjector
- Figure 5.4 Cartridge Based Autoinjectors versus Prefilled Syringe Based Autoinjectors
- Figure 5.5 Classification of Autoinjectors
- Figure 7.1 Autoinjectors: Distribution by Stage of Development
- Figure 7.2 Autoinjectors: Distribution by Usability
- Figure 7.3 Autoinjectors: Distribution by Type of Primary Drug Container
- Figure 7.4 Autoinjectors: Distribution by Requirement of Needle
- Figure 7.5 Autoinjectors: Distribution by Volume of Container
- Figure 7.6 Autoinjectors: Distribution by Type of Dose Delivered
- Figure 7.7 Autoinjectors: Distribution by Route of Administration
- Figure 7.8 Autoinjectors: Distribution by Type of Actuation Mechanism
- Figure 7.9 Autoinjectors: Distribution by Type of Feedback Mechanism
- Figure 7.10 Autoinjectors: Distribution by Availability of Connectivity Feature
- Figure 7.11 Autoinjectors: Distribution by Target Indication
- Figure 7.12 Autoinjectors: Distribution by Type of Molecule Delivered
- Figure 7.13 Autoinjectors: Distribution by End-user
- Figure 7.14 Autoinjector Manufacturers: Distribution by Year of Establishment
- Figure 7.15 Autoinjector Manufacturers: Distribution by Company Size
- Figure 7.16 Autoinjector Manufacturers: Distribution by Location of Headquarters (Region)
- Figure 7.17 Autoinjector Manufacturers: Distribution by Location of Headquarters (Country)
- Figure 7.18 Autoinjector Manufacturers: Distribution by Company Size and Location of Headquarters
- Figure 7.19 Autoinjector Manufacturers: Distribution by Type of Company
- Figure 7.20 Most Active Players: Distribution by Number of Autoinjectors
- Figure 8.1 Product Competitiveness Analysis: Disposable Autoinjectors
- Figure 8.2 Product Competitiveness Analysis: Reusable Autoinjectors
- Figure 9.1 Brand Positioning Analysis: Competitive Advantage
- Figure 9.2 Brand Positioning Analysis: Reasons to Believe
- Figure 9.3 Brand Positioning Framework: Owen Mumford
- Figure 9.4 Brand Positioning Framework: Ypsomed
- Figure 9.5 Brand Positioning Framework: Elcam Medical
- Figure 9.6 Brand Positioning Framework: SHL Medical
- Figure 9.7. Brand Positioning Framework: Union Medico
- Figure 9.8 Brand Positioning Framework: Antares Pharma
- Figure 9.9 Brand Positioning Framework: PreciHealth
- Figure 9.10 Brand Positioning Framework: Jiangsu Delfu Medical Device
- Figure 9.11 Brand Positioning Framework: Oval Medical Technologies
- Figure 9.12 Brand Positioning Framework: Recipharm
- Figure 10.1 Antares Pharma: Annual Revenues, Since FY 2017 (USD Billion)
- Figure 10.2 Recipharm: Annual Revenues, Since FY 2018 (SEK Billion)
- Figure 10.3 Ypsomed: Annual Revenues, Since FY 2018 (CHF Billion)
- Figure 11.1 Partnerships and Collaborations: Cumulative Year-wise Trend, Since Pre-2019
- Figure 11.2 Partnerships and Collaborations: Distribution by Type of Partnership
- Figure 11.3 Partnerships and Collaborations: Distribution by Year and Type of Partnership
- Figure 11.4 Partnerships and Collaborations: Distribution by Type of Product
- Figure 11.5 Partnerships and Collaborations: Distribution by Type of Partner
- Figure 11.6 Most Active Players: Distribution by Number of Partnerships
- Figure 11.7 Partnerships and Collaborations: Intracontinental and Intercontinental Deals
- Figure 11.8 Partnerships and Collaborations: International and Local Deals
- Figure 12.1 Patent Analysis: Distribution by Type of Patent
- Figure 12.2 Patent Analysis: Cumulative Distribution by Patent Publication Year, Since 2019
- Figure 12.3 Patent Analysis: Distribution by Type of Patent and Publication Year
- Figure 12.4 Patent Analysis: Distribution by Patent Application Year, Since Pre-2014
- Figure 12.5 Patent Analysis: Distribution by Patent Jurisdiction
- Figure 12.6 Patent Analysis: Distribution by CPC Symbols
- Figure 12.7 Patent Analysis: Cumulative Year-wise Distribution by Type of Applicant, Since 2019
- Figure 12.8 Leading Industry Players: Distribution by Number of Patents
- Figure 12.9 Leading Individual Assignees: Distribution by Number of Patents
- Figure 12.10 Patent Benchmarking Analysis: Distribution of Leading Industry Players by Patent Characteristics (Top CPC Codes)
- Figure 12.11 Patent Benchmarking Analysis: Distribution of Patent Characteristics (CPC Codes) by Leading Industry Players
- Figure 12.12 Patent Analysis: Distribution by Patent Age
- Figure 12.13 Patent Valuation
- Figure 13.1 Commercialized Autoinjector Combination Products: Distribution by Approval Year
- Figure 13.2 Commercialized Autoinjector Combination Products: Distribution by Usability
- Figure 13.3 Commercialized Autoinjector Combination Products: Distribution by Type of Primary Drug Container
- Figure 13.4 Commercialized Autoinjector Combination Products: Distribution by Requirement of Needle
- Figure 13.5 Commercialized Autoinjector Combination Products: Distribution by Volume of Container
- Figure 13.6 Commercialized Autoinjector Combination Products: Distribution by Injection Time
- Figure 13.7 Commercialized Autoinjector Combination Products: Distribution by Type of Dose Delivered
- Figure 13.8 Commercialized Autoinjector Combination Products: Distribution by Route of Administration
- Figure 13.9 Commercialized Autoinjector Combination Products: Distribution by Type of Actuation Mechanism
- Figure 13.10 Commercialized Autoinjector Combination Products: Distribution by Type of Feedback Mechanism
- Figure 13.11 Commercialized Autoinjector Combination Products: Distribution by Availability of Connectivity Feature
- Figure 13.12 Commercialized Autoinjector Combination Products: Distribution by Target Indication
- Figure 13.13 Commercialized Autoinjector Combination Products: Distribution by Severity of Indication
- Figure 13.14 Commercialized Autoinjector Combination Products: Distribution by Type of Molecule Delivered
- Figure 13.15 Commercialized Autoinjector Combination Products: Distribution by End-user
- Figure 13.16 Commercialized Autoinjector Combination Products: Distribution by Target Population
- Figure 13.17 Commercialized Autoinjector Combination Product Developers: Distribution by Year of Establishment
- Figure 13.18 Commercialized Autoinjector Combination Product Developers: Distribution by Company Size
- Figure 13.19 Commercialized Autoinjector Combination Product Developers: Distribution by Location of Headquarters
- Figure 13.20 Commercialized Autoinjector Combination Product Developers: Distribution by Company Size and Location of
- Figure 13.21 Commercialized Autoinjector Combination Product Developers: Distribution by Type of Company
- Figure 13.22 Most Active Players: Distribution by Number of Commercialized Autoinjector Combination Products
- Figure 14.1 Early and Late Stage Autoinjector Combination Products: Distribution by Stage of Development
- Figure 14.2 Early and Late Stage Autoinjector Combination Products: Distribution by Route of Administration
- Figure 14.3 Early and Late Stage Autoinjector Combination Products: Distribution by
- Figure 14.4 Early and Late Stage Autoinjector Combination Products: Distribution by Target Indication
- Figure 14.5 Early and Late Stage Autoinjector Combination Products: Distribution by Severity of Indication
- Figure 14.6 Early and Late Stage Autoinjector Combination Products: Distribution by Type of Molecule Delivered
- Figure 14.7 Early and Late Stage Autoinjector Combination Products: Distribution by End- user
- Figure 14.8 Early and Late Stage Autoinjector Combination Products: Distribution by Target Population
- Figure 14.9 Early and Late Stage Autoinjector Combination Products: Distribution by Gender of Target Population
- Figure 14.10 Early and Late Stage Autoinjector Combination Product Developers: Distribution by Year of Establishment
- Figure 14.11 Early and Late Stage Autoinjector Combination Product Developers: Distribution by Company Size
- Figure 14.12 Early and Late Stage Autoinjector Combination Product Developers: Distribution by Location of Headquarters
- Figure 14.13 Early and Late Stage Autoinjector Combination Product Developers: Distribution by Company Size and Location of Headquarters
- Figure 14.14 Early and Late Stage Autoinjector Combination Product Developers: Distribution by Type of Company
- Figure 16.1 KOL Analysis: Distribution by Role of KOLs
- Figure 16.2 KOL Analysis: Distribution by Type of Sponsor Organization
- Figure 16.3 KOL Analysis: Distribution by Affiliated Organization
- Figure 16.4 KOL Analysis: Distribution by Target Indication
- Figure 16.5 KOL Analysis: Distribution by Location of Clinical Trials
- Figure 16.6 Most Prominent KOLs: Distribution by Activeness, Expertise and Strength of KOL
- Figure 16.7 Most Prominent KOLs: Distribution by Roots Analysis Score
- Figure 18.1 Challenges Associated with Medical Device Manufacturing
- Figure 18.2 Services Offered by Medical Device CMOs
- Figure 18.3 Advantages of Outsourcing to CMOs
- Figure 18.4 Risks Associated with Outsourcing to CMOs
- Figure 18.5 Medical Device CMOs Offering Services for Drug Delivery Devices: Distribution by Year of Establishment
- Figure 18.6 Medical Device CMOs Offering Services for Drug Delivery Devices: Distribution by Company Size
- Figure 18.7 Medical Device CMOs Offering Services for Drug Delivery Devices: Distribution by Location of Headquarters
- Figure 18.8 Medical Device CMOs Offering Services for Drug Delivery Devices: Distribution by Types of Services
- Figure 19.1 Prefilled Syringes: Distribution by Type of Barrel Fabrication Material
- Figure 19.2 Prefilled Syringes: Distribution by Number of Barrel Chambers
- Figure 19.3 Prefilled Syringes: Distribution by Type of Needle System
- Figure 19.4 Prefilled Syringe Manufacturers: Distribution by Year of Establishment
- Figure 19.5 Prefilled Syringe Manufacturers: Distribution by Company Size
- Figure 19.6 Prefilled Syringe Manufacturers: Distribution by Location of Headquarters
- Figure 20.1 Autoinjectors: SWOT Analysis
- Figure 20.2 Comparison of SWOT Factors: Harvey Ball Analysis
- Figure 21.1 Global Autoinjectors Market, Historical Trends (Since 2018) and Forecasted Estimates (Till 2035) (USD Billion)
- Figure 21.2 Global Autoinjectors Market, Forecasted Estimates (Till 2035): Conservative Scenario (USD Billion)
- Figure 21.3 Global Autoinjectors Market, Forecasted Estimates (Till 2035): Optimistic Scenario (USD Billion)
- Figure 22.1 Disposable Autoinjectors Market for Rheumatoid Arthritis, Historical Trends (Since 2018) and Forecasted Estimates (Till 2035) (USD Billion)
- Figure 22.2 Reusable Autoinjectors Market for Rheumatoid Arthritis, Historical Trends (Since 2018) and Forecasted Estimates (Till 2035) (USD Billion)
- Figure 22.3 Subcutaneous Autoinjectors Market for Rheumatoid Arthritis, Historical Trends (Since 2018) and Forecasted Estimates (Till 2035) (USD Billion)
- Figure 22.4 Subcutaneous / Intravenous Autoinjectors Market for Rheumatoid Arthritis, Historical Trends (Since 2018) and Forecasted Estimates (Till 2035) (USD Billion)
- Figure 22.5 Intravenous Autoinjectors Market for Rheumatoid Arthritis, Historical Trends (Since 2018) and Forecasted Estimates (Till 2035) (USD Billion)
- Figure 22.6 Protein-based Autoinjectors Market for Rheumatoid Arthritis, Historical Trends (Since 2018) and Forecasted Estimates (Till 2035) (USD Billion)
- Figure 22.7 Antibody-based Autoinjectors Market for Rheumatoid Arthritis, Historical Trends (Since 2018) and Forecasted Estimates (Till 2035) (USD Billion)
- Figure 22.8 Small Molecule-based Autoinjectors Market for Rheumatoid Arthritis, Historical Trends (Since 2018) and Forecasted Estimates (Till 2035) (USD Billion)
- Figure 23.1 Disposable Autoinjectors Market for Multiple Sclerosis, Historical Trends (Since 2018) and Forecasted Estimates (Till 2035) (USD Billion)
- Figure 23.2 Reusable Autoinjectors Market for Multiple Sclerosis, Historical Trends (Since 2018) and Forecasted Estimates (Till 2035) (USD Billion)
- Figure 23.3 Subcutaneous Autoinjectors Market for Multiple Sclerosis, Historical Trends (Since 2018) and Forecasted Estimates (Till 2035) (USD Billion)
- Figure 23.4 Intramuscular Autoinjectors Market for Multiple Sclerosis, Historical Trends (Since 2018) and Forecasted Estimates (Till 2035) (USD Billion)
- Figure 23.5 Protein-based Autoinjectors Market for Multiple Sclerosis, Historical Trends (Since 2018) and Forecasted Estimates (Till 2035) (USD Billion)
- Figure 23.6 Peptide-based Autoinjectors Market for Multiple Sclerosis, Historical Trends (Since 2018) and Forecasted Estimates (Till 2035) (USD Billion)
- Figure 23.7 Antibody-based Autoinjectors Market for Multiple Sclerosis, Historical Trends (Since 2018) and Forecasted Estimates (Till 2035) (USD Billion)
- Figure 24.1 Disposable Autoinjectors Market for Diabetes, Historical Trends (Since 2018) and Forecasted Estimates (Till 2035) (USD Billion)
- Figure 24.2 Reusable Autoinjectors Market for Diabetes, Historical Trends (Since 2018) and Forecasted Estimates (Till 2035) (USD Billion)
- Figure 24.3 Subcutaneous Autoinjectors Market for Diabetes, Historical Trends (Since 2018) and Forecasted Estimates (Till 2035) (USD Billion)
- Figure 24.4 Protein-based Autoinjectors Market for Diabetes, Historical Trends (Since 2018) and Forecasted Estimates (Till 2035)
- Figure 24.5 Antibody-based Autoinjectors Market for Diabetes, Historical Trends (Since 2018) and Forecasted Estimates (Till 2035) (USD Billion)
- Figure 25.1 Disposable Autoinjectors Market for Weight Loss, Historical Trends (Since 2018) and Forecasted Estimates (Till 2035) (USD Billion)
- Figure 25.2 Subcutaneous Autoinjectors Market for Weight Loss, Historical Trends (Since 2018) and Forecasted Estimates (Till 2035) (USD Billion)
- Figure 25.3 Peptide-based Autoinjectors Market for Weight Loss, Historical Trends (Since 2018) and Forecasted Estimates (Till 2035) (USD Billion)
- Figure 25.4 Small Molecule-based Autoinjectors Market for Weight Loss, Historical Trends (Since 2018) and Forecasted Estimates (Till 2035) (USD Billion)
- Figure 26.1 Disposable Autoinjectors Market for Anaphylaxis, Historical Trends (Since 2018) and Forecasted Estimates (Till 2035) (USD Billion)
- Figure 26.2 Subcutaneous / Intramuscular Autoinjectors Market for Anaphylaxis, Historical Trends (Since 2018) and Forecasted Estimates (Till 2035) (USD Billion)
- Figure 26.3 Intramuscular Autoinjectors Market for Anaphylaxis, Historical Trends (Since 2018) and Forecasted Estimates (Till 2035) (USD Billion)
- Figure 26.4 Small Molecule-based Autoinjectors Market for Anaphylaxis, Historical Trends (Since 2018) and Forecasted Estimates (Till 2035) (USD Billion)
- Figure 27.1 Disposable Autoinjectors Market for Migraine, Historical Trends (Since 2018) and Forecasted Estimates (Till 2035) (USD Billion)
- Figure 27.2 Subcutaneous Autoinjectors Market for Migraine, Historical Trends (Since 2018) and Forecasted Estimates (Till 2035) (USD Billion)
- Figure 27.3 Antibody-based Autoinjectors Market for Migraine, Historical Trends (Since 2018) and Forecasted Estimates (Till 2035) (USD Billion)
- Figure 27.4 Protein-based Autoinjectors Market for Migraine, Historical Trends (Since 2018) and Forecasted Estimates (Till 2035)
- Figure 27.5 Small Molecule-based Autoinjectors Market for Migraine, Historical Trends (Since 2018) and Forecasted Estimates (Till 2035) (USD Billion)
- Figure 28.1 Disposable Autoinjectors Market for Other Indications, Historical Trends (Since 2018) and Forecasted Estimates (Till 2035) (USD Billion)
- Figure 28.2 Reusable Autoinjectors Market for Other Indications, Historical Trends (Since 2018) and Forecasted Estimates (Till 2035) (USD Billion)
- Figure 28.3 Subcutaneous Autoinjectors Market for Other Indications, Historical Trends (Since 2018) and Forecasted Estimates (Till 2035) (USD Billion)
- Figure 28.4 Subcutaneous / Intramuscular Autoinjectors Market for Other Indications, Historical Trends (Since 2018) and Forecasted Estimates (Till 2035) (USD Billion)
- Figure 28.5 Subcutaneous / Intravenous Autoinjectors Market for Other Indications, Historical Trends (Since 2018) and Forecasted Estimates (Till 2035) (USD Billion)
- Figure 28.6 Antibody-based Autoinjectors Market for Other Indications, Historical Trends (Since 2018) and Forecasted Estimates (Till 2035) (USD Billion)
- Figure 28.7 Protein-based Autoinjectors Market for Other Indications, Historical Trends (Since 2018) and Forecasted Estimates (Till 2035) (USD Billion)
- Figure 28.8 Small Molecule-based Autoinjectors Market for Other Indications, Historical Trends (Since 2018) and Forecasted Estimates (Till 2035) (USD Billion)
- Figure 28.9 Other Molecule-based Autoinjectors Market for Other Indications, Historical Trends (Since 2018) and Forecasted Estimates (Till 2035) (USD Billion)
- Figure 29.1 Autoinjectors Market: Distribution by Usability
- Figure 29.2 Disposable Autoinjectors Market: Historical Trends (Since 2018) and Forecasted Estimates (Till 2035) (USD Billion)
- Figure 29.3 Reusable Autoinjectors Market: Historical Trends (Since 2018) and Forecasted Estimates (Till 2035) (USD Billion)
- Figure 30.1 Autoinjectors Market: Distribution by Route of Administration
- Figure 30.2 Autoinjectors Market for Subcutaneous Administration: Historical Trends (Since 2018) and Forecasted Estimates (Till 2035) (USD Billion)
- Figure 30.3 Autoinjectors Market for Subcutaneous / Intramuscular Administration: Historical Trends (Since 2018) and Forecasted Estimates (Till 2035) (USD Billion)
- Figure 30.4 Autoinjectors Market for Subcutaneous / Intravenous Administration: Historical Trends (Since 2018) and Forecasted Estimates (Till 2035) (USD Billion)
- Figure 30.5 Autoinjectors Market for Intramuscular Administration: Historical Trends (Since 2018) and Forecasted Estimates (Till 2035) (USD Billion)
- Figure 30.6 Autoinjectors Market for Intravenous Administration: Historical Trends (Since 2018) and Forecasted Estimates (Till 2035) (USD Billion)
- Figure 31.1 Autoinjectors Market: Distribution by Type of Molecule Delivered
- Figure 31.2 Autoinjectors Market for Proteins: Historical Trends (Since 2018) and Forecasted Estimates (Till 2035) (USD Billion)
- Figure 31.3 Autoinjectors Market for Antibodies: Historical Trends (Since 2018) and Forecasted Estimates (Till 2035) (USD Billion)
- Figure 31.4 Autoinjectors Market for Small Molecules: Historical Trends (Since 2018) and Forecasted Estimates (Till 2035) (USD Billion)
- Figure 31.5 Autoinjectors Market for Peptides: Historical Trends (Since 2018) and Forecasted Estimates (Till 2035) (USD Billion)
- Figure 31.5 Autoinjectors Market for Other Molecules: Historical Trends (Since 2018) and Forecasted Estimates (Till 2035) (USD Billion)
- Figure 32.1 Autoinjectors Market: Distribution by Type of Actuation Mechanism
- Figure 32.2 Autoinjectors Market for Manual Actuation: Historical Trends (Since 2018) and Forecasted Estimates (Till 2035) (USD Billion)
- Figure 32.3 Autoinjectors Market for Automatic Actuation: Historical Trends (Since 2018) and Forecasted Estimates (Till 2035) (USD Billion)
- Figure 33.1 Autoinjectors Market: Distribution by Volume of Container
- Figure 33.2 Autoinjectors Market for Containers of Less than 1 mL Volume: Historical Trends (Since 2018) and Forecasted Estimates (Till 2035) (USD Billion)
- Figure 33.3 Autoinjectors Market for Containers of 1-2 mL Volume: Historical Trends (Since 2018) and Forecasted Estimates (Till 2035) (USD Billion)
- Figure 33.4 Autoinjectors Market for Containers of More than 2 mL Volume: Historical Trends (Since 2018) and Forecasted Estimates (Till 2035) (USD Billion)
- Figure 34.1 Autoinjectors Market: Distribution by End-user
- Figure 34.2 Autoinjectors Market for Home Care: Historical Trends (Since 2018) and Forecasted Estimates (Till 2035) (USD Billion)
- Figure 34.3 Autoinjectors Market for Hospitals and Clinics: Historical Trends (Since 2018) and Forecasted Estimates (Till 2035) (USD Billion)
- Figure 34.4 Autoinjectors Market for Ambulatory Surgical Centers: Historical Trends (Since 2018) and Forecasted Estimates (Till 2035) (USD Billion)
- Figure 35.1 Autoinjectors Market: Distribution by Target Indication
- Figure 35.2 Autoinjectors Market for Rheumatoid Arthritis: Historical Trends (Since 2018) and Forecasted Estimates (Till 2035) (USD Billion)
- Figure 35.3 Autoinjectors Market for Multiple Sclerosis: Historical Trends (Since 2018) and Forecasted Estimates (Till 2035) (USD Billion)
- Figure 35.4 Autoinjectors Market for Diabetes: Historical Trends (Since 2018) and Forecasted Estimates (Till 2035) (USD Billion)
- Figure 35.5 Autoinjectors Market for Anaphylaxis: Historical Trends (Since 2018) and Forecasted Estimates (Till 2035) (USD Billion)
- Figure 35.6 Autoinjectors Market for Weight Loss: Historical Trends (Since 2018) and Forecasted Estimates (Till 2035) (USD Billion)
- Figure 35.7 Autoinjectors Market for Migraine: Historical Trends (Since 2018) and Forecasted Estimates (Till 2035) (USD Billion)
- Figure 35.8 Autoinjectors Market for Other Indications: Historical Trends (Since 2018) and Forecasted Estimates (Till 2035) (USD Billion)
- Figure 36.1 Autoinjectors Market: Distribution by Key Geographical Regions
- Figure 36.2 Autoinjectors Market in North America: Historical Trends (Since 2018) and Forecasted Estimates (Till 2035) (USD Billion)
- Figure 36.3 Autoinjectors Market in Europe: Historical Trends (Since 2018) and Forecasted Estimates (Till 2035) (USD Billion)
- Figure 36.4 Autoinjectors Market in Asia-Pacific: Historical Trends (Since 2018) and Forecasted Estimates (Till 2035) (USD Billion)
- Figure 36.5 Autoinjectors Market in Middle East and North Africa: Historical Trends (Since 2018) and Forecasted Estimates (Till 2035) (USD Billion)
- Figure 36.6 Autoinjectors Market in Latin America: Historical Trends (Since 2018) and Forecasted Estimates (Till 2035) (USD Billion)
Figure 37.1 Concluding Remarks: Autoinjectors Market Overview
- Figure 37.2 Concluding Remarks: Partnerships and Collaborations
- Figure 37.3 Concluding Remarks: Patent Analysis
Figure 37.4 Concluding Remarks: Commercialized Autoinjector Combination Product Market Overview
Figure 37.5 Concluding Remarks: Early and Late Stage Autoinjector Combination Product Market Overview
- Figure 37.6 Concluding Remarks: Market
Sizing and Opportunity Analysis
GLOBAL AUTOINJECTORS MARKET (5TH EDITION): OVERVIEW
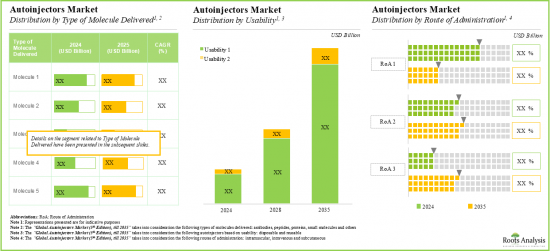
As per Roots Analysis, the global autoinjectors market is estimated to grow from USD 90.6 billion in the current year to USD 175.9 billion by 2035, at a CAGR of 6.2% during the forecast period, till 2035.
The market sizing and opportunity analysis has been segmented across the following parameters:
Usability
- Disposable
- Reusable
Route of Administration
- Subcutaneous
- Intravenous
- Intramuscular
Type of Molecule Delivered
- Antibodies
- Peptides
- Proteins
- Small Molecules
- Others
Type of Actuation Mechanism
- Manual
- Automatic
Volume of Container
- Less than 1 mL
- 1-2 mL
- More than 2 mL
End-user
- Ambulatory Surgical Centers
- Home Care
- Hospitals and Clinics
Target Indication
- Anaphylaxis
- Diabetes
- Migraine
- Multiple Sclerosis
- Rheumatoid Arthritis
- Weight Loss
- Others
Key Geographical Regions
- North America
- Europe
- Asia-Pacific
- Middle East and North Africa
- Latin America
GLOBAL AUTOINJECTORS MARKET (5TH EDITION): GROWTH AND TRENDS
The global rise in chronic diseases, such as diabetes, multiple sclerosis, rheumatoid arthritis and severe allergies, has driven a pressing requirement for a more efficient, innovative and user-friendly drug delivery systems. It is worth highlighting that the impact of these chronic conditions on patients is substantial, as the associated costs and complications can escalate dramatically over a period. As a result, the medical industry has made significant efforts in developing novel drug delivery devices, including autoinjectors.
Autoinjectors are automatic injection devices that are used for the delivery of drugs through the subcutaneous or intramuscular routes. These are primarily spring-driven devices that use prefilled syringes or cartridges as primary containers. By complete or partial automation of the drug delivery process, these devices make the dosing process more convenient. Owing to which, autoinjectors have demonstrated significant potential as the next generation of patient-centric devices, capable of safe and reliable delivery of injectables. Further, the advent of novel biologics is driving the demand for injection of higher viscosities of drugs in larger volumes. Consequently, many device manufacturers, such as BD Medical and SHL, have introduced large volume autoinjectors. Additionally, the new autoinjector devices, which are currently under development, are capable of addressing the specific needs and wants of individual patients. These are designed to enable adjustments in the dosage or features of the device based upon the requirements of the user. In fact, connecting the injectors digitally to various products and platforms is expected to improve adherence and quality of life for the patients. Given these advancements in autoinjectors, the growing need for effective drug delivery systems and disease management can be efficiently addressed in the future.
GLOBAL AUTOINJECTORS MARKET: KEY INSIGHTS
The report delves into the current state of the global autoinjectors market and identifies potential growth opportunities within the industry. Some key findings from the report include:
1. Presently, close to 150 autoinjectors are available / being manufactured by various players, globally; the majority of the autoinjector manufacturers are headquartered in North America.
2. Most of the commercially available autoinjectors are suitable for subcutaneous administration; these autoinjectors are integrated with audible and visual indicators and can deliver a myriad of molecules.
3. More than 50% of the deals in the autoinjectors domain were inked in the last three years; further, most of the intercontinental as well as intracontinental partnerships have been signed by players based in Europe.
4. Since 2019, more than 1,100 patents related to autoinjectors have been filed by / granted to various stakeholders to protect the intellectual property generated within this domain.
5. Several scientists, clinicians and industry veterans, affiliated to academic / medical / commercial organizations, are spearheading research related to autoinjectors.
6. Nearly 160 autoinjector combination products (with different drugs) have been approved by regulatory authorities, across the world; further, close to 60% of autoinjector combination product developers are very large players.
7. Around 75% of the commercialized autoinjector combination products are compatible with syringes; notably, majority of these combination products are intended to be used in homecare settings by adults.
8. More than 70 autoinjector combination products intended for the treatment of various indications are currently being evaluated in early and late stages of development; further, most of the developers for these products are publicly listed companies.
9. Around 90% of the early and late-stage combination products are currently in different clinical phases of development; majority of these are being developed for the treatment of chronic conditions (primarily rheumatoid arthritis).
10. The autoinjectors market is anticipated to grow at a steady rate; notably, disposable autoinjectors are likely to capture over 88% market share in 2024 as they eliminate the need for manual loading of medication and have lower risk of contamination.
11. Autoinjectors with automatic actuation mechanism are anticipated to grow at faster pace (~7%) till 2035; further, the autoinjectors intended for delivering drugs targeting rheumatoid arthritis are likely to dominate the current market.
12. The autoinjectors suitable for home care are likely to capture majority share in the market during the forecasted period; Asia-Pacific is anticipated to grow at higher rate in this domain, till 2035.
GLOBAL AUTOINJECTORS MARKET (5TH EDITION): KEY SEGMENTS
Disposable Autoinjectors Occupies the Largest Share of the Global Autoinjectors Market
Based on the usability, the market is segmented into disposable autoinjectors and reusable autoinjectors. At present, disposable autoinjectors segment hold the maximum share of the global autoinjectors market. This trend is likely to remain the same in the forthcoming years.
Autoinjectors for Intravenous Drug Delivery is the Fastest Growing Segment of the Global Autoinjectors Market During the Forecast Period
Based on the route of administration, the market is segmented into subcutaneous, intramuscular and intravenous routes. Currently, autoinjectors used for subcutaneous drug delivery capture the highest proportion of the global autoinjectors market. It is worth highlighting that the global autoinjector market for intravenous autoinjector segment is likely to grow at a relatively higher CAGR.
Proteins Segment Occupy the Largest Share of the Global Autoinjectors Market by Type of Molecule Delivered
Based on the type of molecule delivered, the market is segmented into antibodies, peptides, proteins, small molecules and others. At present, autoinjectors designed for the delivery of proteins hold the maximum share of the global autoinjectors market. This trend is likely to change in the foreseeable future.
By Type of Actuation Mechanism, Autoinjectors with Automatic Actuation Mechanism is the Fastest Growing Segment of the Global Autoinjectors Market During the Forecast Period
Based on the type of actuation mechanism, the market is segmented into manual and automatic actuation mechanism based autoinjectors. At present, autoinjectors equipped with automatic actuation mechanisms capture the highest proportion of the global autoinjectors market. Further, it is worth highlighting that the global autoinjector market for automatic actuation mechanism based autoinjectors is likely to grow at a relatively higher CAGR.
Autoinjectors with Volume Containers of 1-2 mL Account for the Largest Share of the Global Autoinjectors Market
Based on the volume of containers, the market is segmented into autoinjectors with less than 1 ml, 1-2 ml and more than 2 ml storing volumes. Currently, autoinjectors with a drug storing capacity of 1-2 ml of a drug hold the maximum share of the global autoinjectors market. This trend is likely to remain the same in the coming decade.
By End-user, Home Care Segment is Likely to Dominate the Global Autoinjectors Market
Based on the end-user, the market is segmented into home care, hospitals and clinics and ambulatory surgical centers. At present autoinjectors used in the home care segment hold the maximum share of the global autoinjectors market. Additionally, this segment is likely to grow at a faster pace, compared to the other segments.
Autoinjectors Designed for the Treatment of Rheumatoid Arthritis Occupy the Largest Share of the Global Autoinjectors Market
Based on the target indication, the market is segmented into anaphylaxis, diabetes, migraine, multiple sclerosis, rheumatoid arthritis, weight loss and other indications. Whilst rheumatoid arthritis target indication segment is expected to be the primary driver of the overall market, it is worth highlighting that the global autoinjectors market for weight loss segment is likely to grow at a relatively higher CAGR.
North America Accounts for the Largest Share of the Market
Based on key geographical regions, the market is segmented into North America, Europe, Asia-Pacific, Latin America, and Middle East and North Africa. The majority share is expected to be captured by players based in North America and Europe.
Example Players in the Global Autoinjectors Market
- Amgen
- Antares Pharma
- ChemProtect.SK
- Elcam Medical
- Eli Lilly and Company
- Jiangsu Delfu Medical Device
- Kindeva Drug Delivery
- Merck
- Novartis
- Novo Nordisk
- Oval Medical Technologies
- Owen Mumford
- PreciHealth
- Recipharm
- Sanofi
- SHL Medical
- Teva Pharmaceuticals
- Union Medico
- Ypsomed
GLOBAL AUTOINJECTORS MARKET: RESEARCH COVERAGE
- Market Sizing and Opportunity Analysis: The report features an in-depth analysis of the global autoinjectors market, focusing on key market segments, including [A] usability, [B] route of administration, [C] type of molecule delivered, [D] type of actuation mechanism, [E] volume of container, [F] end-user, [G] target indication and [H] key geographical regions.
- Autoinjectors Market Landscape: A comprehensive evaluation of autoinjectors, considering various parameters, such as [A] status of development, [B] usability, [C] type of primary drug container, [D] requirement of needle, [E] volume of container, [F] type of dose delivered, [G] route of administration, [H] type of actuation mechanism, [I] type of feedback mechanism, [J] availability of connectivity feature, [K] target indication, [L] type of molecule delivered and [M] end-user. Additionally, a comprehensive evaluation of the companies engaged in manufacturing autoinjectors, based on several relevant parameters, such as [N] year of establishment, [O] company size (in terms of employee count), [P] location of headquarters, [Q] type of company and [R] most active players (in terms of number of autoinjectors manufactured).
- Product Competitiveness Analysis: A comprehensive competitive analysis of autoinjectors, examining factors, such as [A] manufacturer strength and [B] product strength.
- Brand Positioning Analysis: A comprehensive brand positioning assessment framework of the autoinjector manufacturers focusing on the current perceptions of their proprietary brands across various device types. This analysis evaluates autoinjector manufacturers by various parameters, including [A] strength and diversity of product portfolio, [B] routes of administration, [C] type of actuation mechanism, [D] type of feedback mechanism, [E] geographical presence / reach and [F] supplier strength of each player.
- Company Profiles of Autoinjectors Manufacturers: In-depth profiles of key autoinjector manufacturers, focusing on [A] company overviews, [B] financial information (if available), [C] autoinjectors portfolio, [D] manufacturing capabilities and facilities, [E] recent developments and [F] an informed future outlook.
- Partnerships and Collaborations: An insightful analysis of the deals inked by stakeholders in the global autoinjectors market, based on several parameters, such as [A] year of partnership, [B] type of partnership, [C] type of partner, [D] most active players (in terms of the number of partnerships signed) and [E] geographical distribution of partnership activity.
- Patent Analysis: An in-depth analysis of patents filed / granted till date in the autoinjectors domain, based on various relevant parameters, such as [A] type of patent, [B] patent publication year, [C] patent application year, [D] patent jurisdiction, [E] CPC symbols, [F] type of applicant, [G] most active players, [H] patent benchmarking and [I] patent valuation analysis.
- Commercialized Autoinjector Combination Product Market Landscape: A comprehensive evaluation of commercialized autoinjector combination products, considering various parameters, such as [A] approval year, [B] usability, [C] type of primary drug container, [D] requirement of needle, [E] volume of container, [F] injection time, [G] type of dose delivered, [H] route of administration, [I] type of actuation mechanism, [J] type of feedback mechanism, [K] availability of connectivity feature, [L] target indication, [M] severity of indication, [N] type of molecule delivered, [O] end-user and [P] target population. Additionally, a comprehensive evaluation of the companies engaged in manufacturing commercialized autoinjector combination product, based on several relevant parameters, such as [Q] year of establishment, [R] company size (in terms of employee count), [S] location of headquarters, [T] type of company and [U] most active players (in terms of number of commercialized autoinjector combination products developed).
- Early and Late Stage Autoinjectors Combination Product Market Landscape: A comprehensive evaluation of early and late stage autoinjector combination products, considering various parameters, such as [A] stage of development, [B] route of administration, [C] dose strength, [D] target indication, [E] severity of indication, [F] type of molecule delivered, [G] end-user, [H] target population and [I] gender of target population. Additionally, a comprehensive evaluation of the companies engaged in manufacturing early and late stage autoinjector combination products, based on several relevant parameters, such as [J] year of establishment, [K] company size (in terms of employee count), [L] location of headquarters and [M] type of company.
- Short Company Profiles of Autoinjector Combination Product Manufacturers: Short profiles of key autoinjector combination product manufacturers, focusing on [A] company overviews and [B] autoinjector product portfolio.
- Key Opinion Leaders (KOLs]: An in-depth analysis that emphasizes the key opinion leaders in this domain, considering various parameters, such as [A] role of KOL, [B] type of sponsor organization, [C] affiliated organization, [D] target indication, [E] location of clinical trials and [F] most prominent KOLs.
- Case Study 1: A general discussion on most commonly targeted indications, providing information on approved autoinjector combination products.
- Case Study 2: A general discussion on the role of medical device CMOs in the manufacturing and assembly of drug-delivery devices, including autoinjectors, based on several relevant parameters, such as [A] scale of operation and [B] types of services provided for production of devices.
- Case Study 3: A detailed assessment of prefilled syringes that are either commercialized or under development based on several relevant parameters, such as [A] type of barrel fabrication material, [B] number of barrel chambers, [C] type of needle system. In addition, the chapter provides a detailed analysis of prefilled syringe manufacturers, based on various parameters, such as [D] year of establishment, [E] company size (in terms of employee count) and [F] location of headquarters.
- SWOT Analysis: An analysis of industry affiliated trends, opportunities and challenges, which are likely to impact the evolution of autoinjectors market; it includes a Harvey ball analysis, assessing the relative impact of each SWOT parameter on industry dynamics.
KEY QUESTIONS ANSWERED IN THIS REPORT
- How many companies are currently engaged in this market?
- Which are the leading companies in this market?
- What factors are likely to influence the evolution of this market?
- What is the current and future market size?
- What is the CAGR of this market?
- How is the current and future market opportunity likely to be distributed across key market segments?
REASONS TO BUY THIS REPORT
- The report provides a comprehensive market analysis, offering detailed revenue projections of the overall market and its specific sub-segments. This information is valuable to both established market leaders and emerging entrants.
- Stakeholders can leverage the report to gain a deeper understanding of the competitive dynamics within the market. By analyzing the competitive landscape, businesses can make informed decisions to optimize their market positioning and develop effective go-to-market strategies.
- The report offers stakeholders a comprehensive overview of the market, including key drivers, barriers, opportunities, and challenges. This information empowers stakeholders to stay abreast of market trends and make data-driven decisions to capitalize on growth prospects.
ADDITIONAL BENEFITS
- Complimentary PPT Insights Packs
- Complimentary Excel Data Packs for all Analytical Modules in the Report
- 10% Free Content Customization
- Detailed Report Walkthrough Session with Research Team
- Free Updated report if the report is 6-12 months old or older
TABLE OF CONTENTS
1. PREFACE
- 1.1. Introduction
- 1.2. Market Share Insights
- 1.3. Key Marget Insights
- 1.4. Report Coverage
- 1.5. Key Questions Answered
- 1.6. Chapter Outlines
2. RESEARCH METHODOLOGY
- 2.1. Chapter Overview
- 2.2. Research Assumptions
- 2.3. Project Methodology
- 2.4. Forecast Methodology
- 2.5. Robust Quality Control
- 2.6. Key Market Segmentation
- 2.7. Key Considerations
- 2.7.1. Demographics
- 2.7.2. Economic Factors
- 2.7.3. Government Regulations
- 2.7.4. Supply Chain
- 2.7.5. COVID Impact
- 2.7.6. Market Access
- 2.7.7. Healthcare Policies
- 2.7.8. Industry Consolidation
3.ECONOMIC AND OTHER PROJECT SPECIFIC CONSIDERATIONS
- 3.1. Chapter Overview
- 3.2. Market Dynamics
- 3.2.1. Time Period
- 3.2.1.1. Historical Trends
- 3.2.1.2. Current and Future Estimates
- 3.2.2. Currency Coverage and Foreign Exchange Rate
- 3.2.2.1. Major Currencies Affecting the Market
- 3.2.2.2. Factors Affecting Currency Fluctuations and Foreign Exchange Rates
- 3.2.2.3. Impact of Foreign Exchange Rate Volatility on the Market
- 3.2.2.4. Strategies for Mitigating Foreign Exchange Risk
- 3.2.3. Trade Policies
- 3.2.3.1. Impact of Trade Barriers on the Market
- 3.2.3.2. Strategies for Mitigating the Risks Associated with Trade Barriers
- 3.2.4. Recession
- 3.2.4.1. Historical Analysis of Past Recessions and Lessons Learnt
- 3.2.4.2. Assessment of Current Economic Conditions and Potential Impact on the Market
- 3.2.5. Inflation
- 3.2.5.1. Measurement and Analysis of Inflationary Pressures in the Economy
- 3.2.5.2. Potential Impact of Inflation on the Market Evolution
- 3.2.1. Time Period
4. EXECUTIVE SUMMARY
5. INTRODUCTION
- 5.1. Chapter Overview
- 5.2. Types of Drug Delivery Systems
- 5.3. Drawbacks of Conventional Parenteral Delivery Systems
- 5.4. Emerging Trend of Self-Administration
- 5.4.1. Rising Burden of Chronic Diseases
- 5.4.2. Healthcare Cost Savings
- 5.4.3. Need for Immediate Treatment in Emergency Situations
- 5.4.4. Growth of Injectable Biologics Market
- 5.4.5. Addressing Key User Safety Requirements
- 5.5. Types of Self-Administration Devices
- 5.5.1. Prefilled Syringes
- 5.5.2. Pen-Injectors
- 5.5.3. Needle-Free Injectors
- 5.5.4. Large Volume Wearable Injectors
- 5.5.5. Autoinjectors
- 5.6. Overview of Autoinjectors
- 5.6.1. Components of Autoinjectors
- 5.6.2. Classification of Autoinjectors
- 5.6.2.1. Classification Based on Mechanism of Action
- 5.6.2.2. Classification Based on Usability
- 5.6.2.3. Classification Based on Type of Dose Delivered
- 5.6.3. Manufacturing / Packaging of Autoinjectors
- 5.6.4. Benefits of Autoinjectors
- 5.7. Regulatory Considerations
- 5.7.1. Medical Devices
- 5.7.2. Drug Device Combination Products
- 5.8. Future Perspectives
6. PRIMARY DRUG CONTAINERS USED IN AUTOINJECTORS
- 6.1. Chapter Overview
- 6.2. Types of Packaging
- 6.3. Primary Drug Containers
- 6.3.1. Role of Primary Drug Containers
- 6.3.2. Cartridges
- 6.3.2.1. Components of Cartridges
- 6.3.2.2. Types of Cartridges
- 6.3.2.2.1. Single Chamber Cartridge
- 6.3.2.2.2. Dual Chamber Cartridge
- 6.3.2.3. Commercially Available Cartridges
- 6.3.3. Syringes
- 6.3.3.1. Components of Syringes
- 6.3.3.2. Classification of Syringes
- 6.3.3.2.1. Classification Based on Barrel Fabrication Material
- 6.3.3.2.2. Classification Based on Number of Chambers in the Barrel
- 6.3.3.2.3. Classification Based on Type of Needle
- 6.3.4. Vials
- 6.3.4.1. Components of Vials
- 6.3.4.2. Commercially Available Vials
- 6.4. Comparison of Different Fabrication Materials
7. AUTOINJECTORS: MARKET OVERVIEW
- 7.1. Chapter Overview
- 7.2. Autoinjectors: Overall Market Landscape
- 7.2.1. Analysis by Stage of Development
- 7.2.2. Analysis by Usability
- 7.2.3. Analysis by Type of Primary Drug Container
- 7.2.4. Analysis by Requirement of Needle
- 7.2.5. Analysis by Volume of Container
- 7.2.6. Analysis by Type of Dose Delivered
- 7.2.7. Analysis by Route of Administration
- 7.2.8. Analysis by Type of Actuation Mechanism
- 7.2.9. Analysis by Type of Feedback Mechanism
- 7.2.10. Analysis by Availability of Connectivity Feature
- 7.2.11. Analysis by Target Indication
- 7.2.12. Analysis by Type of Molecule Delivered
- 7.2.13. Analysis by End-user
- 7.3. Autoinjector Manufacturers: Overall Market Landscape
- 7.3.1. Analysis by Year of Establishment
- 7.3.2. Analysis by Company Size
- 7.3.3. Analysis by Location of Headquarters
- 7.3.4. Analysis by Company Size and Location of Headquarters
- 7.3.5. Analysis by Type of Company
- 7.3.6. Most Active Players: Analysis by Number of Autoinjectors
8. PRODUCT COMPETITIVENESS ANALYSIS
- 8.1. Chapter Overview
- 8.2. Assumptions and Key Parameters
- 8.3. Methodology
- 8.4. Autoinjectors: Product Competitiveness Analysis
- 8.4.1. Disposable Autoinjectors
- 8.4.2. Reusable Autoinjectors
9. BRAND POSITIONING ANALYSIS
- 9.1. Chapter Overview
- 9.2. Assumptions and Key Parameters
- 9.3. Methodology
- 9.4. Autoinjector Manufacturers: Brand Positioning Framework
- 9.4.1. Brand Positioning Framework: Owen Mumford
- 9.4.2. Brand Positioning Framework: Ypsomed
- 9.4.3. Brand Positioning Framework: Elcam Medical
- 9.4.4. Brand Positioning Framework: SHL Medical
- 9.4.5. Brand Positioning Framework: Union Medico
- 9.4.6. Brand Positioning Framework: Antares Pharma
- 9.4.7. Brand Positioning Framework: PreciHealth
- 9.4.8. Brand Positioning Framework: Jiangsu Delfu Medical Device
- 9.4.9. Brand Positioning Framework: Oval Medical Technologies
- 9.4.10. Brand Positioning Framework: Recipharm
10. AUTOINJECTOR MANUFACTURERS: DETAILED COMPANY PROFILES
- 10.1. Chapter Overview
- 10.2. Antares Pharma
- 10.2.1. Company Overview
- 10.2.2. Financial Information
- 10.2.3. Autoinjectors Portfolio
- 10.2.4 Recent Developments and Future Outlook
- 10.3. Elcam Medical
- 10.3.1. Company Overview
- 10.3.2. Autoinjectors Portfolio
- 10.3.3. Recent Developments and Future Outlook
- 10.4. Jiangsu Delfu Medical Device
- 10.4.1. Company Overview
- 10.4.2. Autoinjectors Portfolio
- 10.4.3. Recent Developments and Future Outlook
- 10.5. Oval Medical Technologies
- 10.5.1. Company Overview
- 10.5.2. Autoinjectors Portfolio
- 10.5.3. Recent Developments and Future Outlook
- 10.6. Owen Mumford
- 10.6.1. Company Overview
- 10.6.2. Autoinjectors Portfolio
- 10.6.3. Recent Developments and Future Outlook
- 10.7. PreciHealth
- 10.7.1. Company Overview
- 10.7.2. Autoinjectors Portfolio
- 10.7.3. Recent Developments and Future Outlook
- 10.8. Recipharm
- 10.8.1. Company Overview
- 10.8.2. Financial Information
- 10.8.3. Autoinjectors Portfolio
- 10.8.4. Recent Developments and Future Outlook
- 10.9. SHL Medical
- 10.9.1. Company Overview
- 10.9.2. Autoinjectors Portfolio
- 10.9.3. Recent Developments and Future Outlook
- 10.10. Union Medico
- 10.10.1. Company Overview
- 10.10.2. Autoinjectors Portfolio
- 10.10.3. Recent Developments and Future Outlook
- 10.11. Ypsomed
- 10.11.1. Company Overview
- 10.11.2. Financial Information
- 10.11.3. Autoinjectors Portfolio
- 10.11.4. Recent Developments and Future Outlook
11. PARTNERSHIPS AND COLLABORATIONS
- 11.1. Chapter Overview
- 11.2. Partnership Models
- 11.3. Autoinjectors: Partnerships and Collaborations
- 11.3.1. Analysis by Year of Partnership
- 11.3.2. Analysis by Type of Partnership
- 11.3.3. Analysis by Year and Type of Partnership
- 11.3.4. Analysis by Type of Product
- 11.3.5. Analysis by Type of Partner
- 11.3.6. Most Active Players: Analysis by Number of Partnerships
- 11.3.7. Analysis by Geography
- 11.3.7.1. Intracontinental and Intercontinental Deals
- 11.3.7.2. International and Local Deals
12. PATENT ANALYSIS
- 12.1. Chapter Overview
- 12.2. Scope and Methodology
- 12.3. Autoinjectors: Patent Analysis
- 12.3.1. Analysis by Patent Publication Year
- 12.3.2. Analysis by Type of Patent and Patent Publication Year
- 12.3.3. Analysis by Patent Application Year
- 12.3.4. Analysis by Patent Jurisdiction
- 12.3.5. Analysis by CPC Symbols
- 12.3.6. Analysis by Type of Applicant
- 12.3.7. Leading Industry Players: Analysis by Number of Patents
- 12.3.8. Leading Individual Assignees: Analysis by Number of Patents
- 12.4. Patent Benchmarking Analysis
- 12.4.1. Analysis By Patent Characteristics
- 12.5. Patent Valuation
- 12.6. Leading Patents by Number of Citations
13. DRUG DEVICE COMBINATIONS: COMMERCIALIZED AUTOINJECTORS
- 13.1. Chapter Overview
- 13.2. Drug Device Combinations: Commercialized Autoinjectors
- 13.2.1. Analysis by Approval Year
- 13.2.2. Analysis by Usability
- 13.2.3. Analysis by Type of Primary Drug Container
- 13.2.4. Analysis by Requirement of Needle
- 13.2.5. Analysis by Volume of Container
- 13.2.6. Analysis by Injection Time
- 13.2.7. Analysis by Type of Dose Delivered
- 13.2.8. Analysis by Route of Administration
- 13.2.9. Analysis by Type of Actuation Mechanism
- 13.2.10. Analysis by Type of Feedback Mechanism
- 13.2.11. Analysis by Availability of Connectivity Feature
- 13.2.12. Analysis by Target Indication
- 13.2.13. Analysis by Severity of Indication
- 13.2.14. Analysis by Type of Molecule Delivered
- 13.2.15. Analysis by End-user
- 13.2.16. Analysis by Target Population
- 13.3. Drug Device Combinations: Commercialized Autoinjector Developers
- 13.3.1. Analysis by Year of Establishment
- 13.3.2. Analysis by Company Size
- 13.3.3. Analysis by Location of Headquarters
- 13.3.4. Analysis by Company Size and Location of Headquarters
- 13.3.5. Analysis by Type of Company
- 13.3.6. Most Active Players: Analysis by Number of Commercialized Autoinjector Combination Products
14. DRUG DEVICE COMBINATIONS: EARLY AND LATE STAGE AUTOINJECTORS
- 14.1. Chapter Overview
- 14.2. Drug Device Combinations: Early and Late Stage Autoinjectors
- 14.2.1. Analysis by Stage of Development
- 14.2.2. Analysis by Route of Administration
- 14.2.3. Analysis by Dose Strength
- 14.2.4. Analysis by Target Indication
- 14.2.5. Analysis by Severity of Indication
- 14.2.6. Analysis by Type of Molecule Delivered
- 14.2.7. Analysis by End-user
- 14.2.8. Analysis by Target Population
- 14.2.9. Analysis by Gender of Target Population
- 14.3. Drug Device Combinations: Early and Late Stage Autoinjector Developers Landscape
- 14.3.1. Analysis by Year of Establishment
- 14.3.2. Analysis by Company Size
- 14.3.3. Analysis by Location of Headquarters
- 14.3.4. Analysis by Company Size and Location of Headquarters
- 14.3.5. Analysis by Type of Company
15 SHORT COMPANY PROFILES: AUTOINJECTOR COMBINATION PRODUCT DEVELOPERS
- 15.1. Chapter Overview
- 15.2. Amgen
- 15.2.1. Company Overview
- 15.2.2. Autoinjector Combination Product Portfolio
- 15.3. ChemProtect.SK
- 15.3.1. Company Overview
- 15.3.2. Autoinjector Combination Product Portfolio
- 15.4. Eli Lilly and Company
- 15.4.1. Company Overview
- 15.4.2. Autoinjector Combination Product Portfolio
- 15.5. Kindeva Drug Delivery
- 15.5.1. Company Overview
- 15.5.2. Autoinjector Combination Product Portfolio
- 15.6. Merck
- 15.6.1. Company Overview
- 15.6.2. Autoinjector Combination Product Portfolio
- 15.7. Novartis
- 15.7.1. Company Overview
- 15.7.2. Autoinjector Combination Product Portfolio
- 15.8. Novo Nordisk
- 15.8.1. Company Overview
- 15.8.2. Autoinjector Combination Product Portfolio
- 15.9. Sanofi
- 15.9.1. Company Overview
- 15.9.2. Autoinjector Combination Product Portfolio
- 15.10. Teva Pharmaceutical Industries
- 15.10.1. Company Overview
- 15.10.2. Autoinjector Combination Product Portfolio
16. KEY OPINION LEADER ANALYSIS
- 16.1. Chapter Overview
- 16.2. Assumption and Key Parameters
- 16.3. Methodology
- 16.4. Autoinjectors: Key Opinion Leaders
- 16.4.1. Analysis by Role of KOL
- 16.4.2. Analysis by Type of Sponsor Organization
- 16.4.3. Analysis by Affiliated Organization
- 16.4.4. Analysis by Target Indication
- 16.4.5. Analysis by Location of Clinical Trials
- 16.4.6 Most Prominent KOLs: Analysis by Activeness, Expertise and Strength of KOL
- 16.4.7. Most Prominent KOLs: Analysis by Roots Analysis Score
17. CASE STUDY: KEY THERAPEUTIC INDICATIONS
- 17.1. Chapter Overview
- 17.2. Anaphylaxis
- 17.2.1. Overview and Epidemiology
- 17.2.2. Treatment for Anaphylaxis
- 17.2.3. Autoinjectors for Anaphylaxis
- 17.3. Multiple Sclerosis
- 17.3.1. Overview and Epidemiology
- 17.3.2. Treatment for Multiple Sclerosis
- 17.3.3. Autoinjectors for Multiple Sclerosis
- 17.4. Migraine
- 17.4.1. Overview and Epidemiology
- 17.4.2. Treatment for Migraine
- 17.4.3. Autoinjectors for Migraine
- 17.5. Rheumatoid Arthritis
- 17.5.1. Overview and Epidemiology
- 17.5.2. Treatment for Rheumatoid Arthritis
- 17.5.3. Autoinjectors for Rheumatoid Arthritis
18. CASE STUDY: MEDICAL DEVICE CONTRACT SERVICE PROVIDERS
- 18.1. Chapter Overview
- 18.2. Challenges Associated with Medical Device Manufacturing
- 18.3. Role of CMOs in Medical Device Manufacturing
- 18.4. Services Offered by Medical Device CMOs
- 18.5. Advantages Offered by Medical Device CMOs
- 18.6. Risks Associated with Outsourcing to CMOs
- 18.7. Drug Delivery Device Service Providers
- 18.7.1. Analysis by Year of Establishment
- 18.7.2. Analysis by Company Size
- 18.7.3. Analysis by Location of Headquarters
- 18.7.4. Analysis by Type of Services
- 18.8. Concluding Remarks
19. CASE STUDY: PREFILLED SYRINGES
- 19.1. Chapter Overview
- 19.2. Prefilled Syringes: Market Landscape
- 19.2.1. Analysis by Type of Barrel Fabrication Material
- 19.2.2. Analysis by Number of Barrel Chambers
- 19.2.3. Analysis by Type of Needle System
- 19.3. Prefilled Syringes Manufacturers: Overall Market Landscape
- 19.3.1. Analysis by Year of Establishment
- 19.3.2. Analysis by Company Size
- 19.3.3. Analysis by Location of Headquarters
- 19.4. Future Perspectives
20. SWOT ANALYSIS
- 20.1. Chapter Overview
- 20.2. Strengths
- 20.2.1. Ease of Drug Delivery
- 20.2.2. Ability to Minimize / Eliminate Medication Errors
- 20.2.3. Enhanced Safety Features
- 20.2.4. Economic Advantages
- 20.2.5. Drug Life Cycle Management
- 20.3. Weaknesses
- 20.3.1. Manufacturing Complexities
- 20.3.2. Customized Design for Different Formulations
- 20.3.3. Use Errors
- 20.3.4. Stringent Regulatory Guidelines
- 20.4. Opportunities
- 20.4.1. Rich and Growing Pipeline of Biologics and Biosimilars
- 20.4.2. Growing Preference for Self-Injection Devices
- 20.4.3. Integration of Advanced Technologies
- 20.4.4. Rising Popularity across the Globe
- 20.5. Threats
- 20.5.1. Material Compatibility Issues
- 20.5.2. Availability of Alternative Drug Delivery Devices
- 20.5.3. Concern Related to Numerous Product Recalls in Past
- 20.6. Concluding Remarks
21. GLOBAL AUTOINJECTORS MARKET
- 21.1. Chapter Overview
- 21.2. Key Assumptions and Methodology
- 21.3. Global Autoinjectors Market, Historical Trends (Since 2018) and Forecasted Estimates (Till 2035)
- 21.3.1. Scenario Analysis
- 21.3.1.1. Conservative Scenario
- 21.3.1.2 Optimistic Scenario
- 21.3.1. Scenario Analysis
- 21.4. Key Market Segmentations
22. AUTOINJECTORS MARKET, FOR RHEUMATOID ARTHRITIS
- 22.1. Chapter Overview
- 22.2. Key Assumptions and Methodology
- 22.3. Autoinjectors Market for Rheumatoid Arthritis: Distribution by Usability
- 22.3.1. Disposable Autoinjectors Market for Rheumatoid Arthritis, Historical Trends (Since 2018) and Forecasted Estimates (Till 2035)
- 22.3.2. Reusable Autoinjectors Market for Rheumatoid Arthritis, Historical Trends (Since 2018) and Forecasted Estimates (Till 2035)
- 22.4. Autoinjectors Market for Rheumatoid Arthritis: Distribution by Route of Administration
- 22.4.1. Subcutaneous Autoinjectors Market for Rheumatoid Arthritis, Historical Trends (Since 2018) and Forecasted Estimates (Till 2035)
- 22.4.2. Subcutaneous / Intravenous Autoinjectors Market for Rheumatoid Arthritis, Historical Trends (Since 2018) and Forecasted Estimates (Till 2035)
- 22.4.3. Intravenous Autoinjectors Market for Rheumatoid Arthritis, Historical Trends (Since 2018) and Forecasted Estimates (Till 2035)
- 22.5. Autoinjectors Market for Rheumatoid Arthritis: Distribution by Type of Molecule Delivered
- 22.5.1. Protein-based Autoinjectors Market for Rheumatoid Arthritis, Historical Trends (Since 2018) and Forecasted Estimates (Till 2035)
- 22.5.2. Antibody-based Autoinjectors Market for Rheumatoid Arthritis, Historical Trends (Since 2018) and Forecasted Estimates (Till 2035)
- 22.5.3. Small Molecule-based Autoinjectors Market for Rheumatoid Arthritis, Historical Trends (Since 2018) and Forecasted Estimates (Till 2035)
- 22.6. Leading Player
23. AUTOINJECTORS MARKET, FOR MULTIPLE SCLEROSIS
- 23.1. Chapter Overview
- 23.2. Key Assumptions and Methodology
- 23.3. Autoinjectors Market for Multiple Sclerosis: Distribution by Usability
- 23.3.1. Disposable Autoinjectors Market for Multiple Sclerosis, Historical Trends (Since 2018) and Forecasted Estimates (Till 2035)
- 23.3.2. Reusable Autoinjectors Market for Multiple Sclerosis, Historical Trends (Since 2018) and Forecasted Estimates (Till 2035)
- 23.4. Autoinjectors Market for Multiple Sclerosis: Distribution by Route of Administration
- 23.4.1. Subcutaneous Autoinjectors Market for Multiple Sclerosis, Historical Trends (Since 2018) and Forecasted Estimates (Till 2035)
- 23.4.2. Intramuscular Autoinjectors Market for Multiple Sclerosis, Historical Trends (Since 2018) and Forecasted Estimates (Till 2035)
- 23.5. Autoinjectors Market for Multiple Sclerosis: Distribution by Type of Molecule Delivered
- 23.5.1. Protein-based Autoinjectors Market for Multiple Sclerosis, Historical Trends (Since 2018) and Forecasted Estimates (Till 2035)
- 23.5.2. Peptide-based Autoinjectors Market for Multiple Sclerosis, Historical Trends (Since 2018) and Forecasted Estimates (Till 2035)
- 23.5.3. Antibody-based Autoinjectors Market for Multiple Sclerosis, Historical Trends (Since 2018) and Forecasted Estimates (Till 2035)
- 23.6. Leading Player
24. AUTOINJECTORS MARKET, FOR DIABETES
- 24.1. Chapter Overview
- 24.2. Key Assumptions and Methodology
- 24.3. Autoinjectors Market for Diabetes: Distribution by Usability
- 24.3.1. Disposable Autoinjectors Market for Diabetes, Historical Trends (Since 2018) and Forecasted Estimates (Till 2035)
- 24.3.2. Reusable Autoinjectors Market for Diabetes, Historical Trends (Since 2018) and Forecasted Estimates (Till 2035)
- 24.4. Autoinjectors Market for Diabetes: Distribution by Route of Administration
- 24.4.1. Subcutaneous Autoinjectors Market for Diabetes, Historical Trends (Since 2018) and Forecasted Estimates (Till 2035)
- 24.5. Autoinjectors Market for Diabetes: Distribution by Type of Molecule Delivered
- 24.5.1. Protein-based Autoinjectors Market for Diabetes, Historical Trends (Since 2018) and Forecasted Estimates (Till 2035)
- 24.5.2. Antibody-based Autoinjectors Market for Diabetes, Historical Trends (Since 2018) and Forecasted Estimates (Till 2035)
- 24.6. Leading Player
25. AUTOINJECTORS MARKET, FOR WEIGHT LOSS
- 25.1. Chapter Overview
- 25.2. Key Assumptions and Methodology
- 25.3. Autoinjectors Market for Weight Loss: Distribution by Usability
- 25.3.1. Disposable Autoinjectors Market for Weight Loss, Historical Trends (Since 2018) and Forecasted Estimates (Till 2035)
- 25.4. Autoinjectors Market for Weight Loss: Distribution by Route of Administration
- 25.4.1. Subcutaneous Autoinjectors Market for Weight Loss, Historical Trends (Since 2018) and Forecasted Estimates (Till 2035)
- 25.5. Autoinjectors Market for Weight Loss: Distribution by Type of Molecule Delivered
- 25.5.1. Peptide-based Autoinjectors Market for Weight Loss, Historical Trends (Since 2018) and Forecasted Estimates (Till 2035)
- 25.5.2. Small Molecule-based Autoinjectors Market for Weight Loss, Historical Trends (Since 2018) and Forecasted Estimates (Till 2035)
- 25.6. Leading Player
26. AUTOINJECTORS MARKET, FOR ANAPHYLAXIS
- 26.1. Chapter Overview
- 26.2. Key Assumptions and Methodology
- 26.3. Autoinjectors Market for Anaphylaxis: Distribution by Usability
- 26.3.1. Disposable Autoinjectors Market for Anaphylaxis, Historical Trends (Since 2018) and Forecasted Estimates (Till 2035)
- 26.4. Autoinjectors Market for Anaphylaxis: Distribution by Route of Administration
- 26.4.1. Subcutaneous / Intramuscular Autoinjectors Market for Anaphylaxis, Historical Trends (Since 2018) and Forecasted Estimates (Till 2035)
- 26.4.2. Intramuscular Autoinjectors Market for Anaphylaxis, Historical Trends (Since 2018) and Forecasted Estimates (Till 2035)
- 26.5. Autoinjectors Market for Anaphylaxis: Distribution by Type of Molecule Delivered
- 26.5.1. Small Molecule-based Autoinjectors Market for Anaphylaxis, Historical Trends (Since 2018) and Forecasted Estimates (Till 2035)
- 26.6. Leading Player
27. AUTOINJECTORS MARKET, FOR MIGRAINE
- 27.1. Chapter Overview
- 27.2. Key Assumptions and Methodology
- 27.3. Autoinjectors Market for Migraine: Distribution by Usability
- 27.3.1. Disposable Autoinjectors Market for Migraine, Historical Trends (Since 2018) and Forecasted Estimates (Till 2035)
- 27.4. Autoinjectors Market for Migraine: Distribution by Route of Administration
- 27.4.1. Subcutaneous Autoinjectors Market for Migraine, Historical Trends (Since 2018) and Forecasted Estimates (Till 2035)
- 27.5. Autoinjectors Market for Migraine: Distribution by Type of Molecule Delivered
- 27.5.1. Antibody-based Autoinjectors Market for Migraine, Historical Trends (Since 2018) and Forecasted Estimates (Till 2035)
- 27.5.2. Protein-based Autoinjectors Market for Migraine, Historical Trends (Since 2018) and Forecasted Estimates (Till 2035)
- 27.5.3. Small Molecule-based Autoinjectors Market for Migraine, Historical Trends (Since 2018) and Forecasted Estimates (Till 2035)
- 27.6. Leading Player
28. AUTOINJECTORS MARKET, FOR OTHER INDICATIONS
- 28.1. Chapter Overview
- 28.2. Key Assumptions and Methodology
- 28.3. Autoinjectors Market for Other Indications: Distribution by Usability
- 28.3.1. Disposable Autoinjectors Market for Other Indications, Historical Trends (Since 2018) and Forecasted Estimates (Till 2035)
- 28.3.2. Reusable Autoinjectors Market for Other Indications, Historical Trends (Since 2018) and Forecasted Estimates (Till 2035)
- 28.4. Autoinjectors Market for Other Indications: Distribution by Route of Administration
- 28.4.1. Subcutaneous Autoinjectors Market for Other Indications,
Historical Trends (Since 2018) and Forecasted Estimates (Till 2035)
- 28.4.2. Subcutaneous / Intramuscular Autoinjectors Market for Other Indications, Historical Trends (Since 2018) and Forecasted Estimates (Till 2035)
- 28.4.3. Subcutaneous / Intravenous Autoinjectors Market for Other Indications, Historical Trends (Since 2018) and Forecasted Estimates (Till 2035)
- 28.5. Autoinjectors Market for Other Indications: Distribution by Type of Molecule Delivered
- 28.5.1. Antibody-based Autoinjectors Market for Other Indications, Historical Trends (Since 2018) and Forecasted Estimates (Till 2035)
- 28.5.2. Protein-based Autoinjectors Market for Other Indications, Historical Trends (Since 2018) and Forecasted Estimates (Till 2035)
- 28.5.3. Small Molecule-based Autoinjectors Market for Other Indications, Historical Trends (Since 2018) and Forecasted Estimates (Till 2035)
- 28.5.4. Other Molecule-based Autoinjectors Market for Other Indications, Historical Trends (Since 2018) and Forecasted Estimates (Till 2035)
- 28.6. Leading Player
29. AUTOINJECTORS MARKET, BY USABILITY
- 29.1. Chapter Overview
- 29.2. Key Assumptions and Methodology
- 29.3. Autoinjectors Market: Distribution by Usability
- 29.3.1. Disposable Autoinjectors Market: Historical Trends (Since 2018) and Forecasted Estimates (Till 2035)
- 29.3.2. Reusable Autoinjectors Market: Historical Trends (Since 2018) and Forecasted Estimates (Till 2035)
- 29.4. Data Triangulation and Validation
30. AUTOINJECTORS MARKET, BY ROUTE OF ADMINISTRATION
- 30.1. Chapter Overview
- 30.2. Key Assumptions and Methodology
- 30.3. Autoinjectors Market: Distribution by Route of Administration
- 30.3.1. Autoinjectors Market for Subcutaneous Administration: Historical Trends (Since 2018) and Forecasted Estimates (Till 2035)
- 30.3.2. Autoinjectors Market for Subcutaneous / Intramuscular Administration: Historical Trends (Since 2018) and Forecasted Estimates (Till 2035)
- 30.3.3. Autoinjectors Market for Subcutaneous / Intravenous Administration: Historical Trends (Since 2018) and Forecasted Estimates (Till 2035)
- 30.3.4. Autoinjectors Market for Intramuscular Administration: Historical Trends (Since 2018) and Forecasted Estimates (Till 2035)
- 30.3.5. Autoinjectors Market for Intravenous Administration: Historical Trends (Since 2018) and Forecasted Estimates (Till 2035)
- 30.4. Data Triangulation and Validation
31. AUTOINJECTORS MARKET, BY TYPE OF MOLECULE DELIVERED
- 31.1. Chapter Overview
- 31.2. Key Assumptions and Methodology
- 31.3. Autoinjectors Market: Distribution by Type of Molecule Delivered
- 31.3.1. Autoinjectors Market for Proteins: Historical Trends (Since 2018) and Forecasted Estimates (Till 2035)
- 31.3.2. Autoinjectors Market for Antibodies: Historical Trends (Since 2018) and Forecasted Estimates (Till 2035)
- 31.3.3. Autoinjectors Market for Small Molecules: Historical Trends (Since 2018) and Forecasted Estimates (Till 2035)
- 31.3.4. Autoinjectors Market for Peptides: Historical Trends (Since 2018) and Forecasted Estimates (Till 2035)
- 31.3.5. Autoinjectors Market for Other Molecules: Historical Trends (Since 2018) and Forecasted Estimates (Till 2035)
- 31.4. Data Triangulation and Validation
32. AUTOINJECTORS MARKET, BY TYPE OF ACTUTATION MECHANISM
- 32.1. Chapter Overview
- 32.2. Key Assumptions and Methodology
- 32.3. Autoinjectors Market: Distribution by Type of Actuation Mechanism
- 32.3.1. Autoinjectors Market for Manual Actuation: Historical Trends (Since 2018) and Forecasted Estimates (Till 2035)
- 32.3.2. Autoinjectors Market for Automatic Actuation: Historical Trends (Since 2018) and Forecasted Estimates (Till 2035)
- 32.4. Data Triangulation and Validation
33. AUTOINJECTORS MARKET, BY VOLUME OF CONTAINER
- 33.1. Chapter Overview
- 33.2. Key Assumptions and Methodology
- 33.3. Autoinjectors Market: Distribution by Volume of Container
- 33.3.1. Autoinjectors Market for Containers with Less than 1 mL Volume: Historical Trends (Since 2018) and Forecasted Estimates (Till 2035)
- 33.3.2. Autoinjectors Market for Containers with 1- 2 mL Volume: Historical Trends (Since 2018) and Forecasted Estimates (Till 2035)
- 33.3.3. Autoinjectors Market for Containers with More than 2 mL Volume: Historical Trends (Since 2018) and Forecasted Estimates (Till 2035)
- 33.4. Data Triangulation and Validation
34. AUTOINJECTORS, BY END-USER
- 34.1. Chapter Overview
- 34.2. Key Assumptions and Methodology
- 34.3. Autoinjectors Market: Distribution by End-user
- 34.3.1. Autoinjectors Market for Home Care: Historical Trends (Since 2018) and Forecasted Estimates (Till 2035)
- 34.3.2. Autoinjectors Market for Hospitals and Clinics: Historical Trends (Since 2018) and Forecasted Estimates (Till 2035)
- 34.3.3. Autoinjectors Market for Ambulatory Surgical Centers: Historical Trends (Since 2018) and Forecasted Estimates (Till 2035)
- 34.4. Data Triangulation and Validation
35. AUTOINJECTORS MARKET, BY TARGET INDICATION
- 35.1. Chapter Overview
- 35.2. Key Assumptions and Methodology
- 35.3. Autoinjectors Market: Distribution by Target Indication
- 35.3.1. Autoinjectors Market for Rheumatoid Arthritis: Historical Trends (Since 2018) and Forecasted Estimates (Till 2035)
- 35.3.2. Autoinjectors Market for Multiple Sclerosis: Historical Trends (Since 2018) and Forecasted Estimates (Till 2035)
- 35.3.3 Autoinjectors Market for Diabetes: Historical Trends (Since 2018) and Forecasted Estimates (Till 2035) Data Triangulation
- 35.3.4. Autoinjectors Market for Anaphylaxis: Historical Trends (Since 2018) and Forecasted Estimates (Till 2035)
- 35.3.5. Autoinjectors Market for Weight Loss: Historical Trends (Since 2018) and Forecasted Estimates (Till 2035)
- 35.3.6. Autoinjectors Market for Migraine: Historical Trends (Since 2018) and Forecasted Estimates (Till 2035)
- 35.3.7. Autoinjectors Market for Other Indications: Historical Trends (Since 2018) and Forecasted Estimates (Till 2035)
- 35.4. Data Triangulation and Validation
36. AUTOINJECTORS, BY KEY GEOGRAPHICAL REGIONS
- 36.1. Chapter Overview
- 36.2. Key Assumptions and Methodology
- 36.3. Autoinjectors Market: Distribution by Key Geographical Regions
- 36.3.1. Autoinjectors Market in North America: Historical Trends (Since 2018) and Forecasted Estimates (Till 2035)
- 36.3.2. Autoinjectors Market in Europe: Historical Trends (Since 2018) and Forecasted Estimates (Till 2035)
- 36.3.3. Autoinjectors Market in Asia-Pacific: Historical Trends (Since 2018) and Forecasted Estimates (Till 2035)
- 36.3.4. Autoinjectors Market in Middle East and North Africa: Historical Trends (Since 2018) and Forecasted Estimates (Till 2035)
- 36.3.4. Autoinjectors Market in Latin America: Historical Trends (Since 2018) and Forecasted Estimates (Till 2035)
- 36.4. Data Triangulation and Validation
37. CONCLUDING REMARKS
38. EXECUTIVE INSIGHTS
- 38.1. Chapter Overview
- 38.2. Aktiv Pharma
- 38.2.1. Company Snapshot
- 38.2.2. Interview Transcript
- 38.3. Rx Bandz
- 38.3.1. Company Snapshot
- 38.3.2. Interview Transcript
- 38.4. Kindeva Drug Delivery
- 38.4.1. Company Snapshot
- 38.4.2. Interview Transcript
- 38.5. DALI Medical Devices
- 38.5.1. Company Snapshot
- 38.5.2. Interview Transcript:
- 38.6. Elcam Medical
- 38.6.1. Company Snapshot
- 38.6.2. Interview Transcript
- 38.7. Pharma Consult
- 38.7.1. Company Snapshot
- 38.7.2. Interview Transcript
- 38.8. IDEO
- 38.8.1. Company Snapshot
- 38.8.2. Interview Transcript
- 38.9. Bill & Melinda Gates Foundation
- 38.9.1. Company Snapshot
- 38.9.2. Interview Transcript
- 38.10. Oval Medical Technologies
- 38.10.1. Company Snapshot
- 38.10.2. Interview Transcript
- 38.11. Anonymous
- 38.12. Anonymous
- 38.13. Anonymous
- 38.14. Anonymous
