
|
市場調査レポート
商品コード
1723661
バーチャル生検市場:対象治療領域別、対象がんタイプ別、イメージング技術タイプ別、エンドユーザー別、地域別、主要企業別:2035年までの業界動向と世界の予測Virtual Biopsy Market by Target Therapeutic Area, Type of Cancer Targeted, Type of Imaging Technology, End Users, Geographical Regions and Leading Players: Industry Trends and Global Forecasts, till 2035 |
||||||
カスタマイズ可能
|
|||||||
| バーチャル生検市場:対象治療領域別、対象がんタイプ別、イメージング技術タイプ別、エンドユーザー別、地域別、主要企業別:2035年までの業界動向と世界の予測 |
|
出版日: 2025年05月09日
発行: Roots Analysis
ページ情報: 英文 309 Pages
納期: 即日から翌営業日
|

全表示
- 概要
- 図表
- 目次
バーチャル生検市場
バーチャル生検の市場規模は、2019年に5億3,000万米ドルとなりました。同市場は、予測期間中に14.47%のCAGRで拡大し、現在の7億8,000万米ドル、2035年には30億2,000万米ドルに達すると予測されています。
バーチャル生検市場の機会は、以下のセグメントに分布しています:
対象治療領域
- 腫瘍学的疾患
- 神経疾患
- 心血管疾患
- 眼科疾患
- 内分泌疾患
- 消化器疾患
- その他
対象がんタイプ
- 固形がん
- 乳がん
- 肺がん
- 前立腺がん
- 大腸がん
- 脳腫瘍
- その他
イメージング技術タイプ
- 磁気共鳴画像法
- コンピュータ断層撮影
- X線
- 超音波
- その他
エンドユーザー
- 磁気共鳴イメージング
- コンピュータ断層撮影
- X線
- 超音波
- その他
地域
- 北米(米国、カナダ)
- 欧州(ドイツ、フランス、イタリア、英国、スペイン、スイス、その他)
- アジア太平洋地域(中国、日本、インド、韓国、オーストラリア、その他)
- 中東・北アフリカ地域(サウジアラビア、イスラエル、エジプト、その他)
- ラテンアメリカ(ブラジル、メキシコ、アルゼンチン、その他)
バーチャル生検市場:成長と動向
長年にわたり、ヘルスケア専門家は、患者の状態を分析するために、外科的に患者サンプルを採取する従来の生検技術を使用してきました。しかし、これらの方法は、感染症、切開後の出血、患者の不快感など、いくつかの合併症を伴うことが多いです。加えて、従来の生検技術は、サンプル採取、外科的介入、手術室のメンテナンスに関連する費用がかかることが多く、コストがかさみます。
インド医学研究評議会(ICMR)の推定によると、がん罹患率は2022年の140万人から2025年には150万人に増加すると予想されています。その結果、病気の発見と患者のケアを強化するため、より安全で効率的な代替品への需要が医療関係者の間で高まっています。
増大する需要に応え、従来の手技に伴う健康上の懸念を軽減するため、バーチャル生検技術は、疾患検出と予後のための非侵襲的ツールとして支持を集めています。この革新的な技術は、リスクの軽減や患者のスクリーニングプロセスの改善など、さまざまな利点をもたらします。さらに、バーチャル生検は、抽出されたサンプルからの画像を詳細に分析する高度な人工知能(AI)ソフトウェアを利用することにより、患者の状態に関する深い洞察を提供します。さらに、このアプローチは、外科的処置に伴うリスクを軽減しながら治療中の薬剤反応を評価する上で重要な役割を果たし、治療計画を立てる上で不可欠なツールとなっています。
バーチャル生検技術の技術的進歩と効果的な患者ケア管理に対する需要の高まりに後押しされ、バーチャル生検装置の採用は着実に増加しており、ヘルスケア分野における早期発見と日常的な診断を可能にすると予想されています。
バーチャル生検市場:主要インサイト
当レポートでは、バーチャル生検市場の現状を掘り下げ、業界内の潜在的成長機会を特定しています。当レポートの主な調査結果は以下の通り:
- 現在、世界中で約45のバーチャル生検装置が様々な参入企業により開発されており、これらの装置の65%の技術革新は先進地域に本社を置く小規模参入企業が主導しています。
- 磁気共鳴画像法(33%)は、安全な磁気と電波を使ってデータを取得することから、画像取得の目的で最も広く採用されている技術として浮上しています。
- 取引の50%近くが過去2年間に締結されたものであり、この間にパートナーシップ活動が大幅に増加したことを示しています。
- バーチャル生検技術がヘルスケアの成果を改善する上で様々な利点を持つことから、多くの投資家が企業に資金援助を行っており、2020年以降4億2,500万米ドル以上が投資されています。
- バーチャル生検に関連する約85件の特許が、この分野で生み出された知的財産を保護するために、様々な業界および非業界の参入企業により出願/付与されています。
- 効率的なヘルスケアツールの開発に貢献する最近の技術動向を中心に、科学者別65件以上の論文が提出されています。
- バーチャル生検市場は、従来の生検手技に代わる、より安全で効率的な手技への需要の高まりにより牽引されていますが、複雑な規制規範が引き続き業界成長の障壁となっています。
- バーチャル生検に関連する市場機会は、非侵襲的でより安全な診断ツールに対する需要の高まりにより、2035年まで年率14.47%の成長が見込まれます。
- 全体的な市場機会は、さまざまなタイプの画像技術やエンドユーザーにうまく分配されると予想されます。
バーチャル生検市場:主要セグメント
世界のバーチャル生検市場は、対象治療領域別では、腫瘍性疾患、神経疾患、心血管疾患、眼科疾患、内分泌疾患、消化器疾患、その他に区分されます。現在、バーチャル生検市場の大半のシェアを占めているのは腫瘍疾患であり、これはがん診断におけるバーチャル生検装置のような非侵襲的装置に対する医師の嗜好の高まりによるものです。これらの装置は、画像の取り込みやデータの解析にCT(コンピュータ断層撮影)やMRI(磁気共鳴画像)などの先端技術を用いることで、この需要の高まりに対応しています。
対象とするがんタイプ別では、世界のバーチャル生検市場は固形悪性腫瘍、乳がん、肺がん、前立腺がん、大腸がん、脳腫瘍、その他に分布しています。現在のところ、固形悪性腫瘍分野が市場全体の成長を支配し、牽引すると思われます。これは、診断される成人がん症例の約90%が固形がんであり、その結果、このような疾患を効果的に診断できる高度な診断装置に対する需要が高まっていることに起因しています。
イメージング技術タイプ別では、世界のバーチャル生検市場は磁気共鳴画像、コンピュータ断層撮影、X線、超音波、その他に区分されます。特に、磁気共鳴イメージング(MRI)技術が提供する、サンプルの包括的な360度ビューを含む様々な利点により、患者の状態を簡単かつ効果的に分析できるため、予測期間中、MRI技術がバーチャル生検市場を独占する可能性が高いです。
エンドユーザー別では、世界市場は病院・診療所、研究機関・診断センター、その他に区分されます。現在、病院・診療所セグメントが最大の市場シェアを占めています。これは、病院や診療所においてバーチャル生検装置が様々な健康状態のスクリーニング、診断、予後予測を提供するため、需要が増加しているためです。
地域別に見ると、市場は北米、欧州、アジア太平洋、ラテンアメリカ、中東・北アフリカに区分されます。現在のシナリオでは、北米が最大の市場シェアを占める可能性が高いです。これは、この地域のヘルスケア領域における研究開発活動に割り当てられる予算額が大きいことに起因しています。しかし、ラテンアメリカのバーチャル生検市場は予測期間中により高いCAGRで成長すると予想されます。
当レポートで答えている主な質問
- 現在、この市場に参入している企業は何社あるか
- この市場の主要企業
- この市場の進化に影響を与えそうな要因
- 現在と将来の市場規模
- この市場のCAGR
- 現在および将来の市場機会は、主要市場セグメントにどのように分配されそうか
- 業界利害関係者が一般的に採用している提携モデルはどのようなものか
- 現在進行中の投資動向
- 同市場における特許出願動向
当レポートを購入する理由
- 当レポートは包括的な市場分析を提供し、市場全体と特定のサブセグメントに関する詳細な収益予測を提供します。この情報は、すでに市場をリードしている企業にとっても、新規参入企業にとっても貴重なものです。
- 利害関係者は、市場内の競争力学をより深く理解するためにレポートを活用することができます。競合情勢を分析することで、企業は、市場でのポジショニングを最適化し、効果的な市場参入戦略を開発するために、情報に基づいた意思決定を行うことができます。
- 当レポートは、主要促進要因・市場抑制要因・課題など、市場の包括的な概要を利害関係者に提供します。この情報は、利害関係者が市場動向を常に把握し、成長の見込みを活用するためのデータ主導の意思決定を行うための力となります。
その他の特典
- PPTインサイトパック
- レポート内の全分析モジュールの無料エクセルデータパック
- 10%の無料コンテンツカスタマイズ
- 調査チームによる詳細レポートのウォークスルーセッション
- レポートが6~12ヶ月以上前の場合、無料更新レポート
当レポートでは、世界のバーチャル生検市場について調査し、市場の概要とともに、対象治療領域別、対象がんタイプ別、イメージング技術タイプ別、エンドユーザー別、地域別、主要企業別の動向、および市場に参入する企業のプロファイルなどを提供しています。
目次
第1章 序文
第2章 調査手法
第3章 市場力学
第4章 マクロ経済指標
第5章 エグゼクティブサマリー
第6章 イントロダクション
- 章の概要
- バーチャル生検の概要
- 従来の生検とバーチャル生検
- バーチャル生検の実施手順
- バーチャル生検の応用
- バーチャル生検に伴う課題
- 将来の展望
第7章 市場情勢
- 章の概要
- バーチャル生検装置:市場情勢
- バーチャル生検装置:開発者の情勢
第8章 製品競争力分析
- 章の概要
- 前提と主要なパラメータ
- 調査手法
- 製品競争力分析:バーチャル生検装置
第9章 企業プロファイル:北米に拠点を置く開発業者
- 章の概要
- GE HealthCare
- Imaging Biometrics
- OptoVibronex
第10章 企業プロファイル:欧州に拠点を置く開発業者
- 章の概要
- ImageBiopsy Lab
- Median Technologies
- Quibim
- Siemens Healthineers
第11章 企業プロファイル:アジア太平洋に拠点を置くバーチャル生検プロバイダー
- 章の概要
- City Imaging and Clinical Labs
第12章 パートナーシップとコラボレーション
第13章 資金調達と投資
- 章の概要
- 資金調達モデル
- バーチャル生検:資金調達と投資
- 結論
第14章 特許分析
第15章 出版物の分析
第16章 市場影響分析
- 章の概要
- 市場の促進要因
- 市場の抑制要因
- 市場の機会
- 市場の課題
- 結論
第17章 バーチャル生検市場
第18章 バーチャル生検市場(対象治療領域別)
第19章 バーチャル生検市場(対象がんタイプ別)
第20章 バーチャル生検市場(イメージング技術タイプ別)
第21章 バーチャル生検市場(エンドユーザー別)
第22章 バーチャル生検市場(地域別)
第23章 バーチャル生検市場(主要企業別)
第24章 結論
第25章 エグゼクティブ洞察
第26章 付録I:表形式データ
第27章 付録II:企業および組織の一覧
List of Tables
- Table 7.1 Virtual Biopsy Devices: Information on Developer, Status of Development, Year of Approval, Region of Approval and Regulatory Accreditations
- Table 7.2 Virtual Biopsy Devices: Information on Type of Step Involved and Clinical Purpose
- Table 7.3 Virtual Biopsy Devices: Information on Type of Imaging Technology Used and Therapeutic Application
- Table 7.4 Virtual Biopsy Devices: Information on Target Therapeutic Area
- Table 7.5 Virtual Biopsy Devices: Information on Type of Cancer Targeted
- Table 7.6 Virtual Biopsy Devices: Information on List of Developers
- Table 9.1 Virtual Biopsy Device Developers based in North America: List of Companies Profiled
- Table 9.2 GE HealthCare: Company Overview
- Table 9.3 GE HealthCare: Virtual Biopsy Device Portfolio
- Table 9.4 GE HealthCare: Recent Developments and Future Outlook
- Table 9.5 Imaging Biometrics (Acquired by IQ-AI): Company Overview
- Table 9.6 Imaging Biometrics (Acquired by IQ-AI): Virtual Biopsy Device Portfolio
- Table 9.7 OptoVibronex: Company Overview
- Table 9.8 OptoVibronex: Virtual Biopsy Device Portfolio
- Table 10.1 Virtual Biopsy Device Developers based in Europe: List of Companies Profiled
- Table 10.2 ImageBiopsy Lab: Company Overview
- Table 10.3 ImageBiopsy Lab: Virtual Biopsy Device Portfolio
- Table 10.4 ImageBiopsy Lab: Recent Developments and Future Outlook
- Table 10.5 Median Technologies: Company Overview
- Table 10.6 Median Technologies: Virtual Biopsy Device Portfolio
- Table 10.7 Median Technologies: Recent Developments and Future Outlook
- Table 10.8 Quibim: Company Overview
- Table 10.9 Quibim: Virtual Biopsy Device Portfolio
- Table 10.10 Quibim: Recent Developments and Future Outlook
- Table 10.11 Siemens Healthineers: Company Overview
- Table 10.12 Siemens Healthineers: Virtual Biopsy Device Portfolio
- Table 11.1 Virtual Biopsy Device Developers based in Asia Pacific: List of Companies Profiled
- Table 11.2 City Imaging and Clinical Labs: Company Overview
- Table 11.3 City Imaging and Clinical Labs: Virtual Biopsy Device Portfolio
- Table 11.4 City Imaging and Clinical Labs: Recent Developments and Future Outlook
- Table 12.1 Virtual Biopsy Device Developers: List of Partnerships and Collaborations, Since 2020
- Table 12.2 Partnerships and Collaborations: Information on Location of Headquarters (Country and Region) and Type of Agreement (Country and Region)
- Table 13.1 Virtual Biopsy Devices: List of Funding and Investments, Since 2020
- Table 14.1 Patent Analysis: Top CPC Sections
- Table 14.2 Patent Analysis: Top CPC Symbols
- Table 14.3 Patent Analysis: Top CPC Codes
- Table 14.4 Patent Analysis: Summary of Benchmarking Analysis
- Table 14.5 Patent Analysis: Categorization based on Weighted Valuation Scores
- Table 14.6 Patent Portfolio: List of Leading Patents (by Highest Relative Valuation)
- Table 14.7 Patent Portfolio: List of Leading Patents (by Number of Citations)
- Table 25.1 GENECAST: Company Snapshot
- Table 25.2 Quibim: Company Snapshot
- Table 26.1 Virtual Biopsy Devices: Distribution by Status of Development
- Table 26.2 Virtual Biopsy Devices: Distribution by Year of Approval
- Table 26.3 Virtual Biopsy Devices: Distribution by Region of Approval
- Table 26.4 Virtual Biopsy Devices: Distribution by Regulatory Accreditations
- Table 26.5 Virtual Biopsy Devices: Distribution by Type of Step Involved
- Table 26.6 Virtual Biopsy Devices: Distribution by Clinical Purpose
- Table 26.7 Virtual Biopsy Devices: Distribution by Type of Imaging Technology Used
- Table 26.8 Virtual Biopsy Devices: Distribution by Status of Development and Type of Imaging Technology Used
- Table 26.9 Virtual Biopsy Devices: Distribution by Therapeutic Application
- Table 26.10 Virtual Biopsy Devices: Distribution by Target Therapeutic Area
- Table 26.11 Virtual Biopsy Devices: Distribution by Status of Development and Target Therapeutic Area
- Table 26.12 Virtual Biopsy Devices: Distribution by Type of Cancer Targeted
- Table 26.13 Virtual Biopsy Device Developers: Distribution by Year of Establishment
- Table 26.14 Virtual Biopsy Device Developers: Distribution by Company Size
- Table 26.15 Virtual Biopsy Device Developers: Distribution by Location of Headquarters (Region)
- Table 26.16 Virtual biopsy Device Developers: Distribution by Status of Development and Location of Headquarters (Region)
- Table 26.17 Virtual biopsy Device Developers: Distribution by Location of Headquarters (Country)
- Table 26.18 Virtual Biopsy Device Developers: Distribution by Company Size and Location of Headquarters (Region)
- Table 26.19 Most Active Developers: Distribution by Number of Virtual Biopsy Devices Developed
- Table 26.20 GE HealthCare: Business Segment-wise Revenues and Consolidated Financial Details (USD Million)
- Table 26.21 IQ-AI (Parent Company of Imaging Biometrics): Consolidated Financial Details (GBP Million)
- Table 26.22 Median Technologies: Consolidated Financial Details (EUR Million)
- Table 26.23 Siemens Healthineers: Business Segment-wise Revenues and Consolidated Financial Details (EUR Million)
- Table 26.24 Partnerships and Collaborations: Cumulative Year-wise Trend, Since 2020
- Table 26.25 Partnerships and Collaborations: Distribution by Type of Partnership
- Table 26.26 Partnerships and Collaborations: Distribution by Year and Type of Partnership, Since 2020
- Table 26.27 Partnerships and Collaborations: Distribution by Type of Partner
- Table 26.28 Partnerships and Collaborations: Distribution by Type of Imaging Technology
- Table 26.29 Partnerships and Collaborations: Distribution by Therapeutic Application
- Table 26.30 Most Active Players: Distribution by Number of Partnerships
- Table 26.31 Partnership and Collaborations: Local and International Agreements
- Table 26.32 Partnerships and Collaborations: Intracontinental and Intercontinental Agreements
- Table 26.33 Funding and Investments: Cumulative Year-wise Trend, Since 2020
- Table 26.34 Funding and Investments: Distribution by Type of Funding
- Table 26.35 Funding and Investments: Distribution by Year and Type of Funding, Since 2020
- Table 26.36 Funding and Investments: Distribution by Amount Invested, Since 2020 (USD Million)
- Table 26.37 Funding and Investments: Distribution of Amount Invested by Type of Funding (USD Million)
- Table 26.38 Funding and Investments: Distribution by Geography (Region)
- Table 26.39 Most Active Players: Distribution by Number of Funding Instances
- Table 26.40 Most Active Players: Distribution by Amount Raised (USD Million)
- Table 26.41 Leading Investors: Distribution by Number of Funding Instances
- Table 26.42 Funding and Investment Summary, Since 2020 (USD Million)
- Table 26.43 Patent Analysis: Distribution by Type of Patent
- Table 26.44 Patent Analysis: Cumulative Distribution by Patent Publication Year, Since 2019
- Table 26.45 Patent Analysis: Distribution by Type of Patent and Patent Publication Year, Since 2019
- Table 26.46 Patent Analysis: Distribution by Patent Application Year, Since Pre-2018
- Table 26.47 Patent Analysis: Patent Jurisdiction
- Table 26.48 Patent Analysis: Cumulative Year-wise Distribution by Type of Applicant, Since 2019
- Table 26.49 Leading Industry Players: Distribution by Number of Patents
- Table 26.50 Leading Non-Industry Players: Distribution by Number of Patents
- Table 26.51 Patent Analysis: Distribution by Patent Age
- Table 26.52 Virtual Biopsy: Patent Valuation
- Table 26.53 Publication Analysis: Cumulative Year-wise Trend, Since Pre-2019
- Table 26.54 Publication Analysis: Distribution by Type of Publication
- Table 26.55 Key Copyright Holders: Distribution by Number of Publications
- Table 26.56 Most Active Publishers: Distribution by Number of Publications
- Table 26.57 Key Journals: Distribution by Number of Publications
- Table 26.58 Key Journals: Distribution by Impact Factor
- Table 26.59 Publication Analysis: Most Popular Keywords
- Table 26.60 Global Virtual Biopsy Market, Historical Trends (Since 2019) and Forecasted Estimates (Till 2035) (USD Billion)
- Table 26.61 Global Virtual Biopsy Market, Forecasted Estimates (Till 2035): Conservative Scenario (USD Billion)
- Table 26.62 Global Virtual Biopsy Market, Forecasted Estimates (Till 2035): Optimistic Scenario (USD Billion)
- Table 26.63 Virtual Biopsy Market: Distribution by Target Therapeutic Area
- Table 26.64 Virtual Biopsy Market for Oncological Disorders, Historical Trends (Since 2019) and Forecasted Estimates (Till 2035) (USD Billion)
- Table 26.65 Virtual Biopsy Market for Neurological Disorders, Historical Trends (Since 2019) and Forecasted Estimates (Till 2035) (USD Billion)
- Table 26.66 Virtual Biopsy Market for Cardiovascular Disorders, Historical Trends (Since 2019) and Forecasted Estimates (Till 2035) (USD Billion)
- Table 26.67 Virtual Biopsy Market for Ophthalmological Disorders, Historical Trends (Since 2019) and Forecasted Estimates (Till 2035) (USD Billion)
- Table 26.68 Virtual Biopsy Market for Endocrine Disorders, Historical Trends (Since 2019) and Forecasted Estimates (Till 2035) (USD Billion)
- Table 26.69 Virtual Biopsy Market for Gastrointestinal Disorders, Historical Trends (Since 2019) and Forecasted Estimates (Till 2035) (USD Billion)
- Table 26.70 Virtual Biopsy Market for Others, Historical Trends (Since 2019) and Forecasted Estimates (Till 2035) (USD Billion)
- Table 26.71 Virtual Biopsy Market: Distribution by Type of Cancer Targeted
- Table 26.72 Virtual Biopsy Market for Solid Malignancies, Historical Trends (Since 2019) and Forecasted Estimates (Till 2035) (USD Billion)
- Table 26.73 Virtual Biopsy Market for Breast Cancer, Historical Trends (Since 2019) and Forecasted Estimates (Till 2035) (USD Billion)
- Table 26.74 Virtual Biopsy Market for Lung Cancer, Historical Trends (Since 2019) and Forecasted Estimates (Till 2035) (USD Billion)
- Table 26.75 Virtual Biopsy Market for Prostate Cancer, Historical Trends (Since 2019) and Forecasted Estimates (Till 2035) (USD Billion)
- Table 26.76 Virtual Biopsy Market for Colorectal Cancer, Historical Trends (Since 2019) and Forecasted Estimates (Till 2035) (USD Billion)
- Table 26.77 Virtual Biopsy Market for Brain Cancer, Historical Trends (Since 2019) and Forecasted Estimates (Till 2035) (USD Billion)
- Table 26.78 Virtual Biopsy Market for Others, Historical Trends (Since 2019) and Forecasted Estimates (Till 2035) (USD Billion)
- Table 26.79 Virtual Biopsy Market: Distribution by Imaging Technology
- Table 26.80 Virtual Biopsy Market for Magnetic Resonance Imaging, Historical Trends (Since 2019) and Forecasted Estimates (Till 2035) (USD Billion)
- Table 26.81 Virtual Biopsy Market for Computed Tomography, Historical Trends (Since 2019) and Forecasted Estimates (Till 2035) (USD Billion)
- Table 26.82 Virtual Biopsy Market for X-ray, Historical Trends (Since 2019) and Forecasted Estimates (Till 2035) (USD Billion)
- Table 26.83 Virtual Biopsy Market for Ultrasound, Historical Trends (Since 2019) and Forecasted Estimates (Till 2035) (USD Billion)
- Table 26.84 Virtual Biopsy Market for Others, Historical Trends (Since 2019) and Forecasted Estimates (Till 2035) (USD Billion)
- Table 26.85 Virtual Biopsy Market: Distribution by End Users
- Table 26.86 Virtual Biopsy Market for Hospitals and Clinics, Historical Trends (Since 2019) and Forecasted Estimates (Till 2035) (USD Billion)
- Table 26.87 Virtual Biopsy Market for Research Institutes and Diagnostic Centers, Historical Trends (Since 2019) and Forecasted Estimates (Till 2035) (USD Billion)
- Table 26.88 Virtual Biopsy Market for Others, Historical Trends (Since 2019) and Forecasted Estimates (Till 2035) (USD Billion)
- Table 26.89 Virtual Biopsy Market: Distribution by Geographical Regions
- Table 26.90 Virtual Biopsy Market in North America, Historical Trends (Since 2019) and Forecasted Estimates (Till 2035) (USD Billion)
- Table 26.91 Virtual Biopsy Market in the US, Historical Trends (Since 2019) and Forecasted Estimates (Till 2035) (USD Billion)
- Table 26.92 Virtual Biopsy Market in Canada, Historical Trends (Since 2019) and Forecasted Estimates (Till 2035) (USD Billion)
- Table 26.93 Virtual Biopsy Market in Europe, Historical Trends (Since 2019) and Forecasted Estimates (Till 2035) (USD Billion)
- Table 26.94 Virtual Biopsy Market in Germany, Historical Trends (Since 2019) and Forecasted Estimates (Till 2035) (USD Billion)
- Table 26.95 Virtual Biopsy Market in France, Historical Trends (Since 2019) and Forecasted Estimates (Till 2035) (USD Billion)
- Table 26.96 Virtual Biopsy Market in Italy, Historical Trends (Since 2019) and Forecasted Estimates (Till 2035) (USD Billion)
- Table 26.97 Virtual Biopsy Market in the UK, Historical Trends (Since 2019) and Forecasted Estimates (Till 2035) (USD Billion)
- Table 26.98 Virtual Biopsy Market in Spain, Historical Trends (Since 2019) and Forecasted Estimates (Till 2035) (USD Billion)
- Table 26.99 Virtual Biopsy Market in Switzerland, Historical Trends (Since 2019) and Forecasted Estimates (Till 2035) (USD Billion)
- Table 26.100 Virtual Biopsy Market in Rest of Europe, Historical Trends (Since 2019) and Forecasted Estimates (Till 2035) (USD Billion)
- Table 26.101 Virtual Biopsy Market in Asia-Pacific, Historical Trends (Since 2019) and Forecasted Estimates (Till 2035) (USD Billion)
- Table 26.102 Virtual Biopsy Market in China, Historical Trends (Since 2019) and Forecasted Estimates (Till 2035) (USD Billion)
- Table 26.103 Virtual Biopsy Market in Japan, Historical Trends (Since 2019) and Forecasted Estimates (Till 2035) (USD Billion)
- Table 26.104 Virtual Biopsy Market in India, Historical Trends (Since 2019) and Forecasted Estimates (Till 2035) (USD Billion)
- Table 26.105 Virtual Biopsy Market in South Korea, Historical Trends (Since 2019) and Forecasted Estimates (Till 2035) (USD Billion)
- Table 26.106 Virtual Biopsy Market in Australia, Historical Trends (Since 2019) and Forecasted Estimates (Till 2035) (USD Billion)
- Table 26.107 Virtual Biopsy Market in Rest of Asia Pacific, Historical Trends (Since 2019) and Forecasted Estimates (Till 2035) (USD Billion)
- Table 26.108 Virtual Biopsy Market in Middle East and North Africa, Historical Trends (Since 2019) and Forecasted Estimates (Till 2035) (USD Billion)
- Table 26.109 Virtual Biopsy Market in Saudi Arabia, Historical Trends (Since 2019) and Forecasted Estimates (Till 2035) (USD Billion)
- Table 26.110 Virtual Biopsy Market in Israel, Historical Trends (Since 2019) and Forecasted Estimates (Till 2035) (USD Billion)
- Table 26.111 Virtual Biopsy Market in Egypt, Historical Trends (Since 2019) and Forecasted Estimates (Till 2035) (USD Billion)
- Table 26.112 Virtual Biopsy Market in Rest of Middle East and North Africa, Historical Trends (Since 2019) and Forecasted Estimates (Till 035) (USD Billion)
- Table 26.113 Virtual Biopsy Market in Latin America, Historical Trends (Since 2019) and Forecasted Estimates (Till 2035) (USD Billion)
- Table 26.114 Virtual Biopsy Market in Brazil, Historical Trends (Since 2019) and Forecasted Estimates (Till 2035) (USD Billion)
- Table 26.115 Virtual Biopsy Market in Mexico, Historical Trends (Since 2019) and Forecasted Estimates (Till 2035) (USD Billion)
- Table 26.116 Virtual Biopsy Market in Argentina, Historical Trends (Since 2019) and Forecasted Estimates (Till 2035) (USD Billion)
- Table 26.117 Virtual Biopsy Market in Rest of Latin America, Historical Trends (Since 2019) and Forecasted Estimates (Till 2035) (USD Billion)
- Table 26.118 Virtual Biopsy Market: Distribution by Leading Players (USD Billion)
VIRTUAL BIOPSY MARKET
As per Roots Analysis, the virtual biopsy market, valued at USD 0.53 billion in 2019, is projected to reach USD 0.78 billion in current year and USD 3.02 billion by 2035, representing a CAGR of 14.47% during the forecast period.
The opportunity for virtual biopsy market has been distributed across the following segments:
Target Therapeutic Area
- Oncological Disorders
- Neurological Disorders
- Cardiovascular Disorders
- Ophthalmological Disorders
- Endocrine Disorders
- Gastrointestinal Disorders
- Others
Type of Cancer Targeted
- Solid Malignancies
- Breast Cancer
- Lung Cancer
- Prostate Cancer
- Colorectal Cancer
- Brain Cancer
- Others
Type of Imaging Technology
- Magnetic Resonance Imaging
- Computed Tomography
- X-ray
- Ultrasound
- Others
End Users
- Magnetic Resonance Imaging
- Computed Tomography
- X-ray
- Ultrasound
- Others
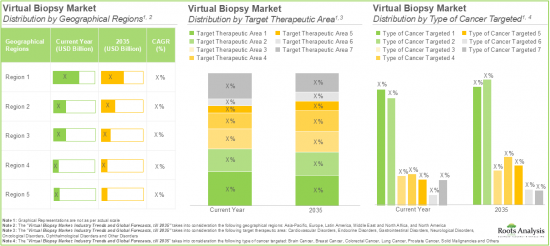
Geographical Regions
- North America (US and Canada)
- Europe (Germany, France, Italy, UK, Spain, Switzerland and Rest of Europe)
- Asia-Pacific (China, Japan, India, South Korea, Australia and Rest of Asia-Pacific)
- Middle East and North Africa (Saudi Arabia, Israel, Egypt, and Rest of Middle East and North Africa)
- Latin America (Brazil, Mexico, Argentina and Rest of Latin America)
VIRTUAL BIOPSY MARKET: GROWTH AND TRENDS
Over the years, healthcare professionals have been using conventional biopsy techniques for extracting patient samples surgically in order to analyze their condition. However, these methods are often associated with several complications, such as infections, hemorrhage after incision, and patient discomfort. In addition, conventional biopsy techniques are often cost intensive, with expenses related to sample collection, surgical interventions and operating room maintenance.
Based on estimates by the Indian Council of Medical Research (ICMR), the incidence of cancer cases is expected to increase from 1.4 million in 2022 to 1.5 million by 2025. As a result, the demand for safer and more efficient alternatives is increasing among medical professionals to enhance disease detection and patient care.
In order to meet the growing demand and mitigate the health concerns associated with the convention procedures, the virtual biopsy technique has gained traction as a non-invasive tool for disease detection and prognosis. This innovative technique provides various benefits, including reduced risks and the improved patient screening process. Further, virtual biopsy offers in-depth insights into patients' conditions by utilizing advanced artificial intelligence (AI) software that analyzes images from extracted samples in detail. Additionally, this approach plays a critical role in evaluating drug responses during treatment while mitigating the risks associated with surgical procedures, making it an essential tool for planning treatment.
Driven by the technological advancements in virtual biopsy techniques and the rising demand for effective patient care management, the adoption of virtual biopsy devices is steadily increasing and is anticipated to enable early detection and routine diagnostics in the healthcare sector.
VIRTUAL BIOPSY MARKET: KEY INSIGHTS
The report delves into the current state of the virtual biopsy market and identifies potential growth opportunities within the industry. Some key findings from the report include:
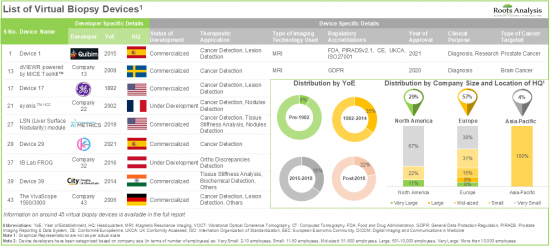
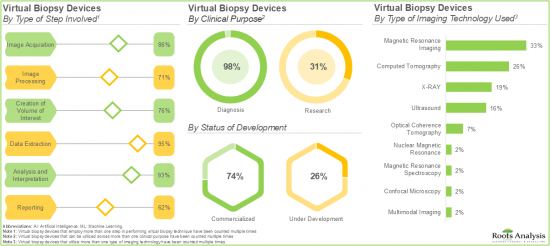
- Presently, about 45 virtual biopsy devices are being developed by various players worldwide; the innovation for 65% of these devices is being led by small players headquartered in developed regions.
- Magnetic resonance imaging (33%) has emerged as the most widely employed technology for image acquisition purposes, owing to the fact that it uses safe magnetic and radio waves for capturing data.
- Close to 50% of the deals have been inked in the last two years, demonstrating a considerable increase in partnership activity during this period; of these, more than 65% of the partnerships were international deals.
- Given the various benefits of virtual biopsy techniques in improving healthcare outcomes, a significant number of investors have provided financial support to the companies; over USD 425 million has been invested since 2020.
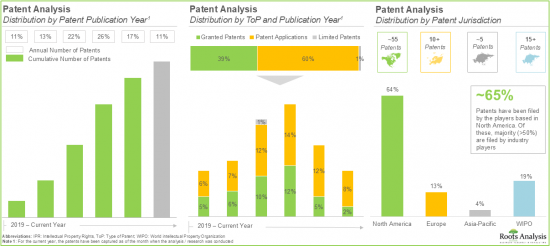
- Around 85 patents related to virtual biopsy have been filed / granted by various industry and non-industry players to protect the intellectual property generated within this field.
- More than 65 publications have been filed by scientists, focusing on recent technological advancements that contribute to the development of efficient healthcare tools.
- The virtual biopsy market is driven by an increase in the demand for safer and more efficient alternatives to conventional biopsy procedures; however, complex regulatory norms continue to pose a barrier to the industry growth.
- The market opportunity associated with virtual biopsy is likely to witness an annualized growth rate of 14.47% till 2035, owing to the growing demand for non-invasive and safer diagnostic tools.
- The overall opportunity is expected to be well distributed across different types of imaging technologies and end users.
VIRTUAL BIOPSY MARKET: KEY SEGMENTS
Oncological Disorder Segment is Likely to Dominate the Virtual Biopsy Market During the Forecast Period
Based on the target therapeutic area, the global market for virtual biopsy is segmented into oncological disorders, neurological disorders, cardiovascular disorders, ophthalmological disorders, endocrine disorders, gastrointestinal disorders and others. Currently, the majority share of the virtual biopsy market is captured by oncological disorders driven by the growing preference of physicians for non-invasive devices, such as virtual biopsy devices in cancer diagnosis. These devices meet this rising demand by using advanced technologies, such as computed tomography and magnetic resonance imaging for image capturing and analyzing the data.
Solid Malignancies Segment is Likely to Hold the Largest Share of the Virtual Biopsy Market During the Forecast Period
Based on the type of cancer targeted, the global virtual biopsy market is distributed across solid malignancies, breast cancer, lung cancer, prostate cancer, colorectal cancer, brain cancer and others. Currently, the solid malignancies segment is likely to dominate and drive the overall market growth. This can be attributed to the fact that solid tumors account for around 90% of all the adult cancer cases diagnosed, which results in increased demand for advanced diagnostic devices that can effectively diagnose such disorders.
By Type of Imaging Technology, Virtual Biopsy Devices Utilizing Magnetic Resonance Imaging Technology are Likely to Dominate the Market During the Forecast Period
Based on the type of imaging technology, the global virtual biopsy market is segmented across magnetic resonance imaging, computed tomography, X-ray, ultrasound and others. Notably, owing to the various advantages offered by magnetic resonance imaging (MRI) technology including a comprehensive 360-degree view of the sample, enabling easy and effective analysis of patient's condition, it is likely to dominate the virtual biopsy market during the forecast period.
Currently, Hospitals and Clinics Segment Holds the Largest Share of the Virtual Biopsy Market
Based on end users, the global market is segmented into hospitals and clinics, research institutions and diagnostic centers, and others. Currently, the hospitals and clinics segment holds the largest market share. This can be attributed to the increased demand for virtual biopsy devices in hospitals and clinics as these devices provide screening, diagnosis, and prognosis for various health conditions in these settings.
North America Accounts for the Largest Share of the Market
Based on geographical regions, the market is segmented into North America, Europe, Asia-Pacific, Latin America and Middle East and North Africa. In the current scenario, North America is likely to capture the largest market share. This can be attributed to the substantial budget amount allotted for research and development activities in the healthcare domain in this region. However, the virtual biopsy market in Latin America is expected to grow at a higher CAGR during the forecast period.
EXAMPLE PLAYERS IN THE VIRTUAL BIOPSY MARKET
- GE Healthcare
- Imaging Biometrics
- OptoVibronex
- ImageBiopsy Lab
- Median Technologies
- Quibim
- Siemens Healthineers
- City Imaging and Clinical Labs
VIRTUAL BIOPSY MARKET: RESEARCH COVERAGE
The report on the virtual biopsy market features insights on various sections, including:
- Market Sizing and Opportunity Analysis: An in-depth analysis of the virtual biopsy market, focusing on key market segments, including [A] target therapeutic area, [B] type of cancer targeted, [C] type of imaging technology, [D] end users, [E] geographical regions and [F] leading players.
- Market Impact Analysis: A thorough analysis of various factors, such as drivers, restraints, opportunities, and existing challenges that are likely to impact market growth.
- Virtual Biopsy Devices Market Landscape: A comprehensive evaluation of various virtual biopsy devices, based on several relevant parameters, such as [A] status of development, [B] year of approval, [C] region of approval, [D] regulatory accreditations, [E] type of step involved, [F] clinical purpose, [G] type of imaging technology used, [H] therapeutic application, [I] target therapeutic area, and [J] type of cancer targeted. This section also features a list of players engaged in the development of virtual biopsy devices, along with analyses based on [A] year of establishment, [B] company size, [C] location of headquarters and [D] most active developers.
- Company Profiles: Detailed profiles of companies engaged in developing virtual biopsy devices across various regions, including [A] company overview, [B] financial information (if available), [C] virtual biopsy device portfolio, [D] recent developments and [E] an informed future outlook.
- Product Competitiveness Analysis: An in-depth analyses of virtual biopsy devices, based on various relevant parameters, such as [A] company strength, [B] product portfolio strength and [C] product portfolio diversity.
- Partnerships and Collaborations: An insightful analysis of the deals inked by stakeholders in virtual biopsy domain, based on several parameters, such as [A] year of partnership, [B] type of partnership, [C] type of partner, [D] type of imaging technology used, [E] therapeutic application, [F] most active players, and [G] geographical distribution of partnership activity.
- Funding and Investments: An in-depth analysis of the funding raised by companies engaged in the virtual biopsy domain, based on relevant parameters, such as [A] year of funding, [B] type of funding, [C] amount invested, [D] geographical distribution, [E] most active players and [F] most active investors.
- Patent Analysis: Detailed analysis of patents filed / granted till date in the virtual biopsy domain, based on various relevant parameters, such as [A] type of patent, [B] publication year, [B] application year, [C] CPC symbols, [D] patent jurisdiction, [E] type of applicant, [F] leading industry players, [G] patent benchmarking, [H] patent valuation analysis, and [I] leading patents.
- Publication Analysis: A comprehensive assessment of publications made in the virtual biopsy domain, based on various relevant parameters, such as [A] year of publication, [B] type of publication, [C] key copyright holders, [D] most active publishers, [E] most active publishers (in terms of number of publications and impact factor) and [F] most popular keywords used.
KEY QUESTIONS ANSWERED IN THIS REPORT
- How many companies are currently engaged in this market?
- Which are the leading companies in this market?
- What factors are likely to influence the evolution of this market?
- What is the current and future market size?
- What is the CAGR of this market?
- How is the current and future market opportunity likely to be distributed across key market segments?
- What kind of partnership models are commonly adopted by industry stakeholders?
- What is the ongoing investment trend in this market?
- What is the patent filing activity trend in the market?
REASONS TO BUY THIS REPORT
- The report provides a comprehensive market analysis, offering detailed revenue projections of the overall market and its specific sub-segments. This information is valuable to both established market leaders and emerging entrants.
- Stakeholders can leverage the report to gain a deeper understanding of the competitive dynamics within the market. By analyzing the competitive landscape, businesses can make informed decisions to optimize their market positioning and develop effective go-to-market strategies.
- The report offers stakeholders a comprehensive overview of the market, including key drivers, barriers, opportunities, and challenges. This information empowers stakeholders to stay abreast of market trends and make data-driven decisions to capitalize on growth prospects.
ADDITIONAL BENEFITS
- Complimentary PPT Insights Packs
- Complimentary Excel Data Packs for all Analytical Modules in the Report
- 10% Free Content Customization
- Detailed Report Walkthrough Session with Research Team
- Free Updated report if the report is 6-12 months old or older
TABLE OF CONTENTS
1. PREFACE
- 1.1. Introduction
- 1.2. Market Share Insights
- 1.3. Key Market Insights
- 1.4. Report Coverage
- 1.5. Key Questions Answered
- 1.6. Chapter Outlines
2. RESEARCH METHODOLOGY
- 2.1. Chapter Overview
- 2.2. Research Assumptions
- 2.2.1. Market Landscape and Market Trends
- 2.2.2. Market Forecast and Opportunity Analysis
- 2.2.3. Comparative Analysis
- 2.3. Database Building
- 2.3.1. Data Collection
- 2.3.2. Data Validation
- 2.3.3. Data Analysis
- 2.4. Project Methodology
- 2.4.1. Secondary Research
- 2.4.1.1. Annual Reports
- 2.4.1.2. Academic Research Papers
- 2.4.1.3. Company Websites
- 2.4.1.4. Investor Presentations
- 2.4.1.5. Regulatory Filings
- 2.4.1.6. White Papers
- 2.4.1.7. Industry Publications
- 2.4.1.8. Conferences and Seminars
- 2.4.1.9. Government Portals
- 2.4.1.10. Media and Press Releases
- 2.4.1.11. Newsletters
- 2.4.1.12. Industry Databases
- 2.4.1.13. Roots Proprietary Databases
- 2.4.1.14. Paid Databases and Sources
- 2.4.1.15. Social Media Portals
- 2.4.1.16. Other Secondary Sources
- 2.4.2. Primary Research
- 2.4.2.1. Types of Primary Research
- 2.4.2.1.1. Qualitative Research
- 2.4.2.1.2. Quantitative Research
- 2.4.2.1.3. Hybrid Approach
- 2.4.2.2. Advantages of Primary Research
- 2.4.2.3. Techniques for Primary Research
- 2.4.2.3.1. Interviews
- 2.4.2.3.2. Surveys
- 2.4.2.3.3. Focus Groups
- 2.4.2.3.4. Observational Research
- 2.4.2.3.5. Social Media Interactions
- 2.4.2.4. Key Opinion Leaders Considered in Primary Research
- 2.4.2.4.1. Company Executives (CXOs)
- 2.4.2.4.2. Board of Directors
- 2.4.2.4.3. Company Presidents and Vice Presidents
- 2.4.2.4.4. Research and Development Heads
- 2.4.2.4.5. Technical Experts
- 2.4.2.4.6. Subject Matter Experts
- 2.4.2.4.7. Scientists
- 2.4.2.4.8. Doctors and Other Healthcare Providers
- 2.4.2.5. Ethics and Integrity
- 2.4.2.5.1. Research Ethics
- 2.4.2.5.2. Data Integrity
- 2.4.2.1. Types of Primary Research
- 2.4.3. Analytical Tools and Databases
- 2.4.1. Secondary Research
- 2.5. Robust Quality Control
3. MARKET DYNAMICS
- 3.1. Chapter Overview
- 3.2. Forecast Methodology
- 3.2.1. Top-down Approach
- 3.2.2. Bottom-up Approach
- 3.2.3. Hybrid Approach
- 3.3. Market Assessment Framework
- 3.3.1. Total Addressable Market (TAM)
- 3.3.2. Serviceable Addressable Market (SAM)
- 3.3.3. Serviceable Obtainable Market (SOM)
- 3.3.4. Currently Acquired Market (CAM)
- 3.4. Forecasting Tools and Techniques
- 3.4.1. Qualitative Forecasting
- 3.4.2. Correlation
- 3.4.3. Regression
- 3.4.4. Extrapolation
- 3.4.5. Convergence
- 3.4.6. Sensitivity Analysis
- 3.4.7. Scenario Planning
- 3.4.8. Data Visualization
- 3.4.9. Time Series Analysis
- 3.4.10. Forecast Error Analysis
- 3.5. Key Considerations
- 3.5.1. Demographics
- 3.5.2. Government Regulations
- 3.5.3. Reimbursement Scenarios
- 3.5.4. Market Access
- 3.5.5. Supply Chain
- 3.5.6. Industry Consolidation
- 3.5.7. Pandemic / Unforeseen Disruptions Impact
- 3.6. Limitations
4. MACRO-ECONOMIC INDICATORS
- 4.1. Chapter Overview
- 4.2. Market Dynamics
- 4.2.1. Time Period
- 4.2.1.1. Historical Trends
- 4.2.1.2. Current and Forecasted Estimates
- 4.2.2. Currency Coverage
- 4.2.2.1. Major Currencies Affecting the Market
- 4.2.2.2. Factors Affecting Currency Fluctuations
- 4.2.2.3. Impact of Currency Fluctuations on the Industry
- 4.2.3. Foreign Currency Exchange Rate
- 4.2.3.1. Impact of Foreign Exchange Rate Volatility on the Market
- 4.2.3.2. Strategies for Mitigating Foreign Exchange Risk
- 4.2.4. Recession
- 4.2.4.1. Assessment of Current Economic Conditions and Potential Impact on the Market
- 4.2.4.2. Historical Analysis of Past Recessions and Lessons Learnt
- 4.2.5. Inflation
- 4.2.5.1. Measurement and Analysis of Inflationary Pressures in the Economy
- 4.2.5.2. Potential Impact of Inflation on the Market Evolution
- 4.2.6. Interest Rates
- 4.2.6.1. Interest Rates and Their Impact on the Market
- 4.2.6.2. Strategies for Managing Interest Rate Risk
- 4.2.7. Commodity Flow Analysis
- 4.2.7.1. Type of Commodity
- 4.2.7.2. Origins and Destinations
- 4.2.7.3. Values and Weights
- 4.2.7.4. Modes of Transportation
- 4.2.8. Global Trade Dynamics
- 4.2.8.1. Import Scenario
- 4.2.8.2. Export Scenario
- 4.2.8.3. Trade Policies
- 4.2.8.4. Strategies for Mitigating the Risks Associated with Trade Barriers
- 4.2.8.5. Impact of Trade Barriers on the Market
- 4.2.9. War Impact Analysis
- 4.2.9.1. Russian-Ukraine War
- 4.2.9.2. Israel-Hamas War
- 4.2.10. COVID Impact / Related Factors
- 4.2.10.1. Global Economic Impact
- 4.2.10.2. Industry-specific Impact
- 4.2.10.3. Government Response and Stimulus Measures
- 4.2.10.4. Future Outlook and Adaptation Strategies
- 4.2.11. Other Indicators
- 4.2.11.1. Fiscal Policy
- 4.2.11.2. Consumer Spending
- 4.2.11.3. Gross Domestic Product (GDP)
- 4.2.11.4. Employment
- 4.2.11.5. Taxes
- 4.2.11.6. Stock Market Performance
- 4.2.11.7. Cross-Border Dynamics
- 4.2.1. Time Period
- 4.3. Conclusion
5. EXECUTIVE SUMMARY
6. INTRODUCTION
- 6.1. Chapter Overview
- 6.2. Overview of Virtual Biopsy
- 6.3. Conventional Biopsy Versus Virtual Biopsy
- 6.4. Steps Involved in Performing Virtual Biopsy
- 6.4.1. Acquisition of Data
- 6.4.2. Data Harmonization
- 6.4.3. Division of Data
- 6.4.4. Region of Interests (ROI) Segmentation
- 6.4.5. Extraction and Selection of Image Features
- 6.4.6. Validation of Model
- 6.5. Applications of Virtual Biopsy
- 6.5.1. Cancer Management
- 6.5.2. Other Therapeutic Applications
- 6.6. Challenges Associated with Virtual Biopsy
- 6.7. Future Perspectives
7. MARKET LANDSCAPE
- 7.1. Chapter Overview
- 7.2. Virtual Biopsy Devices: Overall Market Landscape
- 7.2.1. Analysis by Status of Development
- 7.2.2. Analysis by Year of Approval
- 7.2.3. Analysis by Region of Approval
- 7.2.4. Analysis by Regulatory Accreditations
- 7.2.5. Analysis by Type of Step Involved
- 7.2.6. Analysis by Clinical Purpose
- 7.2.7. Analysis by Type of Imaging Technology Used
- 7.2.8. Analysis by Status of Development and Type of Imaging Technology Used
- 7.2.9. Analysis by Therapeutic Application
- 7.2.10. Analysis by Target Therapeutic Area
- 7.2.11. Analysis by Status of Development and Target Therapeutic Area
- 7.2.12. Analysis by Type of Cancer Targeted
- 7.3. Virtual Biopsy Devices: Developer Landscape
- 7.3.1. Analysis by Year of Establishment
- 7.3.2. Analysis by Company Size
- 7.3.3. Analysis by Location of Headquarters (Region)
- 7.3.4. Analysis by Status of Development and Location of Headquarters (Region)
- 7.3.5. Analysis by Location of Headquarters (Country)
- 7.3.6. Analysis by Company Size and Location of Headquarters (Region)
- 7.3.7. Most Active Developers: Analysis by Number of Virtual Biopsy Devices Developed
8. PRODUCT COMPETITIVENESS ANALYSIS
- 8.1. Chapter Overview
- 8.2. Assumptions and Key Parameters
- 8.3. Methodology
- 8.4. Product Competitiveness Analysis: Virtual Biopsy Devices
- 8.4.1. Product Competitiveness Analysis: Virtual Biopsy Devices Developed by Players based in North America
- 8.4.2. Product Competitiveness Analysis: Virtual Biopsy Devices Developed by Players based in Europe and Asia-Pacific
9. COMPANY PROFILES: DEVELOPERS BASED IN NORTH AMERICA
- 9.1. Chapter Overview
- 9.2. GE HealthCare
- 9.2.1. Company Overview
- 9.2.2. Financial Information
- 9.2.3. Virtual Biopsy Device Portfolio
- 9.2.4. Recent Developments and Future Outlook
- 9.3. Imaging Biometrics
- 9.4. OptoVibronex
10. COMPANY PROFILES: DEVELOPERS BASED IN EUROPE
- 10.1. Chapter Overview
- 10.2. ImageBiopsy Lab
- 10.2.1. Company Overview
- 10.2.2. Virtual Biopsy Device Portfolio
- 10.2.3. Recent Developments and Future Outlook
- 10.3. Median Technologies
- 10.4. Quibim
- 10.5. Siemens Healthineers
11. COMPANY PROFILES: VIRTUAL BIOPSY PROVIDERS BASED IN ASIA-PACIFIC
- 11.1. Chapter Overview
- 11.2. City Imaging and Clinical Labs
- 11.2.1. Company Overview
- 11.2.2. Virtual Biopsy Device Portfolio
- 11.2.3. Recent Developments and Future Outlook
12. PARTNERSHIPS AND COLLABORATIONS
- 12.1. Chapter Overview
- 12.2. Partnership Models
- 12.3. Virtual Biopsy: Partnerships and Collaborations
- 12.3.1. Analysis by Year of Partnership
- 12.3.2. Analysis by Type of Partnership
- 12.3.3. Analysis by Year and Type of Partnership
- 12.3.4. Analysis by Type of Partner
- 12.3.5. Analysis by Type of Imaging Technology
- 12.3.6. Analysis by Therapeutic Application
- 12.3.7. Most Active Players: Analysis by Number of Partnerships
- 12.3.8. Analysis by Geography
- 12.3.8.1. Local and International Agreements
- 12.3.8.2. Intracontinental and Intercontinental Agreements
13. FUNDING AND INVESTMENTS
- 13.1. Chapter Overview
- 13.2. Funding Models
- 13.3. Virtual Biopsy: Funding and Investments
- 13.3.1. Analysis by Year of Funding
- 13.3.2. Analysis by Type of Funding
- 13.3.3. Analysis by Year and Type of Funding
- 13.3.4. Analysis by Amount Invested
- 13.3.5. Analysis of Amount Invested by Type of Funding
- 13.3.6. Analysis by Geography
- 13.3.7. Most Active Players: Analysis by Number of Funding Instances
- 13.3.8. Most Active Players: Analysis by Amount Raised
- 13.3.9. Leading Investors: Analysis by Number of Funding Instances
- 13.4. Concluding Remarks
14. PATENT ANALYSIS
- 14.1. Chapter Overview
- 14.2. Scope And Methodology
- 14.3. Virtual Biopsy: Patent Analysis
- 14.3.1. Analysis by Patent Publication Year
- 14.3.2. Analysis by Type of Patent and Publication Year
- 14.3.3. Analysis by Patent Application Year
- 14.3.4. Analysis by Patent Jurisdiction
- 14.3.5. Analysis by CPC Symbols
- 14.3.6. Analysis by Type of Applicant
- 14.3.7. Leading Industry Players: Analysis by Number of Patents
- 14.3.8. Leading Non-Industry Players: Analysis by Number of Patents
- 14.4. Patent Benchmarking Analysis
- 14.4.1. Analysis by Patent Characteristics (CPC Codes) by Leading Industry Players
- 14.5. Patent Valuation
- 14.6. Leading Patents by Number of Citations
15. PUBLICATION ANALYSIS
- 15.1. Chapter Overview
- 15.2. Scope and Methodology
- 15.3. Virtual Biopsy: Publication Analysis
- 15.3.1. Analysis by Year of Publication
- 15.3.2. Analysis by Type of Publication
- 15.3.3. Key Copyright Holders: Analysis by Number of Publications
- 15.3.4. Most Active Publishers: Analysis by Number of Publications
- 15.3.5. Key Journals: Analysis by Number of Publications
- 15.3.6. Key Journals: Analysis by Impact Factor
- 15.3.7. Publication Analysis: Most Popular Keywords
16. MARKET IMPACT ANALYSIS
- 16.1. Chapter Overview
- 16.2. Market Drivers
- 16.3. Market Restraints
- 16.4. Market Opportunities
- 16.5. Market Challenges
- 16.6. Conclusion
17. VIRTUAL BIOPSY MARKET
- 17.1. Chapter Overview
- 17.2. Key Assumptions and Methodology
- 17.3. Global Virtual Biopsy Market, Historical Trends (Since 2019) and Forecasted Estimates (Till 2035)
- 17.3.1. Scenario Analysis
- 17.3.1.1. Conservative Scenario
- 17.3.1.2. Optimistic Scenario
- 17.3.1. Scenario Analysis
- 17.4. Key Market Segmentations
18. VIRTUAL BIOPSY MARKET, BY TARGET THERAPEUTIC AREA
- 18.1. Chapter Overview
- 18.2. Key Assumptions and Methodology
- 18.3. Virtual Biopsy Market: Distribution by Target Therapeutic Area
- 18.3.1. Virtual Biopsy Market for Oncological Disorders, Historical Trends (Since 2019) and Forecasted Estimates (Till 2035)
- 18.3.2. Virtual Biopsy Market for Neurological Disorders, Historical Trends (Since 2019) and Forecasted Estimates (Till 2035)
- 18.3.3. Virtual Biopsy Market for Cardiovascular Disorders, Historical Trends (Since 2019) and Forecasted Estimates (Till 2035)
- 18.3.4. Virtual Biopsy Market for Ophthalmological Disorders, Historical Trends (Since 2019) and Forecasted Estimates (Till 2035)
- 18.3.5. Virtual Biopsy Market for Endocrine Disorders, Historical Trends (Since 2019) and Forecasted Estimates (Till 2035)
- 18.3.6. Virtual Biopsy Market for Gastrointestinal Disorders, Historical Trends (Since 2019) and Forecasted Estimates (Till 2035)
- 18.3.7. Virtual Biopsy Market for Others, Historical Trends (Since 2019) and Forecasted Estimates (Till 2035)
19. VIRTUAL BIOPSY MARKET, BY TYPE OF CANCER TARGETED
- 19.1. Chapter Overview
- 19.2. Key Assumptions and Methodology
- 19.3. Virtual Biopsy Market: Distribution by Type of Cancer Targeted
- 19.3.1. Virtual Biopsy Market for Solid Malignancies, Historical Trends (Since 2019) and Forecasted Estimates (Till 2035)
- 19.3.2. Virtual Biopsy Market for Breast Cancer, Historical Trends (Since 2019) and Forecasted Estimates (Till 2035)
- 19.3.3. Virtual Biopsy Market for Lung Cancer, Historical Trends (Since 2019) and Forecasted Estimates (Till 2035)
- 19.3.4. Virtual Biopsy Market for Prostate Cancer, Historical Trends (Since 2019) and Forecasted Estimates (Till 2035)
- 19.3.5. Virtual Biopsy Market for Colorectal Cancer, Historical Trends (Since 2019) and Forecasted Estimates (Till 2035)
- 19.3.6. Virtual Biopsy Market for Brain Cancer, Historical Trends (Since 2019) and Forecasted Estimates (Till 2035)
- 19.3.7. Virtual Biopsy Market for Others, Historical Trends (Since 2019) and Forecasted Estimates (Till 2035)
- 19.4. Data Triangulation and Validation
20. VIRTUAL BIOPSY MARKET, BY TYPE OF IMAGING TECHNOLOGY
- 20.1. Chapter Overview
- 20.2. Key Assumptions and Methodology
- 20.3. Virtual Biopsy Market: Distribution by Type of Imaging Technology
- 20.3.1. Virtual Biopsy Market for Magnetic Resonance Imaging, Historical Trends (Since 2019) and Forecasted Estimates (Till 2035)
- 20.3.2. Virtual Biopsy Market for Computed Tomography, Historical Trends (Since 2019) and Forecasted Estimates (Till 2035)
- 20.3.3. Virtual Biopsy Market for X-ray, Historical Trends (Since 2019) and Forecasted Estimates (Till 2035)
- 20.3.4. Virtual Biopsy Market for Ultrasound, Historical Trends (Since 2019) and Forecasted Estimates (Till 2035)
- 20.3.5. Virtual Biopsy Market for Others, Historical Trends (Since 2019) and Forecasted Estimates (Till 2035)
- 20.4. Data Triangulation and Validation
21. VIRTUAL BIOPSY MARKET, BY END USERS
- 21.1. Chapter Overview
- 21.2. Key Assumptions and Methodology
- 21.3. Virtual Biopsy Market: Distribution by End Users
- 21.3.1. Virtual Biopsy Market for Hospitals and Clinics, Historical Trends (Since 2019) and Forecasted Estimates (Till 2035)
- 21.3.2. Virtual Biopsy Market for Research Institutes and Diagnostic Centers, Historical Trends (Since 2019) and Forecasted Estimates (Till 2035)
- 21.3.3. Virtual Biopsy Market for Others, Historical Trends (Since 2019) and Forecasted Estimates (Till 2035)
- 21.4. Data Triangulation and Validation
22. VIRTUAL BIOPSY MARKET, BY GEOGRAPHICAL REGIONS
- 22.1. Chapter Overview
- 22.2. Key Assumptions and Methodology
- 22.3. Virtual Biopsy Market: Distribution by Geographical Regions
- 22.3.1. Virtual Biopsy Market for North America, Historical Trends (Since 2019) and Forecasted Estimates (Till 2035)
- 22.3.1.1. Virtual Biopsy Market in the US, Historical Trends (Since 2019) and Forecasted Estimates (Till 2035)
- 22.3.1.2. Virtual Biopsy Market in Canada, Historical Trends (Since 2019) and Forecasted Estimates (Till 2035)
- 22.3.1.3. Virtual Biopsy Market in Rest of North America, Historical Trends (Since 2019) and Forecasted Estimates (Till 2035)
- 22.3.2. Virtual Biopsy Market for Europe, Historical Trends (Since 2019) and Forecasted Estimates (Till 2035)
- 22.3.2.1. Virtual Biopsy Market in Germany, Historical Trends (Since 2019) and Forecasted Estimates (Till 2035)
- 22.3.2.2. Virtual Biopsy Market in France, Historical Trends (Since 2019) and Forecasted Estimates (Till 2035)
- 22.3.2.3. Virtual Biopsy Market in Italy, Historical Trends (Since 2019) and Forecasted Estimates (Till 2035)
- 22.3.2.4. Virtual Biopsy Market in Spain, Historical Trends (Since 2019) and Forecasted Estimates (Till 2035)
- 22.3.2.5. Virtual Biopsy Market in the UK, Historical Trends (Since 2019) and Forecasted Estimates (Till 2035)
- 22.3.2.6. Virtual Biopsy Market in Switzerland, Historical Trends (Since 2019) and Forecasted Estimates (Till 2035)
- 22.3.2.7. Virtual Biopsy Market in Rest of Europe, Historical Trends (Since 2019) and Forecasted Estimates (Till 2035)
- 22.3.3. Virtual Biopsy Market for Asia-Pacific, Historical Trends (Since 2019) and Forecasted Estimates (Till 2035)
- 22.3.3.1. Virtual Biopsy Market in Japan, Historical Trends (Since 2019) and Forecasted Estimates (Till 2035)
- 22.3.3.2. Virtual Biopsy Market in China, Historical Trends (Since 2019) and Forecasted Estimates (Till 2035)
- 22.3.3.3. Virtual Biopsy Market in India, Historical Trends (Since 2019) and Forecasted Estimates (Till 2035)
- 22.3.3.4. Virtual Biopsy Market in South Korea, Historical Trends (Since 2019) and Forecasted Estimates (Till 2035)
- 22.3.3.5. Virtual Biopsy Market in Australia, Historical Trends (Since 2019) and Forecasted Estimates (Till 2035)
- 22.3.3.6. Virtual Biopsy Market in Rest of Asia Pacific, Historical Trends (Since 2019) and Forecasted Estimates (Till 2035)
- 22.3.4. Virtual Biopsy Market for Middle East and North Africa, Historical Trends (Since 2019) and Forecasted Estimates (Till 2035)
- 22.3.4.1. Virtual Biopsy Market in Saudi Arabia, Historical Trends (Since 2019) and Forecasted Estimates (Till 2035)
- 22.3.4.2. Virtual Biopsy Market in Egypt, Historical Trends (Since 2019) and Forecasted Estimates (Till 2035)
- 22.3.4.3. Virtual Biopsy Market in Israel, Historical Trends (Since 2019) and Forecasted Estimates (Till 2035)
- 22.3.4.4. Virtual Biopsy Market in Rest of Middle East and North Africa, Historical Trends (Since 2019) and Forecasted Estimates (Till 2035)
- 22.3.5. Virtual Biopsy Market for Latin America, Historical Trends (Since 2019) and Forecasted Estimates (Till 2035)
- 22.3.5.1. Virtual Biopsy Market in Brazil, Historical Trends (Since 2019) and Forecasted Estimates (Till 2035)
- 22.3.5.2. Virtual Biopsy Market in Mexico, Historical Trends (Since 2019) and Forecasted Estimates (Till 2035)
- 22.3.5.3. Virtual Biopsy Market in Argentina, Historical Trends (Since 2019) and Forecasted Estimates (Till 2035)
- 22.3.5.4. Virtual Biopsy Market in Rest of Latin America, Historical Trends (Since 2019) and Forecasted Estimates (Till 2035)
- 22.3.1. Virtual Biopsy Market for North America, Historical Trends (Since 2019) and Forecasted Estimates (Till 2035)
- 22.4. Virtual Biopsy Market by Geographical Regions: Market Dynamics Assessment
- 22.4.1. Market Movement Analysis
- 22.4.2. Penetration Growth (P-G) Matrix
- 22.5. Data Triangulation and Validation
23. VIRTUAL BIOPSY MARKET, LEADING PLAYERS
- 23.1. Chapter Overview
- 23.2. Key Assumptions and Methodology
- 23.3. Virtual Biopsy Market: Distribution by Leading Players
- 23.4. Data Triangulation and Validation
