
|
市場調査レポート
商品コード
1723659
希少腎疾患市場:標的適応症別、分子タイプ別、生物製剤タイプ別、投与経路別、治療タイプ別、主要地域別、主要医薬品開発企業別、売上予測:2040年までの業界動向と世界の予測Rare Kidney Diseases Market by Target Disease Indications, Type of Biologics, Route of Administration, Type of Therapy, Key Geographical Regions, Leading Drug Developers and Sales Forecast: Industry Trends and Global Forecasts, Till 2040 |
||||||
カスタマイズ可能
|
|||||||
| 希少腎疾患市場:標的適応症別、分子タイプ別、生物製剤タイプ別、投与経路別、治療タイプ別、主要地域別、主要医薬品開発企業別、売上予測:2040年までの業界動向と世界の予測 |
|
出版日: 2025年05月09日
発行: Roots Analysis
ページ情報: 英文 338 Pages
納期: 即日から翌営業日
|

全表示
- 概要
- 図表
- 目次
希少腎疾患市場
世界の希少腎疾患の市場規模は2024年に22億米ドルとなりました。同市場は現在28億米ドルとなっており、2035年には116億米ドルに達し、予測期間中のCAGRは15.2%と見込まれています。
希少腎疾患市場の機会は以下のセグメントに分布しています:
標的適応症
- 非定型溶血性尿毒症症候群
- ファブリー病
- 巣状分節性糸球体硬化症
- 免疫グロブリンA腎症
- ループス腎炎
- その他
分子タイプ
- 生物製剤
- 低分子
生物製剤タイプ
- 酵素
- ホルモン
- モノクローナル抗体
- タンパク質
投与経路
- 静脈内
- 経口
- 皮下
治療タイプ
- 単剤療法
- 併用療法
主要地域
- 北米
- 欧州
- アジア太平洋
希少腎疾患市場:成長と動向
腎疾患には、血液から老廃物や余分な水分を効率的に濾過する腎臓本来の機能を妨げるさまざまな疾患が含まれます。これらの疾患はまた、血圧を調節し、体内の全体的な水分バランスを維持する腎臓の機能全般を損ないます。特に、腎臓の病気は初期段階では自覚症状がないことが多く、診断が難しいです。しかし、老廃物が体内に蓄積すると、高血圧、貧血、栄養不良、神経障害などの症状が現れることがあります。米国疾病予防管理センターによると、2024年には米国で約3,550万人が腎疾患に罹患すると推定され、全人口の14%近くを占めています。これらの疾患の一部である希少腎疾患は、世界的にみてもごく一部の人にしか罹患していません。希少疾病用医薬品法(Orphan Drug Act)により、米国では罹患者数が20万人未満であれば希少疾病に分類されます。しかし、欧州連合(EU)では、希少疾患は欧州人1万人あたり約5人が罹患する疾患と定義されています。
稀な腎疾患は、主に腎臓のろ過装置(糸球体として知られている)に影響を及ぼし、尿中にタンパク質成分や血液が流出します。これらの疾患は先天性、後天性、遺伝性のものがあり、診断や治療のための特定のバイオマーカーを同定することが困難です。適時の介入がなければ、稀な腎疾患はしばしば腎不全に至り、透析や移植が必要となります。希少な慢性腎疾患による腎不全は、腎疾患を患う小児の少なくとも5人に3人、成人の9人に1人に認められていることは重要です。これらの課題に対処するため、希少腎疾患の診断と治療において大きな進歩があっています。ゲノム配列決定や個別化治療などの精密治療により、これらの疾患の標的治療が可能になっています。さらに、ビッグデータと機械学習の統合は、臨床試験のための患者募集を改善し、オーダーメイド治療のための正確な尿バイオマーカーを特定することによって、いくつかの医薬品開発者や研究者を支援しています。
さらに、官民両部門からの多額の投資が、この領域の研究開発を加速させています。現在、医薬品開発企業は、希少腎臓の研究と治療開発のために120億米ドルを超える資金を確保しています。さらに、効率的な診断と治療への注目が高まる中、希少腎疾患治療薬/療法市場は力強い成長を遂げ、今後数年間、利害関係者に大きな機会を提供する態勢が整っています。
希少腎疾患市場:主要インサイト
本レポートでは、希少腎疾患市場の現状を掘り下げ、業界内の潜在的な成長機会を特定しています。本レポートの主な調査結果は以下の通りです:
- 希少腎疾患治療薬/治療法の70%以上が臨床開発段階にあります。特に、免疫グロブリンA腎症やループス腎炎の治療薬/治療法のほとんどが研究されています。
- この領域への関心が高まっていることは、過去に様々な利害関係者間で結ばれたパートナーシップの数々からも明らかで、実際、取引全体の65%が過去3年間に結ばれています。
- この分野の機会に気づいた複数の投資家が、さまざまな資金調達ラウンドを通じて多額の資金を投資しており、この分野への投資の45%は売出しを通じて行われました。
- 希少腎疾患を標的とする薬剤の40%近くが、現在臨床開発の第II相段階にあります。
- 希少腎疾患市場は、2035年まで年率15%(CAGR)で成長する見込みであり、2035年までに市場シェアの大部分(~70%)を北米が占めると予想されています。
- 現在、モノクローナル抗体が市場を独占していますが、特に経口投与が2035年までに市場の大半を占めると予想されます。
希少腎疾患市場:主要セグメント
世界の希少腎疾患市場は、標的適応症別では、非定型溶血性尿毒症症候群、ファブリー病、巣状分節性糸球体硬化症、免疫グロブリンA腎症、ループス腎炎、その他に区分されます。現在、希少腎疾患市場の大半のシェアを占めているのはループス腎炎です。これは、患者集団とヘルスケア専門家の両方において、この疾患の危険性に関する認識が高まっているためです。
分子タイプ別では、世界市場は低分子と生物製剤に区分されます。これらのタイプの中で、低分子セグメントは現在の市場全体で最大のシェアを占めています。しかし、生物学的製剤は、希少腎疾患に関連する根本的な生物学的経路を標的とすることができる有望な代替品として台頭し、したがって、今後数年間でより大きな市場シェアを獲得することが期待されていることに留意することが重要です。
生物製剤タイプ別では、世界の市場規模は酵素、ホルモン、モノクローナル抗体、タンパク質に区分されます。注目すべきは、モノクローナル抗体セグメントが現在の市場を独占していることです。さらに、この動向は、希少腎疾患の治療においてその精度が実証されていることから、今後も変わることはないと思われます。
投与経路別では、世界市場は静脈内投与、経口投与、皮下投与に区分されます。現在のところ、経口投与経路は他の経路と比較して非侵襲的であり、患者のコンプライアンスが向上することから、希少腎疾患市場の大半を占めると予想されています。しかし、この傾向は予測期間中に変化し、今後数年間は皮下投与経路が市場全体のより大きなシェアを占めると予想されることは特筆に値します。
治療タイプ別では、希少腎疾患の世界市場は単剤療法と併用療法に区分されます。現在のところ、単剤療法セグメントが市場全体で最大のシェアを占めています。しかし、併用療法市場は予測期間中に相対的に高いCAGRで成長する可能性が高いです。
主要地域別に見ると、市場は北米、欧州、アジア太平洋に区分されます。現在のところ、北米が最大の市場シェアを占めています。しかし、中国、日本、韓国、インドなどのアジア諸国では希少腎疾患の罹患率が増加しており、この地域ではより効果的な治療管理システムが必要とされているため、アジア太平洋地域の市場は予測期間中により速いペースで成長すると予想されます。
本レポートで答えている主な質問
- 現在、この市場には何社が参入しているのか
- この市場における主要企業
- この市場の進化に影響を与えそうな要因
- 現在と将来の市場規模
- この市場のCAGR
- 現在および将来の市場機会は、主要市場セグメントにどのように分配されそうか
- 市場における特許出願動向
本レポートを購入する理由
- 本レポートは包括的な市場分析を提供し、市場全体と特定のサブセグメントに関する詳細な収益予測を提供します。この情報は、すでに市場をリードしている企業にとっても、新規参入企業にとっても貴重なものです。
- 利害関係者は、市場内の競争力学をより深く理解するためにレポートを活用することができます。競合情勢を分析することで、企業は、市場でのポジショニングを最適化し、効果的な市場参入戦略を開発するために、情報に基づいた意思決定を行うことができます。
- 当レポートは、主要促進要因・市場抑制要因・課題を含む市場の包括的な概要を利害関係者に提供します。この情報は、利害関係者が市場動向を常に把握し、成長の見込みを活用するためのデータ主導の意思決定を行うための力となります。
その他の特典
- 無料エクセルデータパック
- 10%の無料コンテンツカスタマイズ
- 調査チームによる詳細レポートのウォークスルーセッション
- レポートが6-12ヶ月以上前の場合、無料更新レポート
当レポートでは、世界の希少腎疾患市場について調査し、市場の概要とともに、標的適応症別、分子タイプ別、生物製剤タイプ別、投与経路別、治療タイプ別、主要地域別、主要医薬品開発企業別の動向、および市場に参入する企業のプロファイルなどを提供しています。
目次
セクションI:レポートの概要
第1章 背景
第2章 調査手法
第3章 市場力学
第4章 マクロ経済指標
セクションII:定性的な洞察
第5章 エグゼクティブサマリー
第6章 イントロダクション
- 腎臓疾患の概要
- 希少腎疾患の治療標的の選択
- 希少腎疾患領域における技術の進歩
- 希少腎疾患領域における最近の動向
- 将来の展望
セクションIII:競合情勢
第7章 市場情勢
第8章 企業競争力分析
セクションVI:企業プロファイル
第9章 希少腎疾患市場:北米に拠点を置く医薬品・治療法開発企業の企業プロファイル
- 章の概要
- Alexion Pharmaceuticals
- Biogen
- NovelMed
- Travere Therapeutics
- Vertex Pharmaceuticals
- Amgen
- Vera Therapeutics
- ZyVersa Therapeutics
第10章 希少腎疾患市場:欧州に拠点を置く医薬品・治療法開発企業の企業プロファイル
- 章の概要
- Novartis
- Roche
- Advicenne
- Boehringer Ingelheim
- Calliditas Therapeutics
第11章 希少腎疾患市場:アジア太平洋に拠点を置く医薬品・治療法開発企業の企業プロファイル
- 章の概要
- Jiangsu Hengrui Pharmaceuticals
- Asahi Kasei
セクションV:市場動向
第12章 パートナーシップとコラボレーション
- パートナーシップモデル
- 希少腎疾患の薬/治療法:パートナーシップと連携
第13章 資金調達と投資
- 資金調達モデル
- 資金調達ライフサイクル分析
- 投資事例:リスクとリターン
- 希少腎疾患の薬/治療法:資金調達と投資
- 投資のサマリー
第14章 臨床試験分析
- 調査手法と主要なパラメータ
- 希少腎疾患の薬/治療法:臨床試験分析
第15章 臨床的商業的魅力
- 調査手法と主要なパラメータ
- 得点
- 希少腎疾患を標的とした第III相の薬剤/治療法
第16章 主要なオピニオンリーダー
第17章 希少腎臓疾患市場:ケーススタディ
セクションVI:市場予測と機会分析
第18章 市場影響分析:促進要因、抑制要因、機会、課題
- 章の概要
- 市場の促進要因
- 市場の抑制要因
- 市場の機会
- 市場の課題
- 結論
第19章 希少腎臓疾患市場
- 主要な前提と調査手法
- 世界の希少腎臓疾患市場:歴史的動向と2040年までの予測
- 主要な市場セグメンテーション
第20章 希少腎疾患市場(標的適応症別)
第21章 希少腎疾患市場(分子タイプ別)
第22章 希少腎疾患市場(生物学的製剤タイプ別)
第23章 希少腎疾患市場(投与経路別)
第24章 希少腎疾患市場(治療タイプ別)
第25章 希少腎臓疾患市場(主要地域別)
第26章 希少腎臓疾患市場、医薬品の売上予測
第27章 希少腎臓疾患市場(主要医薬品開発企業別)
セクションVII:その他の独占的洞察
第28章 結論
第29章 1次調査からの洞察
セクションVIII:付録
第30章 表形式データ
第31章 企業・団体一覧
List of Tables
- Table 7.1 List of Rare Kidney Disease Drugs / Therapies
- Table 7.2 List of Rare Kidney Disease Drug / Therapy Developers
- Table 9.1 Alexion Pharmaceuticals: Drug Portfolio
- Table 9.2 Biogen: Drug Portfolio
- Table 9.3 NovelMed: Drug Portfolio
- Table 9.4 Travere Therapeutics: Drug Portfolio
- Table 9.5 Vertex Pharmaceuticals: Drug Portfolio
- Table 9.6 Amgen: Drug Portfolio
- Table 9.7 Vera Therapeutics: Drug Portfolio
- Table 9.8 ZyVersa Therapeutics: Drug Portfolio
- Table 10.1 Novartis: Drug Portfolio
- Table 10.2 Roche: Drug Portfolio
- Table 10.3 Advicenne: Drug Portfolio
- Table 10.4 Boehringer Ingelheim: Drug Portfolio
- Table 10.5 Calliditas Therapeutics: Drug Portfolio
- Table 11.1 Jiangsu Hengrui Pharmaceuticals: Drug Portfolio
- Table 11.2 Asahi Kasei: Drug Portfolio
- Table 12.1 Rare Kidney Disease Drugs / Therapies: List of Partnerships and Collaborations, since 2019
- Table 13.1 Rare Kidney Disease Drugs / Therapies: List of Funding and Investments, since 2019
- Table 14.1. Rare Kidney Disease Drugs / Therapies: List of Clinical Trials, since 2019
- Table 16.1. Rare Kidney Disease Drugs / Therapies: List of Key Opinion Leaders
- Table 17.1 Rare Kidney Disease Market: List of Kidney Care Companies
- Table 19.1 Rare Kidney Disease Therapies: List of Forecasted Therapies
- Table 30.1 Rare Kidney Disease Drugs / Therapies: Distribution by Stage of Development
- Table 30.2 Rare Kidney Disease Drugs / Therapies: Distribution by Target Indication
- Table 30.3 Rare Kidney Disease Drugs / Therapies: Distribution by Route of Administration
- Table 30.4 Rare Kidney Disease Drugs / Therapies: Distribution by Type of Molecule
- Table 30.5 Rare Kidney Disease Drugs / Therapies: Distribution by Type of Biologic
- Table 30.6 Rare Kidney Disease Drugs / Therapies: Distribution by Dosing Frequency
- Table 30.7 Rare Kidney Disease Drugs / Therapies: Distribution by Target Patient Population
- Table 30.8 Rare Kidney Disease Drugs / Therapies: Distribution by Type of Therapy
- Table 30.9 Rare Kidney Disease Drug / Therapy Developers: Distribution by Year of Establishment
- Table 30.10 Rare Kidney Disease Drug / Therapy Developers: Distribution by Company Size
- Table 30.11 Rare Kidney Disease Drug / Therapy Developers: Distribution by Location of Headquarters
- Table 30.12 Rare Kidney Disease Drug / Therapy Developers: Distribution by Company Size and Location of Headquarters
- Table 30.13 Most Active Players: Analysis by Number of Drugs / Therapies Developed
- Table 30.14 Rare Kidney Disease Drug / Therapies Developers based in North America: Distribution by Company Size
- Table 30.15 Rare Kidney Disease Drug / Therapies Developers based in North America: Distribution by Stage of Development
- Table 30.16 Rare Kidney Disease Drug / Therapies Developers based in North America: Distribution by Type of Molecule
- Table 30.17 Rare Kidney Disease Drug / Therapies Developers based in Europe: Distribution by Company Size
- Table 30.18 Rare Kidney Disease Drug / Therapies Developers based in Europe: Distribution by Type of Molecule
- Table 30.19 Rare Kidney Disease Drug / Therapies Developers based in Europe: Distribution by Route of Administration
- Table 30.20 Rare Kidney Disease Drug / Therapies Developers based in Asia-Pacific and Rest of the World: Distribution by Company Size
- Table 30.21 Rare Kidney Disease Drug / Therapies Developers based in Asia-Pacific and Rest of the World: Distribution by Stage of Development
- Table 30.22 Rare Kidney Disease Drug / Therapies Developers based in Asia-Pacific and Rest of the World: Distribution by Type of Molecule
- Table 30.23 Alexion Pharmaceuticals: Annual Revenues, since FY 2021 (USD Billion)
- Table 30.24 Biogen: Annual Revenues, since FY 2021 (USD Billion)
- Table 30.25 Travere Therapeutics: Annual Revenues, since FY 2021 (USD Million)
- Table 30.26 Vertex Pharmaceuticals: Annual Revenues, since FY 2021 (USD Billion)
- Table 30.27 Novartis: Annual Revenues, since FY 2021 (USD Billion)
- Table 30.28 Roche: Annual Revenues, since FY 2021 (CHF Billion)
- Table 30.29 Partnerships and Collaborations: Distribution by Year of Partnership
- Table 30.30 Partnerships and Collaborations: Distribution by Type of Partnership
- Table 30.31 Partnerships and Collaborations: Distribution by Year and Type of Partnership
- Table 30.32 Partnerships and Collaborations: Distribution by Target Disease Indication
- Table 30.33 Partnerships and Collaborations: Distribution by Type of Partner
- Table 30.34 Most Active Players: Distribution by Number of Partnerships
- Table 30.35 Partnerships and Collaborations: Local and International Deals
- Table 30.36 Partnerships and Collaborations: Intercontinental and Intracontinental Deals
- Table 30.37 Funding and Investments: Distribution of Funding Instances by Year of Funding
- Table 30.38 Funding and Investments: Distribution of Funding Instances by Type of Funding
- Table 30.39 Funding and Investments: Distribution of Funding Instances by Year and Type of Funding
- Table 30.40 Funding and Investments: Distribution of Amount Invested by Year of Funding
- Table 30.41 Funding and Investments: Distribution of Amount Invested by Type of Funding
- Table 30.42 Funding and Investments: Distribution of Amount Invested by Year and Type of Funding
- Table 30.43 Funding and Investments: Distribution of Funding Instances by Target Disease Indication
- Table 30.44 Funding and Investments: Distribution of Funding Instances by Geography (Region)
- Table 30.45 Funding and Investments: Distribution of Funding Instances by Geography (Country)
- Table 30.46 Most Active Players: Distribution by Number of Instances
- Table 30.47 Most Active Players: Distribution by Amount Invested
- Table 30.48 Leading Investors: Distribution by Number of Funding Instances
- Table 30.49 Funding and Investments: Summary
- Table 30.50 Clinical Trial Analysis: Distribution by Trial Registration Year
- Table 30.51 Clinical Trial Analysis: Distribution by Trial Status
- Table 30.52 Clinical Trial Analysis: Distribution by Trial Registration Year and Trial Status
- Table 30.53 Clinical Trial Analysis: Distribution by Trial Registration Year and Patients Enrolled
- Table 30.54 Clinical Trial Analysis: Distribution by Trial Status and Patients Enrolled
- Table 30.55 Clinical Trial Analysis: Distribution by Trial Phase
- Table 30.56 Clinical Trial Analysis: Distribution by Patients Enrolled and Trial Phase
- Table 30.57 Clinical Trial Analysis: Distribution by Study Design
- Table 30.58 Clinical Trial Analysis: Distribution by Type of Sponsor
- Table 30.59 Clinical Trial Analysis: Distribution by Patient Gender
- Table 30.60 Most Active Industry Players: Distribution by Number of Trials
- Table 30.61 Most Active Non-Industry Players: Distribution by Number of Trials
- Table 30.62 Distribution by Trial Status, Trial Phase and Geography
- Table 30.63 Distribution of Clinical Trials by Trial Status and Geography
- Table 30.64 Distribution of Patients Enrolled by Trial Status and Geography
- Table 30.65 Clinical Trials in North America: Key Insights
- Table 30.66 Clinical Trials in Europe: Key Insights
- Table 30.67 Clinical Trials in Asia-Pacific: Key Insights
- Table 30.68 Clinical Trials in Rest of the World: Key Insights
- Table 30.69 Rare Kidney Disease Drugs / Therapies KOL Analysis: Distribution by Type of KOL
- Table 30.70 Rare Kidney Disease Drugs / Therapies KOL Analysis: Distribution by Qualification
- Table 30.71 Rare Kidney Disease Drugs / Therapies KOL Analysis: Distribution by Type of Organization
- Table 30.72 Rare Kidney Disease Drugs / Therapies KOL Analysis: Distribution by Target Disease Indication
- Table 30.73 Rare Kidney Disease Drugs / Therapies KOL Analysis: Distribution by Geographical Location
- Table 30.74 Benchmarking: Roots Analysis' Assessment vs Third Party Scores
- Table 30.75 Rare Kidney Disease Market, Historical Trends and Forecasted Estimates, till 2040 (USD Billion)
- Table 30.76 Global Rare Kidney Disease Market, Historical Trends and Forecasted Estimates, till 2040: Conservative Scenario (USD Billion)
- Table 30.77 Global Rare Kidney Disease Market, Historical Trends and Forecasted Estimates, till 2040: Optimistic Scenario (USD Billion)
- Table 30.78 Rare Kidney Disease Market: Distribution by Target Disease Indication
- Table 30.79 Rare Kidney Disease Market for Lupus Nephritis: Historical Trends and Forecasted Estimates, till 2040 (USD Million)
- Table 30.80 Rare Kidney Disease Market for Immunoglobulin A Nephropathy: Historical Trends and Forecasted Estimates, till 2040 (USD Million)
- Table 30.81 Rare Kidney Disease Market for Fabry Disease: Historical Trends and Forecasted Estimates, till 2040 (USD Million)
- Table 30.82 Rare Kidney Disease Market for Atypical Hemolytic Uremic Syndrome: Historical Trends and Forecasted Estimates, till 2040 (USD Million)
- Table 30.83 Rare Kidney Disease Market for Focal Segmental Glomerulosclerosis: Historical Trends and Forecasted Estimates, till 2040 (USD Million)
- Table 30.84 Rare Kidney Disease Market for Others: Historical Trends and Forecasted Estimates, till 2040 (USD Million)
- Table 30.85 Rare Kidney Disease Market: Distribution by Type of Molecule
- Table 30.86 Rare Kidney Disease Market for Small Molecules: Historical Trends and Forecasted Estimates, till 2040 (USD Million)
- Table 30.87 Rare Kidney Disease Market for Biologics: Historical Trends and Forecasted Estimates, till 2040 (USD Million)
- Table 30.88 Rare Kidney Disease Market: Distribution by Type of Biologic
- Table 30.89 Rare Kidney Disease Market for Monoclonal Antibodies: Historical Trends and Forecasted Estimates, till 2040 (USD Million)
- Table 30.90 Rare Kidney Disease Market for Enzymes: Historical Trends and Forecasted Estimates, till 2040 (USD Million)
- Table 30.91 Rare Kidney Disease Market for Proteins: Historical Trends and Forecasted Estimates, till 2040 (USD Million)
- Table 30.92 Rare Kidney Disease Market for Hormones: Historical Trends and Forecasted Estimates, till 2040 (USD Million)
- Table 30.93 Rare Kidney Disease Market: Distribution by Route of Administration
- Table 30.94 Rare Kidney Disease Market for Oral Route: Historical Trends and Forecasted Estimates, till 2040 (USD Million)
- Table 30.95 Rare Kidney Disease Market for Intravenous Route: Historical Trends and Forecasted Estimates, till 2040 (USD Million)
- Table 30.96 Rare Kidney Disease Market for Subcutaneous Route: Historical Trends and Forecasted Estimates, till 2040 (USD Million)
- Table 30.97 Rare Kidney Disease Market: Distribution by Type of Therapy
- Table 30.98 Rare Kidney Disease Market for Monotherapy: Historical Trends and Forecasted Estimates, till 2040 (USD Million)
- Table 30.99 Rare Kidney Disease Market for Combination Therapy: Historical Trends and Forecasted Estimates, till 2040 (USD Million)
- Table 30.100 Rare Kidney Disease Market: Distribution by Key Geographical Regions
- Table 30.101 Rare Kidney Disease Market in North America: Historical Trends and Forecasted Estimates, till 2040 (USD Million)
- Table 30.102 Rare Kidney Disease Market in the US: Historical Trends and Forecasted Estimates, till 2040 (USD Million)
- Table 30.103 Rare Kidney Disease Market in Canada: Historical Trends and Forecasted Estimates, till 2040 (USD Million)
- Table 30.104 Rare Kidney Disease Market in Europe: Historical Trends and Forecasted Estimates, till 2040 (USD Million)
- Table 30.105 Rare Kidney Disease Market in Germany: Historical Trends and Forecasted Estimates, till 2040 (USD Million)
- Table 30.106 Rare Kidney Disease Market in UK: Historical Trends and Forecasted Estimates, till 2040 (USD Million)
- Table 30.107 Rare Kidney Disease Market in Spain: Historical Trends and Forecasted Estimates, till 2040 (USD Million)
- Table 30.108 Rare Kidney Disease Market in France: Historical Trends and Forecasted Estimates, till 2040 (USD Million)
- Table 30.109 Rare Kidney Disease Market in Italy: Historical Trends and Forecasted Estimates, till 2040 (USD Million)
- Table 30.110 Rare Kidney Disease Market in Asia-Pacific: Historical Trends and Forecasted Estimates, till 2040 (USD Million)
- Table 30.111 Rare Kidney Disease Market in China: Historical Trends and Forecasted Estimates, till 2040 (USD Million)
- Table 30.112 Rare Kidney Disease Market in India: Historical Trends and Forecasted Estimates, till 2040 (USD Million)
- Table 30.113 Rare Kidney Disease Market in South Korea: Historical Trends and Forecasted Estimates, till 2040 (USD Million)
- Table 30.114 Rare Kidney Disease Market in Japan: Historical Trends and Forecasted Estimates, till 2040 (USD Million)
- Table 30.115 Rare Kidney Disease Market in Australia: Historical Trends and Forecasted Estimates, till 2040 (USD Million)
- Table 30.116 Rare Kidney Disease Market in Taiwan: Historical Trends and Forecasted Estimates, till 2040 (USD Million)
- Table 30.117 Benlysta(R) (Lupus Nephritis): Sales Forecast (USD Million)
- Table 30.118 Elfabrio(R) (Fabry Disease): Sales Forecast (USD Million)
- Table 30.119 FILSPARI(R) (Immunoglobulin A Nephropathy): Sales Forecast (USD Million)
- Table 30.120 FABHALTA(R) (Immunoglobulin A Nephropathy): Sales Forecast (USD Million)
- Table 30.121 Galafold(R) (Fabry Disease): Sales Forecast (USD Million)
- Table 30.122 LUPKYNIS(R) (Lupus Nephritis): Sales Forecast (USD Million)
- Table 30.123 Sibnayal(R) (Distal Renal Tubular Acidosis): Sales Forecast (USD Million)
- Table 30.124 Tarpeyo(R) (Immunoglobulin A Nephropathy): Sales Forecast (USD Million)
- Table 30.125 TERLIVAZ(R) (Hepatorenal Syndrome): Sales Forecast (USD Million)
- Table 30.126 ULTOMIRIS(R) (Atypical Hemolytic Uremic Syndrome): Sales Forecast (USD Million)
- Table 30.127 ALPN-303 (Immunoglobulin A Nephropathy): Sales Forecast (USD Million)
- Table 30.128 APL-2 (C3 Glomerulopathy): Sales Forecast (USD Million)
- Table 30.129 APL-2 (Membranous Nephropathy): Sales Forecast (USD Million)
- Table 30.130 Atacicept (Immunoglobulin A Nephropathy): Sales Forecast (USD Million)
- Table 30.131 Atacicept (Lupus Nephritis): Sales Forecast (USD Million)
- Table 30.132 Atrasentan (Immunoglobulin A Nephropathy): Sales Forecast (USD Million)
- Table 30.133 Crovalimab (Atypical Hemolytic Uremic Syndrome): Sales Forecast (USD Million)
- Table 30.134 FILSPARI(R) (Focal Segmental Glomerulosclerosis): Sales Forecast (USD Million)
- Table 30.135 Ianalumab (Lupus Nephritis): Sales Forecast (USD Million)
- Table 30.136 Iptacopan (Atypical Hemolytic Uremic Syndrome): Sales Forecast (USD Million)
- Table 30.137 Iptacopan (C3 Glomerulopathy): Sales Forecast (USD Million)
- Table 30.138 Lucerastat (Fabry Disease): Sales Forecast (USD Million)
- Table 30.139 MIL62 (Membranous Nephropathy): Sales Forecast (USD Million)
- Table 30.140 Obinutuzumab (Nephrotic Syndrome): Sales Forecast (USD Million)
- Table 30.141 Obinutuzumab (Membranous Nephropathy): Sales Forecast (USD Million)
- Table 30.142 Obinutuzumab (Lupus Nephritis): Sales Forecast (USD Million)
- Table 30.143 Repagermanium (Focal Segmental Glomerulosclerosis): Sales Forecast (USD Million)
- Table 30.144 Saphnelo(TM) (Lupus Nephritis): Sales Forecast (USD Million)
- Table 30.145 Sibeprenlimab (Immunoglobulin A Nephropathy): Sales Forecast (USD Million)
- Table 30.146 SNP-ACTH (Membranous Nephropathy): Sales Forecast (USD Million)
- Table 30.147 Telitacicept (Immunoglobulin A Nephropathy): Sales Forecast (USD Million)
- Table 30.148 Tolvaptan (Autosomal Recessive Polycystic Kidney Disease): Sales Forecast (USD Million)
- Table 30.149 ULTOMIRIS(R) (Immunoglobulin A Nephropathy): Sales Forecast (USD Million)
- Table 30.150 Venglustat (Fabry Disease): Sales Forecast (USD Million)
- Table 30.151 Zigakibart (Immunoglobulin A Nephropathy): Sales Forecast (USD Million)
- Table 30.152 Rare Kidney Disease Market: Distribution by Leading Players, 2025 (based on revenues generated) (USD Billion)
- Table 30.153 Rare Kidney Disease Market: Distribution by Leading Players, 2035 (based on revenues generated) (USD Billion)
RARE KIDNEY DISEASES MARKET
As per Roots Analysis, the global rare kidney diseases market size is valued at USD 2.2 billion in 2024 and is projected to reach USD 2.8 billion in the current year and USD 11. 6 billion by 2035, growing at a CAGR of 15.2% during the forecast period.
The opportunity for rare kidney diseases market has been distributed across the following segments:
Target Disease Indications
- Atypical Hemolytic Uremic Syndrome
- Fabry Disease
- Focal Segmental Glomerulosclerosis
- Immunoglobulin A Nephropathy
- Lupus Nephritis
- Others
Type of Molecule
- Biologics
- Small Molecules
Type of Biologic
- Enzymes
- Hormones
- Monoclonal Antibodies
- Proteins
Route of Administration
- Intravenous
- Oral
- Subcutaneous
Type of Therapy
- Monotherapy
- Combination Therapy
Key Geographical Regions
- North America
- Europe
- Asia-Pacific
RARE KIDNEY DISEASES MARKET: GROWTH AND TRENDS
Kidney diseases include a wide array of conditions that hinder the natural ability of the kidney to efficiently filter waste and excess fluid from the blood. These diseases also compromise the overall function of the kidneys to regulate blood pressure and maintain the overall fluid balance in the body. Notably, in the early stages, kidney diseases often present no symptoms, making the diagnosis challenging. However, as waste accumulates in the body, patients may experience symptoms, such as high blood pressure, anemia, poor nutritional health and nerve damage. According to the US Centers for Disease Control and Prevention, approximately 35.5 million people in the US were estimated to be affected by kidney diseases, in 2024, accounting for nearly 14% of the overall population. A subset of these conditions, rare kidney diseases, affect a smaller fraction of individuals worldwide. Under the Orphan Drug Act, a disease is classified as rare in the US if it affects less than 200,000 people. However, in the European Union, rare diseases are defined as those impacting around 5 per 10,000 Europeans.
Rare kidney diseases primarily affect the kidneys' filtering units (known as glomeruli), leading to the spillage of protein components and blood into the urine. These conditions can either be congenital, acquired or inherited, making it difficult to identify specific biomarkers for diagnosis and treatment. Without timely intervention, rare kidney diseases often lead to kidney failure, necessitating dialysis or transplantation. It is important to mention that kidney failure due to a rare chronic kidney disease has been observed in at least 3 out of 5 children and 1 in 9 adults suffering from kidney diseases. To address these challenges, significant advancements have been made in diagnosing and treating rare kidney diseases. Precision medicines, including genomic sequencing and personalized therapies, have enabled the targeted treatment of these diseases. Additionally, the integration of big data and machine learning has helped several drug developers and researchers by improving patient recruitment for clinical trials and identifying accurate urinary biomarkers for tailored treatment.
Moreover, substantial investment from both public and private sectors accelerates research and development in this domain. Presently, drug developers have secured over USD 12 billion in funding for rare kidney research and treatment development. Further, with a growing focus on efficient diagnosis and treatment, the market for rare kidney disease drugs / therapies is poised for robust growth, presenting significant opportunities for stakeholders in the coming years.
RARE KIDNEY DISEASES MARKET: KEY INSIGHTS
The report delves into the current state of the rare kidney diseases market and identifies potential growth opportunities within the industry. Some key findings from the report include:
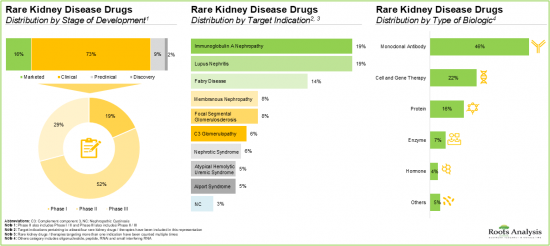
- Over 70% of the rare kidney drugs / therapies are in clinical stages of development; notably, most of the drugs / therapies are being investigated for the treatment of immunoglobulin A nephropathy and lupus nephritis.
- The rising interest in this domain is evident from the wide array of partnerships established between various stakeholders in the recent past; in fact, 65% of the total deals were inked in the last three years.
- Several investors, having realized the opportunity within this domain, have invested significant capital across various funding rounds; 45% of the investments in this domain were made through secondary offerings.
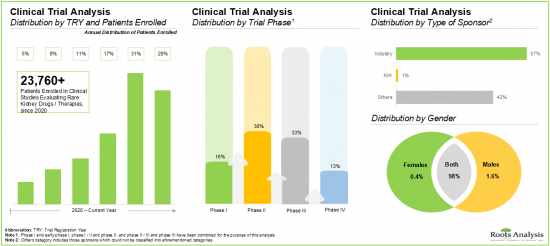
- Nearly 40% of the drugs targeting rare kidney diseases are currently in Phase II of clinical development; notably, around 60% of the trials have been sponsored by industry players.
- The rare kidney disease market is likely to grow at an annualized rate (CAGR) of ~15%, till 2035; the majority of the market share (~70%) is expected to be captured by North America, by 2035.
- Currently, the monoclonal antibodies dominate the market; notably, oral route of administration is anticipated to capture the majority share in the market by 2035.
RARE KIDNEY DISEASES MARKET: KEY SEGMENTS
Lupus Nephritis is the Fastest Growing Segment in the Rare Kidney Diseases Market
Based on the type of target disease indication, the global rare kidney disease market is segmented into atypical hemolytic uremic syndrome, Fabry disease, focal segmental glomerulosclerosis, immunoglobulin A nephropathy, lupus nephritis, and others. Currently, the majority share of the rare kidney disease market is captured by lupus nephritis, due to the increasing awareness regarding the adversity of the disease among both patient population and healthcare professionals.
Small Molecules are Likely to Hold the Largest Share of the Rare Kidney Diseases Market During the Forecast Period
Based on the type of molecule, the global market is segmented into small molecules and biologics. Amongst these types, the small molecules segment occupies the largest share of the current overall market. However, it is important to note that biologics are expected to emerge as a promising alternative that can target underlying biological pathways associated with rare kidney disease, therefore, capturing a larger market share in the coming years.
Rare Kidney Diseases Market for Proteins is Likely to Grow at a Relatively Faster Pace During the Forecast Period
Based on the type of biologic, the global market value is segmented across enzymes, hormones, monoclonal antibodies, and proteins. Notably, the monoclonal antibodies segment dominates the current market. Moreover, this trend is unlikely to change in the foreseen future owing to their proven precision in treating rare kidney diseases.
Oral Route of Administration Holds the Largest Share of the Rare Kidney Diseases Market
Based on the route of administration, the global market is segmented across intravenous, oral and subcutaneous routes of administration. Currently, the oral route is expected to hold the majority rare kidney disease market share owing to its non-invasive nature and increased patient compliance as compared to other routes. However, it is worth mentioning that this trend is expected to change during the forecast period, with the subcutaneous route of administration capturing a larger share of the overall market in the coming years.
By Type of Therapy, Monotherapy Segment is Likely to Dominate the Market During the Forecast Period
Based on the type of therapy, the global market for rare kidney diseases is segmented across monotherapy and combination therapy. At present, the monotherapy segment holds the maximum share in the overall market. However, the market for combination therapy is likely to grow at a relatively higher CAGR during the forecast period.
North America Accounts for the Largest Share of the Market
Based on key geographical regions, the market is segmented into North America, Europe, and Asia-Pacific. In the current scenario, North America is likely to capture the largest market share. However, the market in Asia-Pacific is expected to grow at a faster pace during the forecast period owing to the fact that various Asian countries, such as China, Japan, Korea, and India are reporting increasing incidence rates of rare kidney diseases which necessitates more effective treatment management systems in this region.
Example Players in the Rare Kidney Diseases Market
- Alexion Pharmaceuticals
- Amicus Therapeutics
- Apellis Pharmaceuticals
- Aurinia Pharmaceuticals
- GlaxoSmithKline
- Novartis
- Roche
- Travere Therapeutics
- Vera Therapeutics
RARE KIDNEY DISEASES MARKET: RESEARCH COVERAGE
The report on Rare Kidney Diseases Market features insights into various sections, including:
- Market Sizing and Opportunity Analysis: An in-depth analysis of the rare kidney diseases market, focusing on key market segments, including [A] type of disease indication, [B] type of molecule, [C] type of biologic, [D] route of administration, [E] type of therapy, [F] key geographical regions, and [G] key players.
- Market Impact Analysis: A thorough analysis of various factors, such as drivers, restraints, opportunities, and existing challenges that are likely to impact market growth.
- Market Landscape: A comprehensive evaluation of rare kidney diseases drugs / therapies developers, based on several relevant parameters, such as [A] stage of development, [B] target indication, [C] route of administration, [D] type of molecule, [E] type of biologic, [F] dosing frequency, [G] target patient population, and [H] type of therapy.
- Rare Kidney Diseases Drug / Therapies Developer Landscape: The report features a list of leading players engaged in the rare kidney diseases domain, along with analyses based on [A] year of establishment, [B] company size, [C] location of headquarters, and [D] most active players (in terms of number of drugs / therapies developed).
- Company Competitiveness Analysis: An insightful competitiveness analysis of the companies engaged in the rare kidney diseases domain, based on various relevant parameters, such as [A] company strength, [B] portfolio strength, and [C] pipeline diversity.
- Company Profiles: In-depth profiles of key industry players offering rare kidney drugs / therapies across various geographies, focusing on [A] company overviews, [B] drug portfolio, [C] financial information (if available), [D] recent developments and [E] an informed future outlook.
- Partnerships and Collaborations: A detailed analysis of partnerships inked between stakeholders in the rare kidney diseases market, since 2019, based on several relevant parameters, such as [A] year of partnership, [B] type of partnership, [C] target disease indication, [D] type of partner, [E] most active players (in terms of number of partnerships), and [F] geography.
- Funding and Investments Analysis: A detailed analysis of the various funding and investments raised in the rare kidney diseases domain, based on several relevant parameters, such as [A] year of funding, [B] type of funding, [C] amount of funding, [D] target disease indication, [E] geography, and [F] most active players (in terms of number of funding instances).
- Clinical Trial Analysis: An in-depth analysis of completed / ongoing clinical trials related to rare kidney diseases drugs / therapies, based on various relevant parameters, such as [A] trial registration year, [B] trial status, [C] number of patients enrolled, [D] trial phase, [E] study design (type of trial masking, type of intervention model, trial purpose and design allocation), [F] type of sponsor, [G] patient gender, [H] most active sponsor / collaborator (leading industry and non-industry players based on the number of registered trials), and [I] geography.
- Clinical Commercial Attractiveness: A detailed analysis of the clinical and commercial attractiveness for phase III drugs / therapies targeting rare kidney diseases, based on several parameters, such as [A] type of molecule, [B] dosing frequency, [C] route of administration, [D] number of patients enrolled, [E] company size, [F] patient population, and [G] location of clinical trials.
- KOL Analysis: An insightful analysis, highlighting the key opinion leaders investigating the clinical trials related to rare kidney diseases, based on several parameters, such as [A] type of KOL, [B] qualification, [C] type of organization, [D] geographical location of KOLs, [E] target disease indication, and [F] most prominent KOLs (based on our proprietary and third-party scoring criteria).
- Case Study: An insightful case study highlighting the developers engaged in offering kidney care services, along with information on [A] year of establishment, [B] company size, [C] location of headquarters, [D] target indications, [E] benefits offered by the kidney care companies, and [F] recent developments in the domain.
KEY QUESTIONS ANSWERED IN THIS REPORT
- How many companies are currently engaged in this market?
- Which are the leading companies in this market?
- What factors are likely to influence the evolution of this market?
- What is the current and future market size?
- What is the CAGR of this market?
- How is the current and future market opportunity likely to be distributed across key market segments?
- What is the patent filing activity trend in the market?
REASONS TO BUY THIS REPORT
- The report provides a comprehensive market analysis, offering detailed revenue projections of the overall market and its specific sub-segments. This information is valuable to both established market leaders and emerging entrants.
- Stakeholders can leverage the report to gain a deeper understanding of the competitive dynamics within the market. By analyzing the competitive landscape, businesses can make informed decisions to optimize their market positioning and develop effective go-to-market strategies.
- The report offers stakeholders a comprehensive overview of the market, including key drivers, barriers, opportunities, and challenges. This information empowers stakeholders to stay abreast of market trends and make data-driven decisions to capitalize on growth prospects.
ADDITIONAL BENEFITS
- Complimentary Excel Data Packs
- 10% Free Content Customization
- Detailed Report Walkthrough Session with Research Team
- Free Updated report if the report is 6-12 months old or older
TABLE OF CONTENTS
SECTION I: REPORT OVERVIEW
1. BACKGROUND
- 1.1. Context
- 1.2. Project Objectives
2. RESEARCH METHODOLOGY
- 2.1. Chapter Overview
- 2.2. Research Assumptions
- 2.2.1. Market Landscape and Market Trends
- 2.2.2. Market Forecast and Opportunity Analysis
- 2.2.3. Comparative Analysis
- 2.3. Database Building
- 2.3.1. Data Collection
- 2.3.2. Data Validation
- 2.3.3. Data Analysis
- 2.4. Project Methodology
- 2.4.1. Secondary Research
- 2.4.1.1. Annual Reports
- 2.4.1.2. Academic Research Papers
- 2.4.1.3. Company Websites
- 2.4.1.4. Investor Presentations
- 2.4.1.5. Regulatory Filings
- 2.4.1.6. White Papers
- 2.4.1.7. Industry Publications
- 2.4.1.8. Conferences and Seminars
- 2.4.1.9. Government Portals
- 2.4.1.10. Media and Press Releases
- 2.4.1.11. Newsletters
- 2.4.1.12. Industry Databases
- 2.4.1.13. Roots Proprietary Databases
- 2.4.1.14. Paid Databases and Sources
- 2.4.1.15. Social Media Portals
- 2.4.1.16. Other Secondary Sources
- 2.4.2. Primary Research
- 2.4.2.1. Types of Primary Research
- 2.4.2.1.1. Qualitative Research
- 2.4.2.1.2. Quantitative Research
- 2.4.2.1.3. Hybrid Approach
- 2.4.2.2. Advantages of Primary Research
- 2.4.2.3. Techniques for Primary Research
- 2.4.2.3.1. Interviews
- 2.4.2.3.2. Surveys
- 2.4.2.3.3. Focus Groups
- 2.4.2.3.4. Observational Research
- 2.4.2.3.5. Social Media Interactions
- 2.4.2.4. Key Opinion Leaders Considered in Primary Research
- 2.4.2.4.1. Company Executives (CXOs)
- 2.4.2.4.2. Board of Directors
- 2.4.2.4.3. Company Presidents and Vice Presidents
- 2.4.2.4.4. Research and Development Heads
- 2.4.2.4.5. Technical Experts
- 2.4.2.4.6. Subject Matter Experts
- 2.4.2.4.7. Scientists
- 2.4.2.4.8. Doctors and Other Healthcare Providers
- 2.4.2.5. Ethics and Integrity
- 2.4.2.5.1. Research Ethics
- 2.4.2.5.2. Data Integrity
- 2.4.2.1. Types of Primary Research
- 2.4.3. Analytical Tools and Databases
- 2.4.1. Secondary Research
- 2.5. Robust Quality Control
3. MARKET DYNAMICS
- 3.1. Chapter Overview
- 3.2. Forecast Methodology
- 3.2.1. Top-down Approach
- 3.2.2. Bottom-up Approach
- 3.2.3. Hybrid Approach
- 3.3. Market Assessment Framework
- 3.3.1. Total Addressable Market (TAM)
- 3.3.2. Serviceable Addressable Market (SAM)
- 3.3.3. Serviceable Obtainable Market (SOM)
- 3.3.4. Currently Acquired Market (CAM)
- 3.4. Forecasting Tools and Techniques
- 3.4.1. Qualitative Forecasting
- 3.4.2. Correlation
- 3.4.3. Regression
- 3.4.4. Extrapolation
- 3.4.5. Convergence
- 3.4.6. Sensitivity Analysis
- 3.4.7. Scenario Planning
- 3.4.8. Data Visualization
- 3.4.9. Time Series Analysis
- 3.4.10. Forecast Error Analysis
- 3.5. Key Considerations
- 3.5.1. Demographics
- 3.5.2. Government Regulations
- 3.5.3. Reimbursement Scenarios
- 3.5.4. Market Access
- 3.5.5. Supply Chain
- 3.5.6. Industry Consolidation
- 3.5.7. Pandemic / Unforeseen Disruptions Impact
- 3.6. Limitations
4. MACRO-ECONOMIC INDICATORS
- 4.1. Chapter Overview
- 4.2. Market Dynamics
- 4.2.1. Time Period
- 4.2.1.1. Historical Trends
- 4.2.1.2. Current and Forecasted Estimates
- 4.2.2. Currency Coverage
- 4.2.2.1. Major Currencies Affecting the Market
- 4.2.2.2. Factors Affecting Currency Fluctuations on the Industry
- 4.2.2.3. Impact of Currency Fluctuations on the Industry
- 4.2.3. Foreign Currency Exchange Rate
- 4.2.3.1. Impact of Foreign Exchange Rate Volatility on the Market
- 4.2.3.2. Strategies for Mitigating Foreign Exchange Risk
- 4.2.4. Recession
- 4.2.4.1. Assessment of Current Economic Conditions and Potential Impact on the Market
- 4.2.4.2. Historical Analysis of Past Recessions and Lessons Learnt
- 4.2.5. Inflation
- 4.2.5.1. Measurement and Analysis of Inflationary Pressures in the Economy
- 4.2.5.2. Potential Impact of Inflation on the Market Evolution
- 4.2.6. Interest Rates
- 4.2.6.1. Interest Rates and Their Impact on the Market
- 4.2.6.2. Strategies for Managing Interest Rate Risk
- 4.2.7. Commodity Flow Analysis
- 4.2.7.1. Type of Commodity
- 4.2.7.2. Origins and Destinations
- 4.2.7.3. Values and Weights
- 4.2.7.4. Modes of Transportation
- 4.2.8. Global Trade Dynamics
- 4.2.8.1. Import Scenario
- 4.2.8.2. Export Scenario
- 4.2.8.3. Trade Policies
- 4.2.8.4. Strategies for Mitigating the Risks Associated with Trade Barriers
- 4.2.8.5. Impact of Trade Barriers on the Market
- 4.2.9. War Impact Analysis
- 4.2.9.1. Russian-Ukraine War
- 4.2.9.2. Israel-Hamas War
- 4.2.10. COVID Impact / Related Factors
- 4.2.10.1. Global Economic Impact
- 4.2.10.2. Industry-specific Impact
- 4.2.10.3. Government Response and Stimulus Measures
- 4.2.10.4. Future Outlook and Adaptation Strategies
- 4.2.11. Other Indicators
- 4.2.11.1. Fiscal Policy
- 4.2.11.2. Consumer Spending
- 4.2.11.3. Gross Domestic Product
- 4.2.11.4. Employment
- 4.2.11.5. Taxes
- 4.2.11.6. Stock Market Performance
- 4.2.11.7. Cross Border Dynamics
- 4.2.1. Time Period
- 4.3. Conclusion
SECTION II: QUALITATIVE INSIGHTS
5. EXECUTIVE SUMMARY
6. INTRODUCTION
- 6.1. Overview of Kidney Diseases
- 6.1.1. Key Historical Events related to Kidney Diseases
- 6.1.2. Factors Contributing to the Onset of Kidney Diseases
- 6.2. Selection of Therapeutic Targets for Rare Kidney Diseases
- 6.3. Technological Advancements in the Rare Kidney Diseases Domain
- 6.4. Recent Developments in the Rare Kidney Diseases Domain
- 6.5. Future Perspectives
SECTION III: COMPETITIVE LANDSCAPE
7. MARKET LANDSCAPE
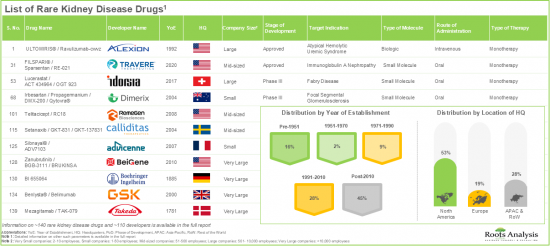
- 7.1. Rare Kidney Disease Drugs / Therapies: Market Landscape
- 7.1.1. Analysis by Stage of Development
- 7.1.2. Analysis by Target Indication
- 7.1.3. Analysis by Route of Administration
- 7.1.4. Analysis by Type of Molecule
- 7.1.5. Analysis by Type of Biologic
- 7.1.6. Analysis by Dosing Frequency
- 7.1.7. Analysis by Target Patient Population
- 7.1.8. Analysis by Type of Therapy
- 7.2. Rare Kidney Disease Drugs / Therapies: Developer Landscape
- 7.2.1. Analysis by Year of Establishment
- 7.2.2. Analysis by Company Size
- 7.2.3. Analysis by Location of Headquarters
- 7.2.4. Analysis by Company Size and Location of Headquarters
- 7.2.5. Most Active Players: Analysis by Number of Drugs / Therapies Developed
8. COMPANY COMPETITIVENESS ANALYSIS
- 8.1 Methodology and Key Parameters
- 8.2. Scoring
- 8.3. Peer Groups
- 8.3.1. Overview of Developers based in North America
- 8.3.1.1. Competitiveness Analysis of Players based in North America
- 8.3.1.2. Leading Players based in North America
- 8.3.2. Overview of Developers based in Europe
- 8.3.2.1. Competitiveness Analysis of Players based in Europe
- 8.3.2.2. Leading Players based in Europe
- 8.3.3. Overview of Developers based in Asia-Pacific and Rest of the World
- 8.3.3.1. Competitiveness Analysis of Players based in Asia-Pacific and Rest of the World
- 8.3.3.2. Leading Players based in Asia-Pacific and Rest of the World
- 8.3.1. Overview of Developers based in North America
SECTION IV: COMPANY PROFILES
9. RARE KIDNEY DISEASE MARKET: COMPANY PROFILES OF DRUG / THERAPY DEVELOPERS BASED IN NORTH AMERICA
- 9.1. Chapter Overview
- 9.2. Alexion Pharmaceuticals
- 9.2.1. Company Details
- 9.2.2. Drug Portfolio
- 9.2.3. Financial Details
- 9.2.4. Recent Developments and Future Outlook
- 9.3. Biogen
- 9.3.1. Company Details
- 9.3.2. Drug Portfolio
- 9.3.3. Financial Details
- 9.3.4. Recent Developments and Future Outlook
- 9.4. NovelMed
- 9.4.1. Company Details
- 9.4.2. Drug Portfolio
- 9.4.3. Recent Developments and Future Outlook
- 9.5. Travere Therapeutics
- 9.5.1. Company Details
- 9.5.2. Drug Portfolio
- 9.5.3. Financial Details
- 9.5.4. Recent Developments and Future Outlook
- 9.6. Vertex Pharmaceuticals
- 9.6.1. Company Details
- 9.6.2. Drug Portfolio
- 9.6.3. Financial Details
- 9.6.4. Recent Developments and Future Outlook
- 9.7. Amgen
- 9.7.1. Company Details
- 9.7.2. Drug Portfolio
- 9.8. Vera Therapeutics
- 9.8.1. Company Details
- 9.8.2. Drug Portfolio
- 9.9. ZyVersa Therapeutics
- 9.9.1. Company Details
- 9.9.2. Drug Portfolio
10. RARE KIDNEY DISEASE MARKET: COMPANY PROFILES OF DRUG / THERAPY DEVELOPERS BASED IN EUROPE
- 10.1. Chapter Overview
- 10.2. Novartis
- 10.2.1. Company Details
- 10.2.2. Drug Portfolio
- 10.2.3. Financial Details
- 10.2.4. Recent Developments and Future Outlook
- 10.3. Roche
- 10.3.1. Company Details
- 10.3.2. Drug Portfolio
- 10.3.3. Financial Details
- 10.3.4. Recent Developments and Future Outlook
- 10.4. Advicenne
- 10.4.1. Company Details
- 10.4.2. Drug Portfolio
- 10.5. Boehringer Ingelheim
- 10.5.1. Company Details
- 10.5.2. Drug Portfolio
- 10.6. Calliditas Therapeutics
- 10.6.1. Company Details
- 10.6.2. Drug Portfolio
11. RARE KIDNEY DISEASE MARKET: COMPANY PROFILES OF DRUG / THERAPY DEVELOPERS BASED IN ASIA-PACIFIC
- 11.1. Chapter Overview
- 11.2. Jiangsu Hengrui Pharmaceuticals
- 11.2.1. Company Details
- 11.2.2. Drug Portfolio
- 11.2.3. Recent Developments and Future Outlook
- 11.2. Asahi Kasei
- 11.2.1. Company Details
- 11.2.2. Drug Portfolio
SECTION V: MARKET TRENDS
12. PARTNERSHIPS AND COLLABORATIONS
- 12.1. Partnership Models
- 12.2. Rare Kidney Disease Drugs / Therapies: Partnerships and Collaborations
- 12.2.1. Analysis by Year of Partnership
- 12.2.2. Analysis by Type of Partnership
- 12.2.3. Analysis by Year and Type of Partnership
- 12.2.4. Analysis by Target Disease Indication
- 12.2.5. Analysis by Type of Partner
- 12.2.6. Most Active Players: Analysis by Number of Partnerships
- 12.2.7. Local and International Deals
- 12.2.8. Intercontinental and Intracontinental Deals
13. FUNDING AND INVESTMENTS
- 13.1. Funding Models
- 13.2. Funding Lifecycle Analysis
- 13.3. Investment Case: Risk and Return
- 13.4. Rare Kidney Disease Drugs / Therapies: Funding and Investments
- 13.4.1. Analysis of Funding Instances by Year of Funding
- 13.4.2. Analysis of Funding Instances by Type of Funding
- 13.4.3. Analysis of Funding Instances by Year and Type of Funding
- 13.4.4. Analysis of Amount Invested by Year of Funding
- 13.4.5. Analysis of Amount Invested by Type of Funding
- 13.4.6. Analysis of Amount Invested by Year and Type of Funding
- 13.4.7. Analysis of Funding Instances by Target Disease Indication
- 13.4.8. Analysis of Funding Instances by Geography (Region)
- 13.4.9. Analysis of Funding Instances by Geography (Country)
- 13.4.10. Most Active Players: Analysis by Number of Funding Instances
- 13.4.11. Most Active Players: Analysis by Amount Invested
- 13.4.12. Leading Investors: Analysis by Number of Funding Instances
- 13.5. Summary of Investments
14. CLINICAL TRIAL ANALYSIS
- 14.1. Methodology and Key Parameters
- 14.2. Rare Kidney Disease Drugs / Therapies: Clinical Trial Analysis
- 14.2.1. Analysis by Trial Registration Year
- 14.2.2. Analysis by Trial Status
- 14.2.3. Analysis by Trial Registration Year and Trial Status
- 14.2.4. Analysis by Trial Registration Year and Patients Enrolled
- 14.2.5. Analysis by Trial Status and Patients Enrolled
- 14.2.6. Analysis by Trial Phase
- 14.2.7. Analysis by Patients Enrolled and Trial Phase
- 14.2.8. Analysis by Study Design
- 14.2.9. Analysis by Type of Sponsor
- 14.2.10. Analysis by Patient Gender
- 14.2.11. Most Active Industry Players: Analysis by Number of Trials
- 14.2.12. Most Active Non-Industry Players: Analysis by Number of Trials
- 14.2.13. Analysis by Geography
- 14.2.13.1. Analysis by Trial Status, Trial Phase and Geography
- 14.2.13.2. Analysis by Trial Status and Geography
- 14.2.14. Geographical Distribution of Trials and Number of Patients Enrolled
- 14.2.14.1. Clinical Trials in North America: Key Insights
- 14.2.14.2. Clinical Trials in Europe: Key Insights
- 14.2.14.3. Clinical Trials in Asia-Pacific: Key Insights
- 14.2.14.4. Clinical Trials in Rest of the World: Key Insights
15. CLINICAL COMMERCIAL ATTRACTIVENESS
- 15.1. Methodology and Key Parameters
- 15.2. Scoring
- 15.3. Phase III Drugs / Therapies Targeting Rare Kidney Diseases
16. KEY OPINION LEADERS
- 16.1. Methodology and Key Parameters
- 16.2. Rare Kidney Disease Drugs / Therapies: Key Opinion Leaders
- 16.2.1. Analysis by Type of Key Opinion Leader
- 16.2.2. Analysis by Qualification
- 16.2.3. Analysis by Type of Organization
- 16.2.4. Analysis by Target Disease Indication
- 16.2.5. Analysis by Region of Key Opinion Leaders
- 16.3. Scoring Criteria
- 16.3.1. Most Prominent Key Opinion Leaders
- 16.3.2. Benchmarking: Roots Analysis' Assessment vs Third Party Scores
17. RARE KIDNEY DISEASE MARKET: CASE STUDY
- 17.1. Methodology
- 17.2. Rare Kidney Disease Market: List of Kidney Care Companies
- 17.3. Benefits Offered by Kidney Care Companies
- 17.4. Recent Developments
SECTION VI: MARKET FORECAST AND OPPORTUNITY ANALYSIS
18. MARKET IMPACT ANALYSIS: DRIVERS, RESTRAINTS, OPPORTUNITIES AND CHALLENGES
- 18.1. Chapter Overview
- 18.2. Market Drivers
- 18.3. Market Restraints
- 18.4. Market Opportunities
- 18.5. Market Challenges
- 18.6. Conclusion
19. RARE KIDNEY DISEASE MARKET
- 19.1. Key Assumptions and Methodology
- 19.2. Global Rare Kidney Disease Market: Historical Trends and Forecasted Estimates, till 2040
- 19.2.1. Comparison with Previous Edition
- 19.2.2. Multivariate Scenario Analysis
- 19.2.2.1. Conservative Scenario
- 19.2.2.2. Optimistic Scenario
- 19.3. Key Market Segmentations
20. RARE KIDNEY DISEASE MARKET, BY TARGET DISEASE INDICATION
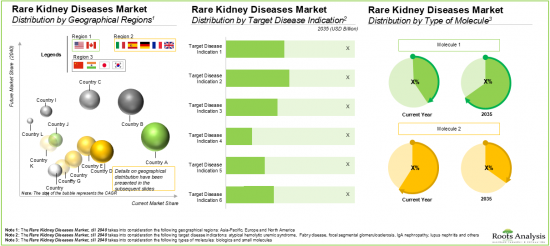
- 20.1. Rare Kidney Disease Market: Distribution by Target Disease Indication
- 20.1.1. Rare Kidney Disease Market for Lupus Nephritis: Historical Trends and Forecasted Estimates, till 2040
- 20.1.2. Rare Kidney Disease Market for Immunoglobulin A Nephropathy: Historical Trends and Forecasted Estimates, till 2040
- 20.1.3. Rare Kidney Disease Market for Fabry Disease: Historical Trends and Forecasted Estimates, till 2040
- 20.1.4. Rare Kidney Disease Market for Atypical Hemolytic Uremic Syndrome: Historical Trends and Forecasted Estimates, till 2040
- 20.1.5. Rare Kidney Disease Market for Focal Segmental Glomerulosclerosis: Historical Trends and Forecasted Estimates, till 2040
- 20.1.6. Rare Kidney Disease Market for Others: Historical Trends and Forecasted Estimates, till 2040
21. RARE KIDNEY DISEASE MARKET, BY TYPE OF MOLECULE
- 21.1. Rare Kidney Disease Market: Distribution by Type of Molecule
- 21.1.1. Rare Kidney Disease Market for Small Molecules: Historical Trends and Forecasted Estimates, till 2040
- 21.1.2. Rare Kidney Disease Market for Biologics: Historical Trends and Forecasted Estimates, till 2040
22. RARE KIDNEY DISEASE MARKET, BY TYPE OF BIOLOGIC
- 22.1. Rare Kidney Disease Market: Distribution by Type of Biologic
- 22.1.1. Rare Kidney Disease Market for Monoclonal Antibodies: Historical Trends and Forecasted Estimates, till 2040
- 22.1.2. Rare Kidney Disease Market for Enzymes: Historical Trends and Forecasted Estimates, till 2040
- 22.1.3. Rare Kidney Disease Market for Proteins: Historical Trends and Forecasted Estimates, till 2040
- 22.1.4. Rare Kidney Disease Market for Hormones: Historical Trends and Forecasted Estimates, till 2040
23. RARE KIDNEY DISEASE MARKET, BY ROUTE OF ADMINISTRATION
- 23.1. Rare Kidney Disease Market: Distribution by Route of Administration
- 23.1.1. Rare Kidney Disease Market for Oral Route: Historical Trends and Forecasted Estimates, till 2040
- 23.1.2. Rare Kidney Disease Market for Intravenous Route: Historical Trends and Forecasted Estimates, till 2040
- 23.1.3. Rare Kidney Disease Market for Subcutaneous Route: Historical Trends and Forecasted Estimates, till 2040
24. RARE KIDNEY DISEASE MARKET, BY TYPE OF THERAPY
- 24.1. Rare Kidney Disease Market: Distribution by Type of Therapy
- 24.1.1. Rare Kidney Disease Market for Monotherapy: Historical Trends and Forecasted Estimates, till 2040
- 24.1.2. Rare Kidney Disease Market for Combination Therapy: Historical Trends and Forecasted Estimates, till 2040
25. RARE KIDNEY DISEASE MARKET, BY KEY GEOGRAPHICAL REGIONS
- 25.1. Rare Kidney Disease Market: Distribution by Key Geographical Regions
- 25.1.1. Rare Kidney Disease Market in North America: Historical Trends and Forecasted Estimates, till 2040
- 25.1.1.1. Rare Kidney Disease Market in the US: Historical Trends and Forecasted Estimates, till 2040
- 25.1.1.2. Rare Kidney Disease Market in Canada: Historical Trends and Forecasted Estimates, till 2040
- 25.1.2. Rare Kidney Disease Market in Europe: Historical Trends and Forecasted Estimates, till 2040
- 25.1.2.1. Rare Kidney Disease Market in Germany: Historical Trends and Forecasted Estimates, till 2040
- 25.1.2.2. Rare Kidney Disease Market in UK: Historical Trends and Forecasted Estimates, till 2040
- 25.1.2.3. Rare Kidney Disease Market in Spain: Historical Trends and Forecasted Estimates, till 2040
- 25.1.2.4. Rare Kidney Disease Market in France: Historical Trends and Forecasted Estimates, till 2040
- 25.1.2.5. Rare Kidney Disease Market in the Italy: Historical Trends and Forecasted Estimates, till 2040
- 25.1.3. Rare Kidney Disease Market in Asia-Pacific: Historical Trends and Forecasted Estimates, till 2040
- 25.1.3.1. Rare Kidney Disease Market in China: Historical Trends and Forecasted Estimates, till 2040
- 25.1.3.2. Rare Kidney Disease Market in India: Historical Trends and Forecasted Estimates, till 2040
- 25.1.3.3. Rare Kidney Disease Market in South Korea: Historical Trends and Forecasted Estimates, till 2040
- 25.1.3.4. Rare Kidney Disease Market in Japan: Historical Trends and Forecasted Estimates, till 2040
- 25.1.3.5. Rare Kidney Disease Market in Australia: Historical Trends and Forecasted Estimates, till 2040
- 25.1.3.6. Rare Kidney Disease Market in Taiwan: Historical Trends and Forecasted Estimates, till 2040
- 25.1.1. Rare Kidney Disease Market in North America: Historical Trends and Forecasted Estimates, till 2040
26. RARE KIDNEY DISEASE MARKET, SALES FORECAST OF DRUGS
- 26.1. Approved Rare Kidney Disease Drugs / Therapies: Sales Forecast
- 26.1.1. Benlysta(R): Sales Forecast
- 26.1.2. Elfabrio(R): Sales Forecast
- 26.1.3. FILSPARI(R): Sales Forecast
- 26.1.4. Galafold(R): Sales Forecast
- 26.1.5. LUPKYNIS(R): Sales Forecast
- 26.1.6. Sibnayal(R): Sales Forecast
- 26.1.7. Tarpeyo(R): Sales Forecast
- 26.1.8. TERLIVAZ(R): Sales Forecast
- 26.1.9. ULTOMIRIS(R): Sales Forecast
- 26.2. Phase III Rare Kidney Disease Drugs / Therapies: Sales Forecast
- 26.2.1. ALPN-303 (Immunoglobulin A Nephropathy): Sales Forecast
- 26.2.2. APL-2 (C3 Glomerulopathy): Sales Forecast
- 26.2.3. APL-2 (Membranous Nephropathy): Sales Forecast
- 26.2.4. Atacicept (Immunoglobulin A Nephropathy): Sales Forecast
- 26.2.5. Atacicept (Lupus Nephritis): Sales Forecast
- 26.2.6. Atrasentan (Immunoglobulin A Nephropathy): Sales Forecast
- 26.2.7. Crovalimab (Atypical Hemolytic Uremic Syndrome): Sales Forecast
- 26.2.8. FILSPARI(R) (Focal Segmental Glomerulosclerosis): Sales Forecast
- 26.2.9. Ianalumab (Lupus Nephritis): Sales Forecast
- 26.2.10. Iptacopan (Atypical Hemolytic Uremic Syndrome): Sales Forecast
- 26.2.11. Iptacopan (C3 Glomerulopathy): Sales Forecast
- 26.2.12. Iptacopan (Immunoglobulin A Nephropathy): Sales Forecast
- 26.2.13. Lucerastat (Fabry Disease): Sales Forecast
- 26.2.14. MIL62 (Membranous Nephropathy): Sales Forecast
- 26.2.15. Obinutuzumab (Nephrotic Syndrome): Sales Forecast
- 26.2.16. Obinutuzumab (Membranous Nephropathy): Sales Forecast
- 26.2.17. Obinutuzumab (Lupus Nephritis): Sales Forecast
- 26.2.18. Repagermanium (Focal Segmental Glomerulosclerosis): Sales Forecast
- 26.2.19. Saphnelo(TM) (Lupus Nephritis): Sales Forecast
- 26.2.20. Sibeprenlimab (Immunoglobulin A Nephropathy): Sales Forecast
- 26.2.21. SNP-ACTH (Membranous Nephropathy): Sales Forecast
- 26.2.22. Telitacicept (Immunoglobulin A Nephropathy): Sales Forecast
- 26.2.23. Tolvaptan (Autosomal Recessive Polycystic Kidney Disease): Sales Forecast
- 26.2.24. ULTOMIRIS(R) (Immunoglobulin A Nephropathy): Sales Forecast
- 26.2.25. Venglustat (Fabry Disease): Sales Forecast
- 26.2.26. Zigakibart (Immunoglobulin A Nephropathy): Sales Forecast
