
血漿分画の世界市場:企業タイプ別、事業規模別、製造される血漿由来治療製品タイプ別、血漿由来製品の治療領域別、主要地域別:2035年までの業界動向と世界の予測
Plasma Fractionation Market by Type of Company, Scale of Operation, Type of Plasma-derived Therapeutic Products Manufactured, Therapeutic Areas of Plasma-derived Products and Key Geographical Regions : Industry Trends and Global Forecasts, Till 2035- 発行日
- ページ情報
- 英文 190 Pages
- 納期
- 7~10営業日
- 商品コード
- 1682709
- カスタマイズ可能 お客様のご希望に応じて、既存データの加工や未掲載情報(例:国別セグメント)の追加などの対応が可能です。詳細はお問い合わせください。
- 翻訳ツール提供対象 PDF対応AI翻訳ツールの無料貸し出しサービスのご利用が可能です
- 医薬品関連専門 医薬品関連専門を専門とする市場調査会社です。
概要
世界の血漿分画の市場規模は、2035年までの予測期間中に9.2%のCAGRで拡大し、現在の48億米ドルから2035年までに127億米ドルに成長すると予測されています。
血漿分画市場は、主に腫瘍疾患、血液疾患、肺疾患、免疫疾患など、複数の疾患適応症の治療における血漿由来治療薬に対する需要の高まりによって牽引されています。血漿分画は、免疫グロブリン、アルブミン、抗凝固因子、プロテアーゼ阻害剤などの主要血漿成分を確実に分離・精製するための重要な工程です。精製された血漿成分は、治療薬の製剤化に使用することができます。血漿由来の治療薬の中で、免疫グロブリンの需要が最も高いと予想されていることは興味深いです。血漿供給量の制限や適切な規制枠組みの欠如といった課題によって、市場の成長が妨げられる可能性があります。
いくつかの課題にもかかわらず、対象疾患の適応範囲の拡大(特に希少疾患と慢性疾患)、診断率の向上、新興市場におけるヘルスケア水準の向上により、血漿由来療法の人気は急速に高まっています。血漿分画療法に対する需要の高まりと分画製造技術の進歩に牽引され、血漿分画市場は予測される将来において注目すべきペースで成長すると予想されます。
現在、血漿由来の治療法の開発に必要な血漿分画の専門知識を有すると主張する企業は35社以上あり、そのうち50%近くの企業は先進地域に施設を有しています。血漿分画業者の大部分は老舗であり、約75%の業者は製剤化サービスを提供する能力を有しています。近年、この領域では提携が着実に増加しており、その大半は欧州を拠点とする企業別M&Aでした。血漿由来の治療に対する需要の高まりを受けて、血漿分画製造業者は様々な地域で既存の能力を拡大するための投資を行っています。世界の血漿分画製造能力の90%以上は、商業用途のアルブミンと免疫グロブリンの製造に特化されています。
効果的な血漿由来の治療法の開発に注目が集まる中、血漿分画市場は今後10年間で年率10%程度の成長が見込まれています。
長期的には、免疫疾患に対する血漿由来療法が血漿分画市場の主要な成長促進要因として浮上する可能性が高く、アジア太平洋が最も急成長すると予想されます。
当レポートでは、世界の血漿分画市場について調査し、市場の概要とともに、企業タイプ別、事業規模別、製造される血漿由来治療製品タイプ別、血漿由来製品の治療領域別、主要地域別の動向、および市場に参入する企業のプロファイルなどを提供しています。
目次
第1章 序文
第2章 エグゼクティブサマリー
第3章 イントロダクション
第4章 血漿分画法:市場情勢
第5章 企業競争力分析
第6章 企業プロファイル
第7章 パートナーシップとコラボレーション
第8章 最近の拡張
第9章 容量分析
第10章 市場規模の評価と機会分析
第11章 結論
第12章 エグゼクティブ洞察
第13章 付録I:表形式データ
第14章 付録II:企業および団体一覧
図表
List of Tables
- Table 4.1 List of Plasma Fractionators
- Table 4.2 Plasma Fractionators: Information on Plasma Fractionation Facilities
- Table 4.3 Plasma Fractionators: Information on Plasma Collection Facilities
- Table 4.4 Plasma Fractionators: Information on Patented / Proprietary Technology / Process Used
- Table 4.5 Plasma Fractionators: Information on Additional Fractionation Capabilities
- Table 4.6 Plasma Fractionators: Information on Scale of Operation
- Table 4.7 Plasma Fractionators: Information on Type of Plasma-derived Therapeutic Products Manufactured
- Table 4.8 Plasma Fractionators: Information on Therapeutic Areas of Plasma-derived Products
- Table 4.9 Plasma Fractionators: Information on End Users
- Table 4.10 Plasma Fractionators: Information on Plasma Fractionation Capacity and Accreditation / Certification
- Table 4.11 Plasma Fractionators: Information on Upcoming Plasma Fractionation Facilities
- Table 4.12 Plasma Fractionators: Information on Companies Previously Involved in Plasma Fractionation
- Table 4.13 Plasma Fractionation: List of Additional Players
- Table 6.1 Plasma Fractionation: List of Companies Profiled
- Table 6.2 Baxter: Company Snapshot
- Table 6.3 Baxter: Plasma Fractionation Portfolio
- Table 6.4 Baxter: Recent Developments and Future Outlook
- Table 6.5 Grifols: Company Snapshot
- Table 6.6 Grifols: Plasma Fractionation Portfolio
- Table 6.7 Grifols: Recent Developments and Future Outlook
- Table 6.8 Kedrion: Company Snapshot
- Table 6.9 Kedrion: Plasma Fractionation Portfolio
- Table 6.10 Kedrion: Recent Developments and Future Outlook
- Table 6.11 Octapharma: Company Snapshot
- Table 6.12 Octapharma: Plasma Fractionation Portfolio
- Table 6.13 Octapharma: Recent Developments and Future Outlook
- Table 6.14 CSL: Company Snapshot
- Table 6.15 CSL: Plasma Fractionation Portfolio
- Table 6.16 CSL: Recent Developments and Future Outlook
- Table 6.17 Takeda Pharmaceutical: Company Snapshot
- Table 6.18 Takeda Pharmaceutical: Plasma Fractionation Portfolio
- Table 6.19 Takeda Pharmaceutical: Recent Developments and Future Outlook
- Table 7.1 Plasma Fractionation: Partnerships and Collaborations
- Table 7.2 Plasma Fractionation: Information on Location of Partner (Country and Region)
- Table 8.1 Plasma Fractionation: Recent Expansions
- Table 8.2 Recent Expansions: Information on Type of Plasma-derived Therapeutic Products Manufactured
- Table 9.1 Annual Plasma Fractionation Capacity: Average Capacity Per Facility by Company Size of Fractionators (Sample Data Set)
- Table 9.2 Annual Plasma Fractionation Capacity: Distribution by Company Size
- Table 13.1 Plasma Fractionators: Distribution by Year of Establishment
- Table 13.2 Plasma Fractionators: Distribution by Company Size
- Table 13.3 Plasma Fractionators: Distribution by Location of Headquarters (Region)
- Table 13.4 Plasma Fractionators: Distribution by Location of Headquarters (Country)
- Table 13.5 Plasma Fractionators: Distribution by Year of Establishment and Location of Headquarters (Region)
- Table 13.6 Plasma Fractionators: Distribution by Company Size and Location of Headquarters (Region)
- Table 13.7 Plasma Fractionators: Distribution by Type of Company
- Table 13.8 Plasma Fractionators: Distribution by Location of Plasma Fractionation Facilities (Region)
- Table 13.9 Plasma Fractionators: Distribution by Location of Plasma Collection Facility
- Table 13.10 Plasma Fractionators: Distribution by Availability of Patented / Proprietary Technology
- Table 13.11 Plasma Fractionators: Distribution by Additional Fractionation Capabilities
- Table 13.12 Plasma Fractionators: Distribution by Scale of Operation
- Table 13.13 Plasma Fractionators: Distribution by Type of Plasma-derived Therapeutic Products Manufactured
- Table 13.14 Plasma Fractionators: Distribution by Therapeutic Areas of Plasma-derived Products
- Table 13.15 Plasma Fractionators: Distribution by End Users
- Table 13.16 Baxter: Annual Revenues, FY 2018 Onwards (USD Billion)
- Table 13.17 Grifols: Annual Revenues, FY 2018 Onwards (EUR Million)
- Table 13.18 Kedrion: Annual Revenues, FY 2018 Onwards (EUR Million)
- Table 13.19 Octapharma: Annual Revenues, FY 2018 Onwards (EUR Billion)
- Table 13.20 CSL: Annual Revenues, FY 2018 Onwards (USD Million)
- Table 13.21 Takeda Pharmaceutical: Annual Revenues, FY 2018 Onwards (JPY Billion)
- Table 13.22 Partnerships and Collaborations: Cumulative Year-wise Distribution of Partnerships
- Table 13.23 Partnerships and Collaborations: Distribution by Type of Partnership
- Table 13.24 Partnerships and Collaborations: Distribution by Year and Type of Partnership
- Table 13.25 Partnerships and Collaborations: Distribution by Purpose of Agreement
- Table 13.26 Partnerships and Collaborations: Distribution by Type of Plasma-derived Therapeutic Products Manufactured
- Table 13.27 Partnerships and Collaborations: Distribution by Type of Partner
- Table 13.28 Partnerships and Collaborations: Distribution by Year of Partnership and Type of Partner
- Table 13.29 Partnerships and Collaborations: Distribution by Type of Partnership and Type of Partner
- Table 13.30 Most Active Players: Distribution by Number of Partnerships
- Table 13.31 Partnerships and Collaborations: Distribution by Local and International Agreements
- Table 13.32 Partnerships and Collaborations: Distribution by Intracontinental and Intercontinental Agreements
- Table 13.33 Recent Expansions: Cumulative Year-wise Distribution of Expansions
- Table 13.34 Recent Expansions: Distribution by Type of Expansion
- Table 13.35 Recent Expansions: Distribution by Year and Type of Expansion
- Table 13.36 Recent Expansions: Distribution by Type of Facility
- Table 13.37 Recent Expansions: Distribution by Location of Expanded Facility
- Table 13.38 Recent Expansions: Distribution by Year and Location of Expanded Facility
- Table 13.39 Recent Expansions: Distribution by Plasma-derived Therapeutic Products Manufactured
- Table 13.40 Most Active Players: Distribution by Number of Expansions
- Table 13.41 Annual Plasma Fractionation Capacity: Distribution by Range of Installed Capacity
- Table 13.42 Annual Plasma Fractionation Capacity: Distribution by Company Size
- Table 13.43 Annual Plasma Fractionation Capacity: Distribution by Type of Plasma-derived Therapeutic Products Manufactured
- Table 13.44 Annual Plasma Fractionation Capacity: Distribution by Scale of Operation
- Table 13.45 Plasma Fractionation Capacity: Distribution by Location of Plasma Fractionation Facilities
- Table 13.46 Plasma Fractionation Capacity: Distribution by Location of Headquarters (in Million Liters)
- Table 13.47 Global Plasma Fractionation Market (Historical, Base and Forecasted Scenario), till 2035 (USD Billion)
- Table 13.48 Plasma Fractionation Market: Distribution by Type of Company, 2017, 2023 and 2035 (USD Billion)
- Table 13.49 Plasma Fractionation Market for In-house Manufacturers, till 2035 (USD Billion)
- Table 13.50 Plasma Fractionation Market for Contract Service Providers, till 2035 (USD Billion)
- Table 13.51 Plasma Fractionation Market: Distribution by Scale of Operation, 2017, 2023 and 2035 (USD Billion)
- Table 13.52 Plasma Fractionation Market for Preclinical Operations, till 2035 (USD Billion)
- Table 13.53 Plasma Fractionation Market for Clinical Operations, till 2035 (USD Billion)
- Table 13.54 Plasma Fractionation Market for Commercial Operations, till 2035 (USD Billion)
- Table 13.55 Plasma Fractionation Market: Distribution by Type of Plasma-derived Therapeutic Products Manufactured, 2017, 2023 and 2035 (USD Billion)
- Table 13.56 Plasma Fractionation Market for Albumins, till 2035 (USD Billion)
- Table 13.57 Plasma Fractionation Market for Coagulation Factors, till 2035 (USD Billion)
- Table 13.58 Plasma Fractionation Market for Immunoglobulins, till 2035 (USD Billion)
- Table 13.59 Plasma Fractionation Market for Protease Inhibitors, till 2035 (USD Billion)
- Table 13.60 Plasma Fractionation Market for Other Plasma-derived Products, till 2035 (USD Billion)
- Table 13.61 Plasma Fractionation Market: Distribution by Therapeutic Areas of Plasma-derived Products, 2017, 2023 and 2035 (USD Billion)
- Table 13.62 Plasma Fractionation Market for Hematological Disorders, till 2035 (USD Billion)
- Table 13.63 Plasma Fractionation Market for Hepatic Disorders, till 2035 (USD Billion)
- Table 13.64 Plasma Fractionation Market for Immunological Disorders, till 2035 (USD Billion)
- Table 13.65 Plasma Fractionation Market for Neurological Disorders, till 2035 (USD Billion)
- Table 13.66 Plasma Fractionation Market for Other Disorders, till 2035 (USD Billion)
- Table 13.67 Plasma Fractionation Market: Distribution by Demand across Key Geographical Regions, 2017, 2023 and 2035 (USD Billion)
- Table 13.68 Plasma Fractionation Market for North America, till 2035 (USD Billion)
- Table 13.69 Plasma Fractionation Market for Europe, till 2035 (USD Billion)
- Table 13.70 Plasma Fractionation Market for Asia-Pacific, till 2035 (USD Billion)
- Table 13.71 Plasma Fractionation Market for Rest of the World, till 2035 (USD Billion)
- Table 13.72 Plasma Fractionation Market: Distribution by Supply across Key Geographical Regions, 2017, 2023 and 2035 (USD Billion)
- Table 13.73 Plasma Fractionation Market for North America, till 2035 (USD Billion)
- Table 13.74 Plasma Fractionation Market for Europe, till 2035 (USD Billion)
- Table 13.75 Plasma Fractionation Market for Asia-Pacific, till 2035 (USD Billion)
- Table 13.76 Plasma Fractionation Market for Rest of the World, till 2035 (USD Billion)
List of Figures
- Figure 2.1 Executive Summary: Current Market Landscape
- Figure 2.2 Executive Summary: Partnerships and Collaborations
- Figure 2.3 Executive Summary: Recent Expansions
- Figure 2.4 Executive Summary: Capacity Analysis
- Figure 2.5 Executive Summary: Market Sizing and Opportunity Analysis
- Figure 3.1 Components of Blood
- Figure 3.2 Components of Blood Plasma
- Figure 3.3 Process of Plasmapheresis
- Figure 3.4 Good Manufacturing Practices for Blood Screening
- Figure 3.5 Steps Involved in Plasma Fractionation
- Figure 3.6 Target Therapeutic Areas of Plasma-derived Therapies
- Figure 3.7 Advantages of Third-party Service Providers
- Figure 4.1 Plasma Fractionators: Distribution by Year of Establishment
- Figure 4.2 Plasma Fractionators: Distribution by Company Size
- Figure 4.3 Plasma Fractionators: Distribution by Location of Headquarters (Region)
- Figure 4.4 Plasma Fractionators: Distribution by Location of Headquarters (Country)
- Figure 4.5 Plasma Fractionators: Distribution by Year of Establishment and Location of Headquarters (Region)
- Figure 4.6 Plasma Fractionators: Distribution by Company Size and Location of Headquarters (Region)
- Figure 4.7 Plasma Fractionators: Distribution by Type of Company
- Figure 4.8 Plasma Fractionators: Distribution by Location of Plasma Fractionation Facilities (Region)
- Figure 4.9 Plasma Fractionators: Distribution by Location of Plasma Collection Facility
- Figure 4.10 Plasma Fractionators: Distribution by Availability of Patented / Proprietary Technology
- Figure 4.11 Plasma Fractionators: Distribution by Additional Fractionation Capabilities
- Figure 4.12 Plasma Fractionators: Distribution by Scale of Operation
- Figure 4.13 Plasma Fractionators: Distribution by Type of Plasma-derived Therapeutic Products Manufactured
- Figure 4.14 Plasma Fractionators: Distribution by Therapeutic Areas of Plasma-derived Products
- Figure 4.15 Plasma Fractionators: Distribution by End Users
- Figure 5.1 In-house Manufacturers: Players based in North America and Europe
- Figure 5.2 In-house Manufacturers: Players based in Asia-Pacific and Rest of the World
- Figure 5.3 In-house Manufacturers and Contract Service Providers: Players based in North America and Europe
- Figure 5.4 In-house Manufacturers and Contract Service Providers: Players based in Asia-Pacific and Rest of the World
- Figure 6.1 Baxter: Annual Revenues, FY 2018 Onwards (USD Billion)
- Figure 6.2 Grifols: Annual Revenues, FY 2018 Onwards (EUR Million)
- Figure 6.3 Kedrion: Annual Revenues, FY 2018 Onwards (EUR Million)
- Figure 6.4 Octapharma: Annual Revenues, FY 2018 Onwards (EUR Billion)
- Figure 6.5 CSL: Annual Revenues, FY 2018 Onwards (USD Million)
- Figure 6.5 Takeda Pharmaceutical: Annual Revenues, FY 2018 Onwards (JPY Billion)
- Figure 7.1 Partnerships and Collaborations: Cumulative Year-wise Distribution of Partnerships
- Figure 7.2 Partnerships and Collaborations: Distribution by Type of Partnership
- Figure 7.3 Partnerships and Collaborations: Distribution by Year and Type of Partnership
- Figure 7.4 Partnerships and Collaborations: Distribution by Purpose of Agreement
- Figure 7.5 Partnerships and Collaborations: Distribution by Type of Plasma-derived Therapeutic Products Manufactured
- Figure 7.6 Partnerships and Collaborations: Distribution by Type of Partner
- Figure 7.5 Partnerships and Collaborations: Distribution by Year of Partnership and Type of Partner
- Figure 7.6 Partnerships and Collaborations: Distribution by Type of Partnership and Type of Partner
- Figure 7.7 Most Active Players: Distribution by Number of Partnerships
- Figure 7.8 Partnerships and Collaborations: Distribution by Local and International Agreements
- Figure 7.9 Partnerships and Collaborations: Distribution by Intracontinental and Intercontinental Agreements
- Figure 8.1 Recent Expansions: Cumulative Year-wise Distribution of Expansions
- Figure 8.2 Recent Expansions: Distribution by Type of Expansion
- Figure 8.3 Recent Expansions: Distribution by Year and Type of Expansion
- Figure 8.4 Recent Expansions: Distribution by Type of Facility
- Figure 8.5 Recent Expansions: Distribution by Location of Expanded Facility
- Figure 8.6 Recent Expansions: Distribution by Year and Location of Expanded Facility
- Figure 8.7 Recent Expansions: Distribution by Plasma-derived Therapeutic Products Manufactured
- Figure 8.8 Most Active Players: Distribution by Number of Expansions
- Figure 9.1 Annual Plasma Fractionation Capacity: Distribution by Range of Installed Capacity
- Figure 9.2 Annual Plasma Fractionation Capacity: Distribution by Company Size
- Figure 9.3 Annual Plasma Fractionation Capacity: Distribution by Type of Plasma-derived Therapeutic Products Manufactured
- Figure 9.4 Annual Plasma Fractionation Capacity: Distribution by Scale of Operation
- Figure 9.5 Plasma Fractionation Capacity: Distribution by Location of Plasma Fractionation Facilities
- Figure 9.6 Plasma Fractionation Capacity: Distribution by Location of Headquarters (in Million Liters)
- Figure 10.1 Global Plasma Fractionation Market (Historical Trends and Forecasted Estimates), 2017-2035 (USD Billion)
- Figure 10.2 Plasma Fractionation Market: Distribution by Type of Company, 2017, 2023 and 2035 (USD Billion)
- Figure 10.3 Plasma Fractionation Market for In-house Manufacturers, till 2035 (USD Billion)
- Figure 10.4 Plasma Fractionation Market for Contract Service Providers, till 2035 (USD Billion)
- Figure 10.5. Plasma Fractionation Market: Distribution by Scale of Operation, 2017, 2023 and 2035 (USD Billion)
- Figure 10.6 Plasma Fractionation Market for Preclinical Operations, till 2035 (USD Billion)
- Figure 10.7 Plasma Fractionation Market for Clinical Operations, till 2035 (USD Billion)
- Figure 10.8 Plasma Fractionation Market for Commercial Operations, till 2035 (USD Billion)
- Figure 10.9 Plasma Fractionation Market: Distribution by Type of Plasma-derived Therapeutic Products Manufactured, 2017, 2023 and 2035 (USD Billion)
- Figure 10.10 Plasma Fractionation Market for Albumins, till 2035 (USD Billion)
- Figure 10.11 Plasma Fractionation Market for Coagulation Factors, till 2035 (USD Billion)
- Figure 10.12 Plasma Fractionation Market for Immunoglobulins, till 2035 (USD Billion)
- Figure 10.13 Plasma Fractionation Market for Protease Inhibitors, till 2035 (USD Billion)
- Figure 10.14 Plasma Fractionation Market for Other Plasma-derived Products, till 2035 (USD Billion)
- Figure 10.15 Plasma Fractionation Market: Distribution by Therapeutic Areas of Plasma-derived Products, 2017, 2023 and 2035 (USD Billion)
- Figure 10.16 Plasma Fractionation Market for Hematological Disorders, till 2035 (USD Billion)
- Figure 10.17 Plasma Fractionation Market for Hepatic Disorders, till 2035 (USD Billion)
- Figure 10.18 Plasma Fractionation Market for Immunological Disorders, till 2035 (USD Billion)
- Figure 10.19 Plasma Fractionation Market for Neurological Disorders, till 2035 (USD Billion)
- Figure 10.20 Plasma Fractionation Market for Other Disorders, till 2035 (USD Billion)
- Figure 10.21 Plasma Fractionation Market: Distribution by Demand across Key Geographical Regions, 2017, 2023 and 2035 (USD Billion)
- Figure 10.22 Plasma Fractionation Market for North America, till 2035 (USD Billion)
- Figure 10.23 Plasma Fractionation Market for Europe, till 2035 (USD Billion)
- Figure 10.24 Plasma Fractionation Market for Asia-Pacific, till 2035 (USD Billion)
- Figure 10.25 Plasma Fractionation Market for Rest of the World, till 2035 (USD Billion)
- Figure 10.26 Plasma Fractionation Market: Distribution by Supply across Key Geographical Regions, 2017, 2023 and 2035 (USD Billion)
- Figure 10.27 Plasma Fractionation Market for North America, till 2035 (USD Billion)
- Figure 10.28 Plasma Fractionation Market for Europe, till 2035 (USD Billion)
- Figure 10.29 Plasma Fractionation Market for Asia-Pacific, till 2035 (USD Billion)
- Figure 10.30 Plasma Fractionation Market for Rest of the World, till 2035 (USD Billion)
- Figure 11.1 Concluding Remarks: Current Market Landscape of Plasma Fractionators
- Figure 11.2 Concluding Remarks: Partnerships and Collaborations
- Figure 11.3 Concluding Remarks: Recent Expansions
- Figure 11.4 Concluding Remarks: Capacity Analysis
- Figure 11.5 Concluding Remarks: Market Sizing and Opportunity Analysis (I/II)
- Figure 11.6 Concluding Remarks: Market Sizing and Opportunity Analysis (II/II)
目次
PLASMA FRACTIONATION MARKET: OVERVIEW
As per Roots Analysis, the global plasma fractionation market is estimated to grow from USD 4.8 billion in the current year to USD 12.7 billion by 2035, at a CAGR of 9.2% during the forecast period, till 2035.
The market sizing and opportunity analysis has been segmented across the following parameters:
Type of Company
- In-house Manufacturers
- Contract Service Providers
Scale of Operation
- Preclinical
- Clinical
- Commercial
Type of Plasma-derived Therapeutic Products Manufactured
- Albumins
- Coagulation Factors
- Immunoglobulins
- Protease Inhibitors
- Other Plasma-derived Products
Therapeutic Areas of Plasma-derived Products
- Hematological Disorders
- Hepatic Disorders
- Immunological Disorders
- Neurological Disorders
- Other Disorders
Key Geographical Regions
- North America
- Europe
- Asia-Pacific
- Rest of the World
PLASMA FRACTIONATION MARKET: GROWTH AND TRENDS
The plasma fractionation market is primarily driven by the growing demand for plasma-derived therapies for treating several disease indications, such as oncological disorders, hematological disorders, pulmonary disorders and immunological disorders. Plasma fractionation is a critical step to ensure the separation and purification of key blood plasma components, such as immunoglobulins, albumins, anticoagulant factors and protease inhibitors. The refined blood plasma components can then be used for the formulation of therapeutics. It is interesting to note that among all the plasma-derived therapies, demand for immunoglobulins is anticipated to be the highest. The anticipated growth of the market can be hindered by challenges, such as limited blood plasma supply and a lack of proper regulatory framework.
Despite several challenges, owing to a broader spectrum of target disease indications (specifically rare and chronic diseases), improved diagnosis rates, and higher standards of healthcare in emerging markets, the popularity of plasma-derived therapies is rapidly increasing. Driven by the growing demand for blood plasma therapies and the ongoing advancements in fractionation manufacturing technologies, the plasma fractionation market is expected to grow at a noteworthy pace in the foreseen future.
PLASMA FRACTIONATION MARKET: KEY INSIGHTS
The report delves into the current state of the plasma fractionation market and identifies potential growth opportunities within the industry. Some key findings from the report include:
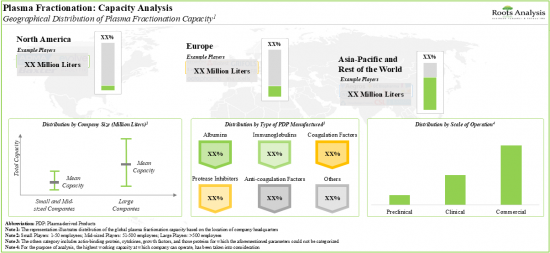
1. Currently, more than 35 companies claim to have the expertise for blood plasma fractionation, required for the development of plasma-derived therapies; of which, nearly 50% of the players have facilities in developed regions.
2. Majority of the plasma fractionators are well-established players; ~75% of the players have the capabilities for offering formulation services.
3. In recent years, the domain witnessed a steady growth in partnership activity; the majority of the initiatives were mergers and acquisitions carried out by players based in Europe.
4. Owing to the growing demand for plasma-derived therapies, plasma fractionators are investing in expanding their existing capabilities across various regions; of these, ~30% of the initiatives were undertaken in North America.
5. Over 90% of the global installed plasma fractionation capacity is dedicated to the manufacturing of albumins and immunoglobulins for commercial applications.
6. With the growing focus on the development of efficacious plasma-derived therapies, the plasma fractionation market is anticipated to witness an annualized growth of ~10%, over the next decade.
7. In the long term, the plasma-derived therapies for immunological disorders are likely to emerge as the key growth drivers of the plasma fractionation market; Asia-Pacific is anticipated to be the fastest growing region.
PLASMA FRACTIONATION MARKET: KEY SEGMENTS
In-House manufacturers Occupy the Largest Share of the Plasma Fractionation Market
Based on the type of company, the market is segmented into in-house manufacturers and contract service providers. At present, in-house manufacturers capture the highest share of the plasma fractionation market. It is worth highlighting that the plasma fractionation market for contract service providers is likely to grow at a relatively higher CAGR.
By Scale of Operation, Commercial Scale is Likely to Dominate the Plasma Fractionation Market During the Forecast Period
Based on the scale of operation, the market is segmented into preclinical, clinical and commercial scale. Currently, the commercial scale holds the highest share of the plasma fractionation market. This trend is unlikely to change in the near future.
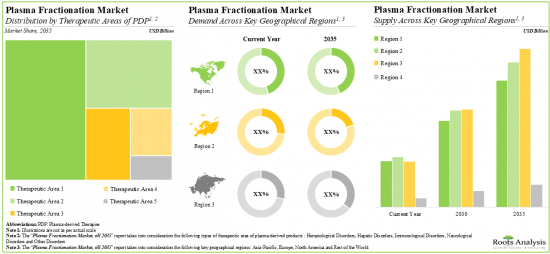
Immunoglobulins Segment Occupies the Largest Share of the Plasma Fractionation Market
Based on the type of plasma-derived therapeutic products manufactured, the market is segmented into albumin, coagulation factors, immunoglobulins, protease inhibitors and other plasma-derived products. At present, immunoglobulins hold the maximum share of the plasma fractionation market. This trend is likely to remain the same in the forthcoming years.
Oncological Disorders Account for the Largest Share of the Plasma Fractionation Market
Based on the therapeutic areas of plasma-derived products, the market is segmented into hematological disorders, hepatic disorders, immunological disorders, neurological disorders and other disorders. While immunological disorders account for a relatively higher market share, it is worth highlighting that neurological disorders are expected to witness substantial growth in the coming years.
Europe Accounts for the Largest Share of the Market
Based on key geographical regions, the market is segmented into North America, Europe, Asia-Pacific and Rest of the world. The majority share is expected to be captured by players based in Europe. It is worth highlighting that, over the years, the market in Asia-Pacific is expected to grow at a higher CAGR.
Example Players in the Plasma Fractionation Market
- Baxter
- Grifols
- Kedrion
- Octapharma
- CSL
- Takeda Pharmaceutical
PLASMA FRACTIONATION MARKET: RESEARCH COVERAGE
- Market Sizing and Opportunity Analysis: The report features an in-depth analysis of the plasma fractionation market, focusing on key market segments, including [A] type of company, [B] scale of operation, [C] type of plasma-derived therapeutic products manufactured, [D] therapeutic areas of plasma-derived products and [E] key geographical regions.
- Market Landscape: A comprehensive evaluation of plasma fractionation companies, considering various parameters, such as [A] year of establishment, [B] company size (in terms of number of employees), [C] location of headquarters, [D] type of company, [E] location of plasma fractionation facilities, [F] location of plasma collection facility, [F] availability of patented / proprietary technology, [G] additional fractionation capabilities, [H] scale of operation, [I] type of plasma-derived therapeutic products manufactured, [J] therapeutic areas of plasma-derived products and [K] end users.
- Company Competitiveness Analysis: A comprehensive competitive analysis of plasma fractionation companies based in North America, Europe, Asia-Pacific and rest of the world, examining factors, such as [A] company strength and [B] portfolio strength.
- Company Profiles: In-depth profiles of key plasma fractionation service providers, focusing on [A] company overviews, [B] financial information (if available), [C] plasma fractionation portfolio, [D] recent developments and [E] an informed future outlook.
- Partnerships and Collaborations: An analysis of partnerships established in this sector, since 2018, based on several parameters, such as [A] year of partnership, [B] type of partnership, [C] purpose of agreement, [D] type of plasma-derived therapeutic products manufactured, [E] type of partner, [F] most active players and [G] regional distribution of the companies involved in these agreements.
- Recent Expansions: An examination of the different expansion efforts made by plasma fractionation companies in this field to enhance their capabilities, since 2018. This analysis considers various factors, including the [A] year of expansion, [B] type of expansion, [C] type of facility, [D] location of expanded facility, [E] type of plasma-derived therapeutic products manufactured and [F] most active players.
- Capacity Analysis: Estimation of global fractionation capacity, derived from data provided by various stakeholders in the public domain. This analysis emphasizes the distribution of the available capacity on the basis of [A] company size (small, mid-sized and large), [B] type of plasma-derived therapeutic products manufactured (albumins, anti-coagulation factors, coagulation factors, immunoglobulins, protease inhibitors and other plasma-derived products), [C] scale of operation (preclinical, clinical and commercial) and [D] key geographical region (North America, Europe, Asia-Pacific and rest of the world).
KEY QUESTIONS ANSWERED IN THIS REPORT
- How many companies are currently engaged in this market?
- Which are the leading companies in this market?
- What is the annual plasma fractionation capacity?
- What kind of partnership models are commonly adopted by industry stakeholders?
- What factors are likely to influence the evolution of this market?
- What is the current and future market size?
- What is the CAGR of this market?
- How is the current and future market opportunity likely to be distributed across key market segments?
REASONS TO BUY THIS REPORT
- The report provides a comprehensive market analysis, offering detailed revenue projections of the overall market and its specific sub-segments. This information is valuable to both established market leaders and emerging entrants.
- Stakeholders can leverage the report to gain a deeper understanding of the competitive dynamics within the market. By analyzing the competitive landscape, businesses can make informed decisions to optimize their market positioning and develop effective go-to-market strategies.
- The report offers stakeholders a comprehensive overview of the market, including key drivers, barriers, opportunities, and challenges. This information empowers stakeholders to stay abreast of market trends and make data-driven decisions to capitalize on growth prospects.
ADDITIONAL BENEFITS
- Complimentary PPT Insights Packs
- Complimentary Excel Data Packs for all Analytical Modules in the Report
- 10% Free Content Customization
- Detailed Report Walkthrough Session with Research Team
- Free Updated report if the report is 6-12 months old or older
TABLE OF CONTENTS
1. PREFACE
- 1.1. Plasma Fractionation Market Overview
- 1.2. Key Market Insights
- 1.3. Scope of the Report
- 1.4. Research Methodology
- 1.5. Frequently Asked Questions
- 1.6. Chapter Outlines
2. EXECUTIVE SUMMARY
3. INTRODUCTION
- 3.1. Chapter Overview
- 3.2. Introduction to Blood Plasma
- 3.2.1. Plasma Collection
- 3.2.2. Plasma Screening
- 3.2.3. Plasma Fractionation
- 3.3. Applications of Plasma Fractionation
- 3.4. Challenges Associated with Plasma Fractionation
- 3.5. Need for Third-party Service Providers
- 3.5.1. Overview of Third-party Service Providers
- 3.6. Future Perspectives
4. PLASMA FRACTIONATION: MARKET LANDSCAPE
- 4.1. Chapter Overview
- 4.2. Plasma Fractionation: Overall Market Landscape
- 4.2.1. Analysis by Year of Establishment
- 4.2.2. Analysis by Company Size
- 4.2.3. Analysis by Location of Headquarters (Region)
- 4.2.4. Analysis by Location of Headquarters (Country)
- 4.2.5. Analysis by Year of Establishment and Location of Headquarters (Region)
- 4.2.6. Analysis by Company Size and Location of Headquarters (Region)
- 4.2.7. Analysis by Type of Company
- 4.2.8. Analysis by Location of Plasma Fractionation Facilities (Region)
- 4.2.9. Analysis by Location of Plasma Collection Facility
- 4.2.10. Analysis by Availability of Patented / Proprietary Technology
- 4.2.11. Analysis by Additional Fractionation Capabilities
- 4.2.12. Analysis by Scale of Operation
- 4.2.13. Analysis by Type of Plasma-derived Therapeutic Products Manufactured
- 4.2.14. Analysis by Therapeutic Areas of Plasma-derived Products
- 4.2.15. Analysis by End Users
- 4.2.16. Information on Plasma Fractionation Capacity and Accreditation / Certification
- 4.2.17. Information on Upcoming Plasma Fractionation Facilities
- 4.2.18. Information on Companies Previously Involved in Plasma Fractionation
5. COMPANY COMPETITIVENESS ANALYSIS
- 5.1. Chapter Overview
- 5.2. Assumptions and Key Parameters
- 5.3. Methodology
- 5.4. Company Competitiveness Analysis: In-house Manufacturers
- 5.4.1. Players based in North America and Europe
- 5.4.2. Players based in Asia-Pacific and Rest of the World
- 5.5. Company Competitiveness Analysis: In-house Manufacturers and Contract Service Providers
- 5.5.1. Players based in North America and Europe
- 5.5.2. Players based in Asia-Pacific and Rest of the World
6. COMPANY PROFILES
- 6.1. Chapter Overview
- 6.2. Companies Headquartered in North America
- 6.2.1. Baxter
- 6.2.1.1. Company Overview
- 6.2.1.2. Financial Information
- 6.2.1.3. Plasma Fractionation Portfolio
- 6.2.1.4. Recent Developments and Future Outlook
- 6.2.1. Baxter
- 6.3. Companies Headquartered in Europe
- 6.3.1. Grifols
- 6.3.1.1. Company Overview
- 6.3.1.2. Financial Information
- 6.3.1.3. Plasma Fractionation Portfolio
- 6.3.1.4. Recent Developments and Future Outlook
- 6.3.2. Kedrion
- 6.3.2.1. Company Overview
- 6.3.2.2. Financial Information
- 6.3.2.3. Plasma Fractionation Portfolio
- 6.3.2.4. Recent Developments and Future Outlook
- 6.3.3. Octapharma
- 6.3.3.1. Company Overview
- 6.3.3.2. Financial Information
- 6.3.3.3. Plasma Fractionation Portfolio
- 6.3.3.4. Recent Developments and Future Outlook
- 6.3.1. Grifols
- 6.4. Companies Headquartered in Asia-Pacific
- 6.4.1. CSL
- 6.4.1.2. Company Overview
- 6.4.1.3. Financial Information
- 6.4.1.4. Plasma Fractionation Portfolio
- 6.4.1.5. Recent Developments and Future Outlook
- 6.4.2. Takeda Pharmaceutical
- 6.4.2.1. Company Overview
- 6.4.2.2. Financial Information
- 6.4.2.3. Plasma Fractionation Portfolio
- 6.4.2.4. Recent Developments and Future Outlook
- 6.4.1. CSL
7. PARTNERSHIPS AND COLLABORATIONS
- 7.1. Chapter Overview
- 7.2. Partnership Models
- 7.3. Plasma Fractionation: Partnerships and Collaborations
- 7.3.1. Analysis by Year of Partnership
- 7.3.2. Analysis by Type of Partnership
- 7.3.3. Analysis by Year and Type of Partnership
- 7.3.4. Analysis by Purpose of Agreement
- 7.3.5. Analysis by Type of Plasma-derived Therapeutic Products Manufactured
- 7.3.6. Analysis by Type of Partner
- 7.3.7. Analysis by Year of Partnership and Type of Partner
- 7.3.8. Analysis by Type of Partnership and Type of Partner
- 7.3.9. Most Active Players: Analysis by Number of Partnerships
- 7.4. Analysis by Geography
- 7.4.1. Local and International Agreements
- 7.4.2. Intracontinental and Intercontinental Agreements
8. RECENT EXPANSIONS
- 8.1. Chapter Overview
- 8.2. Expansion Models
- 8.3. Plasma Fractionation: Recent Expansions
- 8.3.1. Analysis by Year of Expansion
- 8.3.2. Analysis by Type of Expansion
- 8.3.3. Analysis by Year and Type of Expansion
- 8.3.4. Analysis by Type of Facility
- 8.3.5. Analysis by Location of Expanded Facility
- 8.3.6. Analysis by Year and Location of Expanded Facility
- 8.3.7. Analysis by Plasma-derived Therapeutic Products Manufactured
- 8.3.8. Most Active Players: Analysis by Number of Expansions
9. CAPACITY ANALYSIS
- 9.1. Chapter Overview
- 9.2. Key Assumptions and Methodology
- 9.2.1. Annual Plasma Fractionation Capacity
- 9.2.1.1. Analysis by Company Size
- 9.2.1.2. Analysis by Type of Plasma-derived Therapeutic Products Manufactured
- 9.2.1.3. Analysis by Scale of Operation
- 9.2.2. Analysis by Location of Plasma Fractionation Facility
- 9.2.3. Analysis by Location of Headquarters
- 9.2.1. Annual Plasma Fractionation Capacity
- 9.3. Concluding Remarks
10. MARKET SIZING AND OPPURTUNITY ANALYSIS
- 10.1. Chapter Overview
- 10.2. Key Assumptions and Forecast Methodology
- 10.3. Global Plasma Fractionation Market (Historical, Base and Forecasted Scenario), 2017-2035
- 10.3.1. Plasma Fractionation Market: Distribution by Type of Company, 2017, 2023 and 2035
- 10.3.1.1. Plasma Fractionation Market for In-house Manufacturers, till 2035
- 10.3.1.2. Plasma Fractionation Market for Contract Service Providers, till 2035
- 10.3.2. Plasma Fractionation Market: Distribution by Scale of Operation, 2017, 2023 and 2035
- 10.3.2.1. Plasma Fractionation Market for Preclinical, till 2035
- 10.3.2.2. Plasma Fractionation Market for Clinical, till 2035
- 10.3.2.3. Plasma Fractionation Market for Commercial, till 2035
- 10.3.3. Plasma Fractionation Market: Distribution by Type of Plasma-derived Therapeutic Products Manufactured, 2017, 2023 and 2035
- 10.3.3.1. Plasma Fractionation Market for Albumins, till 2035
- 10.3.3.2. Plasma Fractionation Market for Coagulation Factors, till 2035
- 10.3.3.3. Plasma Fractionation Market for Immunoglobulins, till 2035
- 10.3.3.4. Plasma Fractionation Market for Protease Inhibitors, till 2035
- 10.3.3.5. Plasma Fractionation Market for Other Plasma-derived Products, till 2035
- 10.3.4. Plasma Fractionation Market: Distribution by Therapeutic Areas of Plasma-derived Products, 2017, 2023 and 2035
- 10.3.4.1. Plasma Fractionation Market for Hematological Disorders, till 2035
- 10.3.4.2. Plasma Fractionation Market for Hepatic Disorders, till 2035
- 10.3.4.3. Plasma Fractionation Market for Immunological Disorders, till 2035
- 10.3.4.4. Plasma Fractionation Market for Neurological Disorders, till 2035
- 10.3.4.5. Plasma Fractionation Market for Other Disorders, till 2035
- 10.3.5. Plasma Fractionation Market: Distribution by Demand across Key Geographical Regions, 2017, 2023 and 2035
- 10.3.5.1. Plasma Fractionation Market in North America, till 2035
- 10.3.5.2. Plasma Fractionation Market in Europe, till 2035
- 10.3.5.3. Plasma Fractionation Market in Asia-Pacific, till 2035
- 10.3.5.4. Plasma Fractionation Market in Rest of the World, till 2035
- 10.3.6. Plasma Fractionation Market: Distribution by Supply across Key Geographical Regions, 2017, 2023 and 2035
- 10.3.6.1. Plasma Fractionation Market in North America, till 2035
- 10.3.6.2. Plasma Fractionation Market in Europe, till 2035
- 10.3.6.3. Plasma Fractionation Market in Asia-Pacific, till 2035
- 10.3.6.4. Plasma Fractionation Market in Rest of the World, till 2035
- 10.3.1. Plasma Fractionation Market: Distribution by Type of Company, 2017, 2023 and 2035
11. CONCLUDING REMARKS
12. EXECUTIVE INSIGHTS
13. APPENDIX I: TABULATED DATA
14. APPENDIX II: LIST OF COMPANIES AND ORGANIZATIONS
- 発行日
- 発行
- Roots Analysis
- ページ情報
- 英文 190 Pages
- 納期
- 7~10営業日