
|
市場調査レポート
商品コード
1830067
二重特異性抗体市場:2035年までの業界動向と世界の予測 - 治療領域別、作用機序別、標的抗原抗体形態別、主要地域別、主要企業別Bispecific Antibodies Market: Industry Trends and Global Forecasts, Till 2035 - Distribution by Therapeutic Area, Mechanism of Action, Target Antigen Antibody Format, Key Geographical Regions and Key Players |
||||||
カスタマイズ可能
|
|||||||
| 二重特異性抗体市場:2035年までの業界動向と世界の予測 - 治療領域別、作用機序別、標的抗原抗体形態別、主要地域別、主要企業別 |
|
出版日: 2025年10月03日
発行: Roots Analysis
ページ情報: 英文 391 Pages
納期: 即日から翌営業日
|

概要
二重特異性抗体市場概要
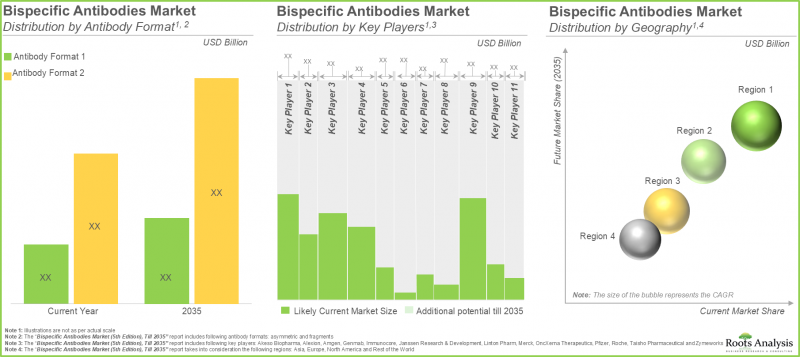
世界の二重特異性抗体の市場規模は、2035年までの予測期間中に6.5%のCAGRで拡大し、現在の89億3,000万米ドルから2035年までに168億1,000万米ドルに成長すると予測されています。
市場セグメンテーションでは、市場規模および機会分析を以下のパラメータで区分しています。
治療領域
- 自己免疫疾患
- 遺伝性疾患
- 血液悪性腫瘍
- 眼科疾患
- 皮膚がん
- 固形腫瘍
作用機序
- サイトカイン再標的化/中和
- デュアルリガンドブロッキング
- 耐性因子共同標的
- 腫瘍血管新生
- T細胞の再標的化/活性化
- その他
標的抗原
- C5-アルブミン
- CD20 x CD3
- CD3 x BCMA
- CD3 x CD19
- EGFR x cMET
- EpCAM x CD3
- 第IXa因子x第X因子
- gp100 x CD3
- HER2 x HER2
- PD-1 x CTLA-4
- PD-L1 x TGFB
- TNF-a x HSA
- VEGF x DLL4
- VEGF-A x ANG2
抗体形態
- 非対称
- フラグメント
地域
- 北米(米国、カナダ、その他)
- 欧州(ドイツ、フランス、イタリア、スペイン、英国、その他)
- アジア(インド、中国、日本、韓国、その他)
- その他の地域
二重特異性抗体市場成長と動向
モノクローナル抗体の治療能力を評価し、多くの疾患の治療に効果的に応用することで、製薬セクターは変貌を遂げています。現在、治療効果を高めるための人工抗体治療薬の開発に向けて、広範な研究が進められています。数十年前、モノクローナル抗体に抗原結合部位を追加することにより、二価抗体が開発されました。これらの二価分子の主な目的は、細胞傷害性免疫エフェクター細胞を誘導し、抗体依存性細胞媒介性細胞傷害(ADCC)および免疫エフェクター細胞によって駆動される他の様々な細胞傷害プロセスを通じて、腫瘍細胞の破壊を強化することでした。この抗体ベースの治療法の改良版は、現在、製薬会社から大きな関心を集めています。最近の動向では、様々な標的疾患に対する革新的な二重特異性抗体治療がもたらす大きな利点が臨床試験で示されており、これらの治療法の開発に携わる人々に大きな機会をもたらしています。
二特異性抗体市場は、血液がん、自己免疫疾患、その他の疾患に対する個別化医療への注目の高まりとともに、がん負担の増加などの主な要因によって牽引されています。慢性疾患の経済的負担の増大と死亡率への影響により、様々な腫瘍学的および非腫瘍学的疾患に対処できる効率的な二特異性抗体療法の必要性が高まっています。その結果、効率的な二特異性抗体治療に対するニーズの高まりとともに、産業界と非産業界の両方からの研究開発イニシアティブが、今後10年間の二特異性抗体市場を牽引すると予想されます。
二特異性抗体市場主要インサイト
本レポートでは、二重特異性抗体市場の現状を調査し、同市場における潜在的な成長機会を明らかにしています。本レポートの主な調査結果は以下の通りです。
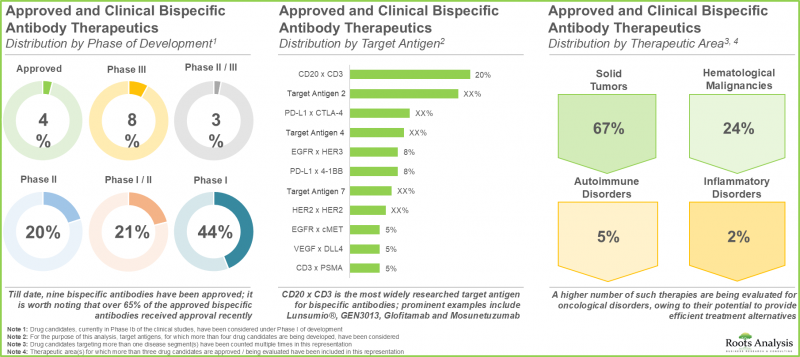
- 二重特異性抗体治療薬の状況は過去10年間で着実に進化しており、400を超える臨床/前臨床候補が世界中の120を超える医薬品開発企業別評価されています。
- 現在のパイプラインには、臨床段階にある二重特異性抗体医薬品の候補が多数あり、様々な生物学的抗原を標的とすることで、複数の適応症を治療できる可能性があります。
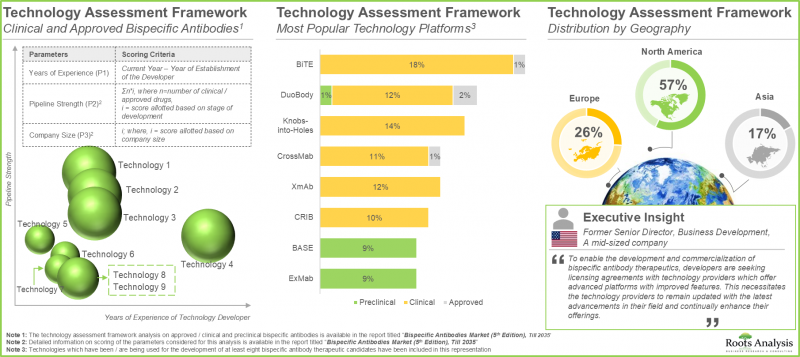
- 実際、業界関係者は85以上の二特異性抗体技術プラットフォームの開発に携わっており、このような治療に関連する既存の製造上の課題を軽減することを目指しています。
- 関心が高まっていることは、提携活動の活発化からも明らかで、企業は二重特異性抗体ポートフォリオを拡大するために積極的に戦略的契約を結んでいます。
- 2010年以降、様々な二重特異性抗体治療薬の安全性と有効性を評価するために、280近くの臨床試験が登録されており、これらの試験の大半は米国内で実施されています。
- これらの治療法を効率的に普及させるため、医薬品開発企業は市場での地位を維持する目的で、多様なプロモーション戦略を積極的に模索しています。
- 開発パイプラインへの注目の高まりと有望な臨床結果により、市場は今後10年間、年率6.5%以上の成長が見込まれています。
二重特異性抗体市場主要セグメント
血液悪性腫瘍が二重特異性抗体市場の急成長セグメント
治療分野別では、市場は自己免疫疾患、遺伝性疾患、血液悪性腫瘍、眼科疾患、皮膚がん、固形がんに区分されます。現在、遺伝子疾患が二重特異性抗体市場の最大シェアを占めています。血液悪性腫瘍の二特異性抗体市場は、比較的高いCAGRで成長する可能性が高いことは注目に値します。
予測期間中、T細胞の再標的化/活性化を通じて作用する二重特異性抗体が最大のシェアを占める
作用機序の観点から、市場はサイトカイン再標的化/中和、デュアルリガンドブロッキング、耐性因子共標的化、腫瘍血管新生標的化、T細胞再標的化/活性化、その他の活動に区分されます。現在、T細胞再標的化/活性化が二重特異性抗体市場で最大のシェアを占めています。しかし、近い将来、サイトカインの再標的化/中和によって作用する二重特異性抗体が最も高い市場を獲得すると予想されています。
CD3 x BCMAを標的とする二重特異性抗体が市場の急成長セグメント
標的抗原の観点から、市場はC5-アルブミン、CD20 x CD3、CD3 x BCMA、CD3 x CD19、EGFR x cMET、EpCAM x CD3、第IXa因子x X因子、gp100 x CD3、HER2 x HER2、PD-1 x CTLA-4、PD-L1 x TGFB、TNF-a x HSA、VEGF x DLL4、VEGF-A x ANG2に区分されます。現在のところ、第IXa因子×第X因子を標的とする治療薬が二重特異性抗体市場で最大のシェアを占めています。CD3 x BCMAをターゲットとする薬剤は、比較的高いCAGRで成長する可能性が高いことは注目に値します。
予測期間中、非対称二重特異性抗体が市場を独占する可能性が高い
抗体のフォーマットに関しては、市場は非対称型とフラグメント型に区分されます。現在、非対称抗体が二重特異性抗体市場で最大のシェアを占めています。この動向は当面変わりそうにないです。
北米が最大シェアを占める
主要地域別では、市場は北米、欧州、アジア太平洋、その他の地域に区分されます。北米が二重特異性抗体市場の大半を占めると予想されます。さらに、欧州が今後数年間、より高いCAGRで成長すると予想されることは注目に値します。
二重特異性抗体市場の参入企業例
- Akeso Biopharma
- Alexion
- Amgen
- Genmab
- Immunocore
- Janssen Research & Development
- Linton Pharm
- Merck
- OncXerna Therapeutics
- Pfizer
- Roche
- Taisho Pharmaceutical
- Zymeworks
1次調査の概要
本調査で提示した意見や洞察は、複数の利害関係者との議論によって影響を受けたものです。本調査レポートでは、以下の業界利害関係者との詳細なインタビュー記録を掲載しています:
- シニアサイエンティスト、A社
- 事業開発コンサルタント、B社
- ディレクター(GMP臨床製造)、C社
- D社元ビジネス開発シニアディレクター
- E社、創業者兼最高科学責任者兼最高経営責任者
- F社博士課程在籍
二重特異性抗体市場調査対象
- 市場規模と機会分析本レポートでは、[A]治療領域、[B]作用機序、[C]標的抗原、[D]抗体形態、[E]主要地域などの主要市場セグメントに焦点を当て、二重特異性抗体市場を詳細に分析しています。
- 市場情勢1:承認済みまたは臨床開発段階にある二重特異性抗体を、[A]開発企業、[B]開発段階、[C]標的抗原、[D]治療タイプ、[E]投与経路、[F]投与方法、[G]標的適応症、[H]治療領域、[I]疾患セグメント、[J]設立年、[K]企業規模、[L]本社所在地などの様々なパラメータを考慮して包括的に評価。
- 市場情勢2:現在前臨床試験で評価されている二重特異性抗体を、[A]開発企業、[B]開発ステージ、[C]標的抗原、[D]治療領域、[E]疾患セグメント、[F]設立年、[G]企業規模、[H]開発企業の本社所在地などの様々なパラメータを考慮して包括的に評価。
- 主要な洞察A]開発段階と投与経路、[B]開発段階と疾患セグメント、[C]開発段階と本社所在地などの関連パラメータに基づき、二重特異性抗体治療薬の市場動向を詳細に分析。さらに、本章では、[D]開発段階と疾患セグメント、[E]開発段階と本社所在地に基づき、前臨床段階の二重特異性抗体治療薬を様々に表現しています。さらに、本章では、[F]開発段階(前臨床、臨床、前臨床・臨床)、[G]本社所在地に基づいた二重特異性抗体治療薬の開発企業についても記載しています。
- 技術評価の枠組み:A]臨床/前臨床パイプラインの強さ、[B]開発者の経験年数、[C]企業規模、[D]開発者の本社所在地など、複数の関連パラメータに基づき、様々な医薬品開発企業が二重特異性抗体治療薬の製造のために開発/使用している技術プラットフォームを詳細に評価。
- ビッグファーマ分析:主要製薬企業別二重特異性抗体治療薬に焦点を当てた様々なイニシアチブを包括的に検証。この分析には、主要製薬企業の分布を示すヒートマップビジュアライゼーションや、複数の関連パラメータにわたるイニシアチブを比較するスパイダーウェブ図が含まれます。
- 企業プロファイル:A]企業概要、[B]財務情報(入手可能な場合)、[C]医薬品ポートフォリオ、[D]最近の動向、[E]情報に基づいた将来展望に焦点を当て、様々な地域で二特異性抗体の開発に携わる主要企業プロファイルを詳細に掲載しています。
- パートナーシップとコラボレーションA]パートナーシップ締結年、[B]パートナーシップのタイプ、[C]疾患セグメント、[D]採用された支払いモデルのタイプ、[E]取引額、[F]最も活発なプレーヤー(締結された取引数で)、[G]最も人気のある技術(技術について締結された取引数で)などのいくつかのパラメータに基づいて、2016年以降、この分野で確立されたパートナーシップの分析。本セクションでは、この市場におけるパートナーシップ活動の地域分布も明らかにしています。
- 二重特異性抗体治療薬の契約サービス:二重特異性抗体の製造に関連する主なステップと課題についてのレビュー。また、二種特異性抗体開発者が適切なCRO/CMOを選択する際に考慮すべき主な点を強調し、製造受託機関(CMO)および生物製剤研究開発受託機関(CRO)のリストを掲載しています。
- 臨床試験の分析A]試験登録年、[B]試験フェーズ、[C]試験募集状況、[D]登録患者数、[E]試験のタイプ、[F]試験デザイン、[G]スポンサー/共同研究者のタイプ、[H]業界および非業界の主要参入企業、[I]主要な重点領域、[J]試験の地理的位置などのパラメータに基づいて、様々な二特異性抗体治療薬の完了済み、進行中、および計画中の臨床試験を調査。
- ケーススタディ1:二重特異性抗体の開発に関して、ICH、WHO、FDAが発表した一般的な規制ガイドラインに関する考察。また、FDAガイドラインに対する様々な製薬業界の対応についても詳述しています。
- ケーススタディ2:承認された二重特異性抗体であるBlincyto(R)とHemlibra(R)の開発者が採用している様々なプロモーション戦略や、それぞれのウェブサイトで入手可能な情報に基づく両薬剤の比較について、そのような取り組みを行っている企業の事例とともに、市販されている二重特異性抗体のプロモーションに使用されている様々なチャネルをレビューしています。
- SWOT分析:SWOT分析では、業界の進化に影響を与えそうな主な促進要因と課題に焦点を当てています。さらに、各SWOTパラメータが業界全体に及ぼす相対的な影響を強調したハーベイボール分析も掲載しています。
目次
第1章 序文
第2章 エグゼクティブサマリー
第3章 イントロダクション
- 章の概要
- 抗体イントロダクション
- 抗体治療薬
- 二重特異性抗体形態
- 二重特異性抗体治療薬の作用機序
- 二重特異性抗体の応用
第4章 承認済みおよび臨床治療の市場情勢
- 章の概要
- 承認済みおよび臨床段階の二重特異性抗体治療薬:市場情勢
- 承認済みおよび臨床段階の二重特異性抗体治療薬:開発企業の全体情勢
第5章 前臨床治療の市場情勢
- 章の概要
- 前臨床二重特異性抗体治療薬:市場情勢
- 前臨床二重特異性抗体治療薬:開発状況の全体情勢
第6章 重要な洞察
- 章の概要
- 承認済みおよび臨床段階の二重特異性抗体治療薬の情勢:重要な洞察
- 前臨床段階における二重特異性抗体治療薬の情勢:重要な洞察
- 二重特異性抗体治療薬開発の情勢:重要な洞察
第7章 技術評価フレームワーク
- 章の概要
- 二重特異性抗体治療薬:技術プラットフォーム一覧
- 二重特異性抗体技術プラットフォーム:比較分析
- 最も人気のあるテクノロジープラットフォーム:開発段階別分析
- 二重特異性抗体技術プラットフォーム開発企業:本社所在地別分析
第8章 大手製薬企業:ベンチマーク分析
- 章の概要
- 大手製薬企業:ベンチマーク分析(スパイダーウェブ表現)
- 大手製薬企業:臨床パイプラインの比較分析
第9章 企業プロファイル
- 章の概要
- Akeso Biopharma
- Alphamab Oncology
- Amgen
- Merck
- Regeneron
- Roche
- Xencor
第10章 パートナーシップとコラボレーション
- 章の概要
- パートナーシップモデル
- 二重特異性抗体治療薬:パートナーシップとコラボレーション
第11章 二重特異性抗体治療薬に関する契約サービス
- 章の概要
- 二重特異性抗体治療薬の製造
- 適切なCMO/CROパートナーを選択するための重要な考慮事項
第12章 臨床試験の分析
- 章の概要
- 主要な前提と調査手法
- 二重特異性抗体治療薬:臨床試験分析
第13章 ケーススタディ:二重特異性抗体に関する規制ガイドライン
- 章の概要
- 規制当局が発行したガイドライン
- 米国食品医薬品局(FDA)
- 世界保健機関(WHO)
第14章 ケーススタディ:プロモーション/マーケティング戦略
- 章の概要
- プロモーションキャンペーンに使用される主なチャネル
- プロモーションおよびマーケティング戦略に使用されるその他のチャネル
- サマリー:二重特異性抗体開発者が活用するプロモーションおよびマーケティング戦略
- プロモーション分析:Blincyto(R)
- プロモーション分析:ヘムライブラ(R)
第15章 市場予測と機会分析
- 章の概要
- 範囲と制限
- 予測調査手法と主要な前提条件
- 二重特異性抗体治療薬市場、2035年まで
- 二重特異性抗体市場:価値創造分析
- 二重特異性抗体治療薬市場:製品別売上予測
- AK104(アケソ・バイオファーマ)
- ブリンサイト(TM)(アムジェン)
- ヘムライブラ(R)(ロシュ)
- Kimmtrak(R)(イムノコア)
- ルンスミオ(R)(ロシュ)
- ナノゾラ(R)(大正製薬)
- Rybrevant(TM)(ヤンセン・研究開発)
- Tecvayli(TM)(ヤンセン・研究開発)
- ヴァビスモ(TM)(ロシュ)
- AK112(アケソ・バイオファーマ)
- ALXN1720(アレクシオン)
- GEN3013(ゲンマブ)
- グロフィタマブ(ロシュ)
- LP000(リントンファーム)
- M7824(メルク)
- OMP 305B83(メレオバイオファーマ)
- PF-06863135(ファイザー)
- ZW25(ザイムワークス)
- 結論
第16章 SWOT分析
- 章の概要
- 強み
- 弱点
- 機会
- 脅威
- 結論

