
細胞治療パッケージング市場:2035年までの業界動向と世界の予測:包装される治療タイプ別、包装設計別、事業規模別、主要地域
Cell Therapy Packaging Market by Type of Therapy Packed, Package Engineering Design, Scale of Operation and Key Geographical Regions: Industry Trends and Global Forecasts, Till 2035- 発行日
- ページ情報
- 英文 204 Pages
- 納期
- 即日から翌営業日
- 商品コード
- 1849800
- カスタマイズ可能 お客様のご希望に応じて、既存データの加工や未掲載情報(例:国別セグメント)の追加などの対応が可能です。詳細はお問い合わせください。
- 翻訳ツール提供対象 PDF対応AI翻訳ツールの無料貸し出しサービスのご利用が可能です
- 医薬品関連専門 医薬品関連専門を専門とする市場調査会社です。
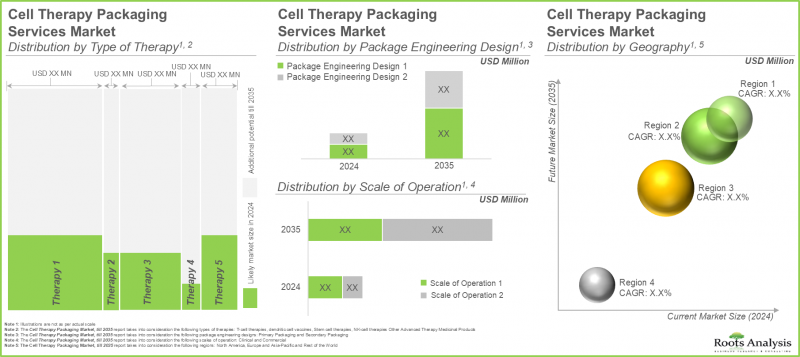
世界の細胞治療パッケージングの市場規模は、2035年までの予測期間中にCAGR 11.7%で拡大し、現在の4億400万米ドルから2035年までに12億2,500万米ドルに成長すると予測されています。
市場セグメンテーションでは、市場規模および機会分析を以下のパラメータで区分しています。
包装される治療タイプ別
- T細胞治療
- 樹状細胞ワクチン
- 幹細胞治療
- NK細胞治療
- その他の先進治療薬
事業規模
- 臨床規模
- 商業規模
包装設計
- 一次包装
- 二次包装
主要地域
- 北米
- 欧州
- アジア太平洋
- その他の地域
細胞治療パッケージング市場成長と動向
長年にわたり、製薬業界は医薬品開発においていくつかの進歩を目の当たりにしてきました。この領域は、普遍的な治療の選択肢から、様々な疾患の適応症に対して個別化された細胞治療を取り入れた、より個別化された治療へのアプローチへと移行しています。この変遷は、医薬品包装分野にも顕著な変化をもたらしました。細胞治療薬の包装は、低分子治療薬や他の生物製剤に比べて複雑になる傾向があります。極低温と厳しい品質基準で細胞の無菌性と生存性を維持するため、充填・仕上げ、保管、輸送に特定の条件が必要となります。細胞治療の管理には複雑さが伴うため、開発者はこれらの治療薬を包装し輸送するための戦略的計画を立てることが不可欠です。
最近の動向では、細胞治療の無菌性と品質を確保するために、複数の開発者が業界の利害関係者と戦略的パートナーシップを結び、保存と輸送に加えて治療介入の完全性を確保しています。サービス・プロバイダーは、こうした新規の最先端治療の安定性を維持するために必要なコールドチェーンや極低温環境の需要を満たすために、従来のパッケージング製品を超えてパッケージング技術を着実に進化させていることは注目に値します。自動化、AI主導の分析、クローズドシステム生産、CRISPR遺伝子編集、改良型ウイルスベクター技術などの革新は、効率を高め、汚染リスクを低減し、コストを下げ、複雑な治療法のスケーラブルな製造を可能にします。このように、細胞ベースの治療薬に対する需要の高まりにより、細胞治療パッケージングサービス市場は予測期間中に大幅な成長が見込まれます。
細胞治療パッケージング市場主な洞察
この調査レポートは、細胞治療パッケージング市場の現状を調査し、潜在的な成長機会を特定しています。当レポートの主な調査結果は以下の通りです。
- いくつかの製品タイプは、様々なタイプの細胞治療のパッケージングに必要な能力を有していると主張しています。そのうち、94%の企業は製品開発の様々な段階にわたって複数の追加サービスを提供しています。
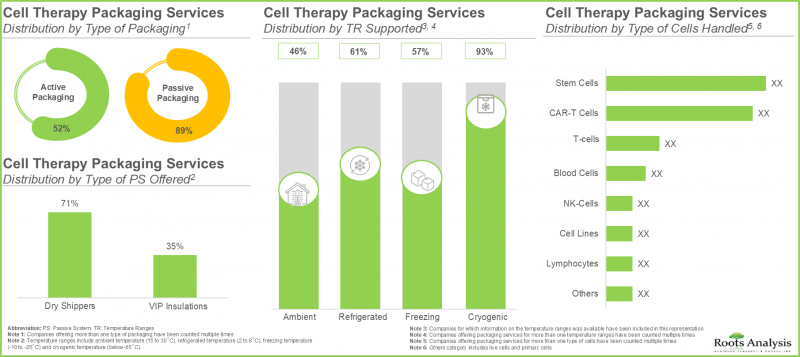
- この分野の利害関係者が提供するサービスの90%近くが細胞治療の受動的包装であり、このうち50%近くの企業がドライシッパーを極低温域での受動的システムとして提供しています。
- 30社以上が様々な形態で細胞治療薬の包装サービスを提供しており、これらの企業の大半は北米に本社を置いています。
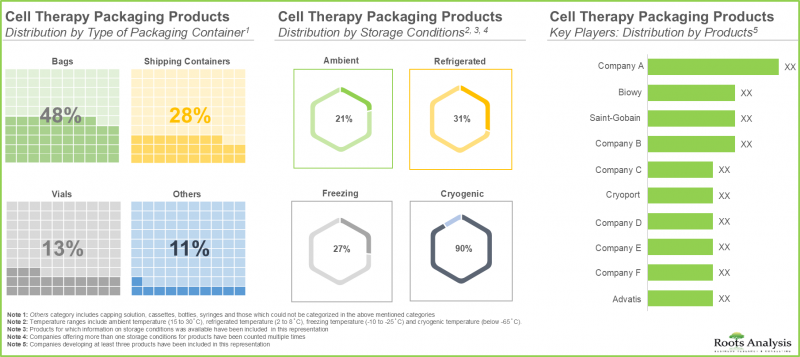
- 細胞治療用包装製品の50%近くは薬剤の保管や保護に使用されるバッグであり、さらにこれらの製品の71%は極低温温度範囲での包装製品を提供しています。
- 競争優位性を追求するため、この分野の利害関係者は既存の能力を積極的にアップグレードし、包装関連のサービスポートフォリオを強化しています。
- 2016年以降、この領域における提携活動は顕著に増加しており、最近の提携のほとんどは包装技術/プラットフォームの統合に焦点を当てています。
- 今後、より多くの細胞治療が承認されることが予想されるため、開発者は受託サービスプロバイダーと戦略的パートナーシップを結び、業務の一部をアウトソーシングすることが予想されます。
- 細胞治療製品に対する需要の高まりに対応するため、メーカー各社は世界各地に拠点を設けているが、現在のところ、米国が細胞治療の主要製造拠点として浮上しています。
- 市場の成長は、細胞治療に対する需要の高まり別牽引される可能性が高いです。今後の成長機会は、様々な事業規模や地域にうまく分散していくことが予想されます。
細胞治療パッケージング市場主要セグメント
T細胞治療セグメントが細胞治療パッケージング市場で最大シェアを占める
包装される治療のタイプに基づき、市場はT細胞治療、樹状細胞がんワクチン、幹細胞治療、NK細胞治療、その他の先端治療医薬品に区分されます。がんを効果的に治療する効果が実証されていることから、T細胞治療分野は現在の細胞治療パッケージング市場で最大のシェアを占めています。この動向は今後数年間も変わらないと思われます。
予測期間中、商業規模セグメントが細胞治療パッケージング市場の急成長セグメントとなる
運用規模に基づいて、市場は臨床規模と商業規模に区分されます。市場シェアは臨床の方が高いが、商業規模セグメントが今後数年間で大幅な市場成長が見込まれることは注目に値します。
現在、一次包装セグメントが細胞治療包装市場で最大シェアを占める
包装設計に基づき、市場は一次包装と二次包装に区分されます。現在、一次包装が細胞治療包装市場で最大のシェアを占めており、この動向は今後数年間も変わらないとみられます。これは、保護、使いやすさ、費用対効果、投与量管理など、一次包装には多くの利点があるためと考えられます。
アジア太平洋が市場の最大シェアを占める
主要地域別に見ると、市場は北米、欧州、アジア太平洋、その他アジア太平洋地域に区分されます。今後数年間、欧州の市場がより高いCAGRで成長すると予想されることは注目に値します。
1次調査概要
- ドイツ、小規模企業、業者兼オーナー
- ドイツ、小規模企業、最高財務責任者
- 米国、小規模企業、最高事業責任者
- 米国、小会社、サイエンティフィック・アフェアーズおよびテクニカル・マーケティング担当シニア・ディレクター
- アイルランド、大企業、ペプチド担当副社長
- 日本、大企業、ペプチド事業プロジェクトリーダー、シニアマネージャー
細胞治療パッケージ市場の参入企業例
- Almac
- Catalent Biologics
- Cryoport Systems
- Saint-Gobain
- Thermo Fisher Scientific
- West Pharmaceuticals
- Yourway
細胞治療パッケージング市場調査対象
- 市場規模と機会分析:当レポートでは、[A]包装される治療タイプ、[B]事業規模、[C]包装設計、[D]主要地域などの主要市場セグメントに焦点を当て、細胞治療パッケージング市場を詳細に分析しています。
- 市場情勢(サービスプロバイダー):A]設立年、[B]企業規模、[C]本社所在地、[D]提供するサービスの種類、[E]パッケージングの種類、[F]提供するパッシブシステムの種類、[F]パッケージングエンジニアリングデザイン、[G]使用する相変化材料など、様々なパラメータを考慮した細胞治療パッケージングサービスプロバイダーの包括的評価。
- 市場情勢(細胞治療パッケージング製品):A]包装容器のタイプ、[B]容器製造材料のタイプ、[C]容器製造のための原材料、[D]包装される細胞のタイプ、[E]保存条件、[F]容器の使いやすさなど、様々なパラメータを考慮した細胞治療包装製品の包括的評価。また、[G]設立年、[H]企業規模、[I]本社所在地、[J]最も活発な参入企業(製品数)など、複数のパラメータに基づく製品プロバイダーに関する詳細な分析も含まれています。
- 企業プロファイル:A]企業概要、[B]サービス/製品ポートフォリオ、[C]最近の動向、[D]将来の展望に焦点を当て、細胞治療パッケージング製品およびサービスを提供する主要企業プロファイルを詳細に掲載。
- 競合分析:A]企業のサービス力、[B]パッケージング・ポートフォリオ、[C]サービス・ポートフォリオなどの要因を調査し、細胞治療パッケージング・サービス・プロバイダーの包括的な競合分析を行います。
- パートナーシップとコラボレーション:提携年、提携の種類(サービス提携、技術/プラットフォーム統合契約、M&A)、提携の目的、提供するサービスの種類、提携に関与する参入企業の地域など、いくつかのパラメータに基づいて、2016年以降にこの分野で設立された提携を分析。
- パートナー候補の分析:細胞治療パッケージング・プロバイダーと提携する可能性の高い250以上の細胞治療開発企業を詳細に評価。この分析では、[A]開発企業の強み(企業規模に基づく)、[B]治療法の種類、[C]パイプラインの成熟度(医薬品候補の開発段階に基づく)など、様々な関連パラメータを考慮しています。
- ケーススタディA]設立年、[B]企業規模、[C]本社所在地、[D]製造施設所在地。さらに、[E]製造される細胞の種類、[F]細胞の供給源、[G]事業規模、[H]製造能力/サービスに関する詳細な分析も含まれています。
目次
第1章 序文
第2章 エグゼクティブサマリー
第3章 イントロダクション
- 章の概要
- 医薬品充填包装
- 医薬品包装の重要性
- 医薬品包装の種類
- 細胞治療のパッケージング
- 一次包装
- 二次包装
- 細胞治療パッケージング:重要な考慮事項
- 細胞治療パッケージングに関連する課題
- 結論
第4章 細胞治療パッケージングサービスプロバイダー:市場情勢
- 章の概要
- 細胞治療パッケージングサービスプロバイダー:市場情勢
第5章 細胞治療パッケージング製品プロバイダー:市場情勢
- 章の概要
- 細胞治療用パッケージ製品:市場情勢
- 細胞治療パッケージング:製品プロバイダーの情勢
第6章 細胞治療パッケージングサービスおよび製品プロバイダー:企業プロファイル
- 章の概要
- 細胞治療パッケージングサービスプロバイダー
- Almac
- Catalent Biologics
- Cryoport Systems
- Yourway
- 細胞治療パッケージング製品プロバイダー
- Saint-Gobain Life Sciences
- Thermo Fisher Scientific
- West Pharmaceutical Services
第7章 企業競争力分析
- 章の概要
- 主なパラメータ
- 調査手法
- 細胞治療パッケージングサービスプロバイダー:企業競争力分析
- 北米に拠点を置く企業
- 欧州とアジア太平洋に拠点を置く企業
第8章 パートナーシップとコラボレーション
- 章の概要
- パートナーシップモデル
- 細胞治療パッケージング:パートナーシップとコラボレーションのリスト
第9章 パートナー候補の分析
- 章の概要
- 範囲と調査手法
- 北米の細胞治療パッケージングプロバイダーの潜在的戦略的パートナー
- 欧州の細胞治療パッケージングプロバイダーの潜在的戦略的パートナー
- アジア太平洋およびその他の地域の細胞治療パッケージングプロバイダーの潜在的戦略的パートナー
第10章 細胞治療の開発者と製造業者:ケーススタディ
- 章の概要
- 細胞治療メーカー:市場情勢
第11章 世界の細胞治療パッケージ市場
第12章 細胞治療パッケージ市場(治療タイプ別)
第13章 細胞治療パッケージ市場(事業規模別)
第14章 細胞治療用包装市場(包装設計別)
第15章 細胞治療パッケージ市場(主要地域別)
第16章 結論
第17章 付録1:表形式データ
第18章 付録2:企業・団体一覧
- 発行日
- 発行
- Roots Analysis
- ページ情報
- 英文 204 Pages
- 納期
- 即日から翌営業日
