
|
市場調査レポート
商品コード
1682708
デジタルバイオマーカー市場:製品タイプ別、ソリューションの目的別、バイオマーカータイプ別、治療分野別、ビジネスモデル別、主要地域別:2035年までの業界動向と世界の予測Digital Biomarkers Market by Type of Product, Purpose of Solution, Type of Biomarker, Therapeutic Area, Business Model and Key Geographical Regions : Industry Trends and Global Forecasts, Till 2035 |
||||||
カスタマイズ可能
|
|||||||
| デジタルバイオマーカー市場:製品タイプ別、ソリューションの目的別、バイオマーカータイプ別、治療分野別、ビジネスモデル別、主要地域別:2035年までの業界動向と世界の予測 |
|
出版日: 2025年03月19日
発行: Roots Analysis
ページ情報: 英文 369 Pages
納期: 即日から翌営業日
|

全表示
- 概要
- 図表
- 目次
世界のデジタルバイオマーカーの市場規模は、2035年までの予測期間中に18.48%のCAGRで拡大し、現在の56億米ドルから2035年までに358億米ドルに成長すると予測されています。
デジタルバイオマーカーソリューションは、センサーやウェアラブルなどのハードウェアとソフトウェア機能を組み合わせたもので、人体内の特定のバイオマーカーをモニタリングし、それを分析することで標的適応症に関する重要な洞察を得ることができます。現代のヘルスケアでは、デジタルバイオマーカーは、臨床的に関連する健康パラメータの継続的なモニタリングと評価を可能にすることで、診断と治療の精度を高めるのに役立っています。国連が発表した報告書によると、65歳以上の人口は2050年には2倍の15億人近くに達すると予測されています。慢性疾患の有病率の上昇と高齢化により、ヘルスケア全体のコストは今後数年間で大幅に増加する可能性が高いです。早期介入による継続的な症状追跡は、患者のQOL向上や医療管理負担の軽減など、さまざまなメリットをもたらすことが研究で示されています。
さらに、バーチャルかつ分散化された臨床研究の増加により、患者が頻繁に対面する必要なく、正確で信頼性の高いリアルタイムの健康情報を提供するデジタルバイオマーカーの採用に拍車がかかっています。この動向は、臨床研究への多数の患者の参加を促進し、より患者中心のアプローチを提供し、バイオマーカーのより多様で精巧なデータセットを提供します。遠隔患者モニタリングソリューション(特に慢性適応症の場合)の採用が増加し、個別化治療が好まれていることから、デジタルバイオマーカー市場は当面大きなペースで成長する可能性が高いとみられています。
現在、220以上のデジタルバイオマーカーソリューションが世界中の様々な参入企業により利用可能/開発中であり、これらのソリューションの大半はデータ収集/分析ツール(具体的にはソフトウェアプラットフォームとリストバンド)です。
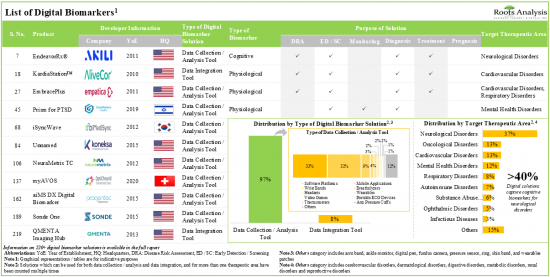
デジタルソリューションの40%以上が、様々な生理学的バイオマーカー(脈拍、心拍、体温など)に関連するデータを収集/分析しており、これらのほとんどは成人や高齢者のリアルタイム・モニタリングに使用されています。さまざまなリソースを持つ複数の企業(新興企業から老舗企業まで)が、この領域に積極的に取り組んでおり、これらの企業の大半は北米に拠点を置いています。産業界だけでなく、非産業界の参入企業もこの分野で戦略的提携を結んでおり、大陸間および大陸内の提携のほとんどは北米を拠点とする参入企業が結んでいます。
過去3年間で、デジタルバイオマーカーの領域で進行中のイノベーションと臨床結果について議論するために、50以上のイベント(オフラインおよびオンライン)が開催され、さらに、約55人の著名な利害関係者がこれらのイベントに参加しました。2019年以降、デジタルバイオマーカーに関連する750件以上の特許が、この領域内で生成された知的財産を保護するために、様々な利害関係者に出願/付与されています。デジタルバイオマーカー市場は、2035年まで年率18.5%(CAGR)で成長すると予測されており、予測される機会は、さまざまなタイプの製品、ソリューションの目的、バイオマーカーのタイプに分散される可能性が高いです。
当レポートでは、世界のデジタルバイオマーカー市場について調査し、市場の概要とともに、製品タイプ別、ソリューションの目的別、バイオマーカータイプ別、治療分野別、ビジネスモデル別、主要地域別の動向、および市場に参入する企業のプロファイルなどを提供しています。
目次
第1章 序文
第2章 調査手法
第3章 経済およびその他のプロジェクト特有の考慮事項
第4章 エグゼクティブサマリー
第5章 イントロダクション
第6章 市場情勢
第7章 製品競争力分析
第8章 企業プロファイル:デジタルバイオマーカーソリューション開発企業
第9章 パートナーシップとコラボレーション
第10章 資金調達と投資
第11章 世界的出来事の分析
第12章 特許分析
第13章 大手製薬会社の取り組み
第14章 市場への影響分析:促進要因、抑制要因、機会、課題
第15章 世界のデジタルバイオマーカーソリューション市場
第16章 デジタルバイオマーカーソリューション市場、製品タイプ別
第17章 デジタルバイオマーカーソリューション市場、ソリューションの目的別
第18章 デジタルバイオマーカーソリューション市場、バイオマーカータイプ別
第19章 デジタルバイオマーカーソリューション市場、治療分野別
第20章 デジタルバイオマーカーソリューション市場、ビジネスモデル別
第21章 デジタルバイオマーカーソリューション市場、主要地域別
第22章 結論
第23章 エグゼクティブ洞察
第24章 付録1:表形式のデータ
第25章 付録2:企業・団体一覧
List of Tables
- Table 5.1 Key Advantages and Limitations for Digital Biomarkers
- Table 6.1 Digital Biomarker Solutions: Overall Market Landscape
- Table 6.2 Digital Biomarker Solutions: Information on Status of Development, Approving Authority, Launch Data and Purpose of Biomarker Solutions
- Table 6.3 Digital Biomarker Solutions: Information on Target Indication, Target Therapeutic Area, Target Population and Target Segment
- Table 6.4 Digital Biomarker Solutions: Information on Solution Specifications, End-user, Clinical Validation and AI Integration
- Table 6.5 Digital Biomarker Solutions: Developers Landscape
- Table 8.1 Players Developing Digital Biomarker Solutions: List of Companies Profiled
- Table 8.2 BioSensics: Company Snapshot
- Table 8.3 BioSensics: Digital Biomarker Solutions Portfolio
- Table 8.4 BioSensics: Recent Developments and Future Outlook
- Table 8.5 Eyenuk: Company Snapshot
- Table 8.6 Eyenuk: Digital Biomarker Solutions Portfolio
- Table 8.7 Eyenuk: Recent Developments and Future Outlook
- Table 8.8 Quibim: Company Snapshot
- Table 8.9 Quibim: Digital Biomarker Solutions Portfolio
- Table 8.10 Quibim: Recent Developments and Future Outlook
- Table 8.11 Feel Therapeutics: Company Snapshot
- Table 8.12 Feel Therapeutics: Digital Biomarker Solutions Portfolio
- Table 8.13 Feel Therapeutics: Recent Developments and Future Outlook
- Table 8.14 AliveCor: Company Snapshot
- Table 8.15 AliveCor: Digital Biomarker Solutions Portfolio
- Table 8.16 AliveCor: Recent Developments and Future Outlook
- Table 8.17 BACtrack: Company Snapshot
- Table 8.18 BACtrack: Digital Biomarker Solutions Portfolio
- Table 8.19 Empatica: Company Snapshot
- Table 8.20 Empatica: Digital Biomarker Solutions Portfolio
- Table 8.21 Empatica: Recent Developments and Future Outlook
- Table 8.22 icometrix: Company Snapshot
- Table 8.23 icometrix: Digital Biomarker Solutions Portfolio
- Table 8.24 icometrix: Recent Developments and Future Outlook
- Table 8.25 Biogen: Company Snapshot
- Table 8.26 Biogen: Digital Biomarker Solutions Portfolio
- Table 8.27 Biogen: Recent Developments and Future Outlook
- Table 8.28 Acculi Labs: Company Snapshot
- Table 8.29 Acculi Labs: Digital Biomarker Solutions Portfolio
- Table 8.30 IXICO: Company Snapshot
- Table 8.31 IXICO: Digital Biomarker Solutions Portfolio
- Table 8.32 Kinsa: Company Snapshot
- Table 8.33 Kinsa: Digital Biomarker Solutions Portfolio
- Table 8.34 Progentec Diagnostics: Company Snapshot
- Table 8.35 Progentec Diagnostics: Digital Biomarker Solutions Portfolio
- Table 8.36 Vocalis Health: Company Snapshot
- Table 8.37 Vocalis Health: Digital Biomarker Solutions Portfolio
- Table 8.38 Kontigo Care: Company Snapshot
- Table 8.39 Kontigo Care: Digital Biomarker Solutions Portfolio
- Table 8.40 Koneksa Health: Company Snapshot
- Table 8.41 Koneksa Health: Digital Biomarker Solutions Portfolio
- Table 8.42 ActiGraph: Company Snapshot
- Table 8.43 ActiGraph: Digital Biomarker Solutions Portfolio
- Table 8.44 BioSerenity: Company Snapshot
- Table 8.45 BioSerenity: Digital Biomarker Solutions Portfolio
- Table 8.46 ATCOR: Company Snapshot
- Table 8.47 ATCOR: Digital Biomarker Solutions Portfolio
- Table 8.48 iMediSync: Company Snapshot
- Table 8.49 iMediSync: Digital Biomarker Solutions Portfolio
- Table 9.1 Digital Biomarker Solutions: List of Partnerships and Collaborations
- Table 10.1 Digital Biomarker Solutions: List of Funding and Investments
- Table 11.1 Digital Biomarker Solutions: List of Global Events
- Table 11.2 Global Events Analysis: Information on Name of Speakers and their Designations
- Table 12.1 Patent Analysis: Top CPC Sections
- Table 12.2 Patent Analysis: Top CPC Symbols
- Table 12.3 Patent Analysis: List of Top CPC Codes
- Table 12.4 Patent Analysis: Summary of Benchmarking Analysis
- Table 12.5 Patent Analysis: Categorization based on Weighted Valuation Scores
- Table 12.6 Patent Portfolio: List of Leading Patents (by Highest Relative Valuation)
- Table 23.1 Acculi Labs: Company Snapshot
- Table 23.3 IXICO: Company Snapshot
- Table 23.3 Tilak Healthcare: Company Snapshot
- Table 23.4 Vocalis Health: Company Snapshot
- Table 24.1 Digital Biomarker Solutions: Distribution by Type of Product
- Table 24.2 Digital Biomarker Solutions: Distribution by Type of Digital Biomarker Solution
- Table 24.3 Digital Biomarker Solutions: Distribution by Type of Biomarker
- Table 24.4 Digital Biomarker Solutions: Distribution by Status of Development
- Table 24.5 Digital Biomarker Solutions: Distribution by Type of Biomarker and Status of Development
- Table 24.6 Digital Biomarker Solutions: Distribution by Purpose of Digital Biomarker Solution
- Table 24.7 Digital Biomarker Solutions: Distribution by Target Therapeutic Area
- Table 24.8 Digital Biomarker Solutions: Distribution by Type of Biomarker and Target Therapeutic Area
- Table 24.9 Digital Biomarker Solutions: Distribution by Target Population
- Table 24.10 Digital Biomarker Solutions: Distribution by End-user
- Table 24.11 Digital Biomarker Solutions: Distribution by Availability of Clinical Validation
- Table 24.12 Digital Biomarker Solutions: Distribution of Clinically Validated Solutions by Target Therapeutic Area
- Table 24.13 Digital Biomarker Solutions: Distribution by Availability of AI Integration
- Table 24.14 Digital Biomarker Solution Developers: Distribution by Year of Establishment
- Table 24.15 Digital Biomarker Solution Developers: Distribution by Company Size
- Table 24.16 Digital Biomarker Solution Developers: Distribution by Location of Headquarters (Region)
- Table 24.17 Digital Biomarker Solution Developers: Distribution by Location of Headquarters (Country)
- Table 24.18 Digital Biomarker Solution Developers: Distribution by Company Size and Location of Headquarters
- Table 24.19 Most Active Players: Distribution by Number of Digital Biomarker Solutions Developed
- Table 24.20 Partnerships and Collaborations: Cumulative Year-Wise Trend
- Table 24.21 Partnerships and Collaborations: Distribution by Type of Partnership
- Table 24.22 Partnerships and Collaborations: Distribution by Year and Type of Partnership
- Table 24.23 Partnerships and Collaborations: Distribution by Type of Biomarker
- Table 24.24 Partnerships and Collaborations: Distribution by Type of Partnership and Type of Biomarker
- Table 24.25 Partnerships and Collaborations: Distribution by Therapeutic Area
- Table 24.26 Partnerships and Collaborations: Distribution by Type of Partnership and Therapeutic Area
- Table 24.37 Partnerships and Collaborations: Distribution by Type of Partner
- Table 24.28 Most Active Players: Distribution by Number of Partnerships
- Table 24.29 Partnerships and Collaborations: Intercontinental and Intracontinental Deals
- Table 24.20 Partnerships and Collaborations: International and Local Deals
- Table 24.31 Funding and Investments: Cumulative Year-wise Trend of Funding Instances
- Table 24.32 Funding and Investments: Cumulative Year-wise Trend of Amount Invested, Pre-2018-2024
- Table 24.33 Funding and Investment: Distribution by Type of Funding
- Table 24.34 Funding and Investments: Distribution of Amount Invested by Type of Funding (USD Million)
- Table 24.35 Funding and Investments: Distribution by Type of Biomarker
- Table 24.36 Funding and Investments: Distribution by Therapeutic Area
- Table 24.37 Leading Investors: Distribution by Number of Funding Instances
- Table 24.38 Most Active Players: Distribution by Number of Funding Instances
- Table 24.39 Most Active Players: Distribution by Amount Raised
- Table 24.40 Funding and Investments: Distribution by Geography (Region)
- Table 24.41 Funding and Investments: Distribution by Geography (Country)
- Table 24.42 Global Events Analysis: Cumulative Year-wise Trend
- Table 24.43 Global Events Analysis: Distribution by Type of Event
- Table 24.44 Global Events Analysis: Distribution by Year and Type of Event
- Table 24.45 Global Events Analysis: Distribution by Event Platform
- Table 24.46 Global Events Analysis: Distribution by Location of Event (Region)
- Table 24.47 Global Events Analysis: Distribution by Location of Event (Country)
- Table 24.48 Most Active Event Organizers: Distribution by Number of Events
- Table 24.49 Most Active Players: Distribution by Number of Events
- Table 24.50 Most Active Speakers: Distribution by Number of Events
- Table 24.51 Distribution by Designation / Qualification of Speakers
- Table 24.52 Patent Analysis: Distribution by Type of Patent
- Table 24.53 Patent Analysis: Cumulative Year-wise Trend by Patent Application Year
- Table 24.54 Patent Analysis: Cumulative Year-wise Trend by Patent Publication Year, since 2019
- Table 24.55 Patent Analysis: Distribution by Type of Patent and Patent Publication Year, since 2019
- Table 24.56 Patent Analysis: Distribution by Patent Jurisdiction (Region)
- Table 24.57 Patent Analysis: Distribution by Patent Jurisdiction (Country)
- Table 24.58 Patent Analysis: Distribution by Patent Publication Year and Type of Applicant
- Table 24.59 Leading Players: Distribution by Number of Patents
- Table 24.60 Leading Patent Assignees: Distribution by Number of Patents
- Table 24.61 Patent Analysis: Distribution by Patent Age
- Table 24.62 Digital Biomarker Solutions: Patent Valuation
- Table 24.63 Global Digital Biomarker Solutions Market, Historical Trends (since 2018) and Forecasted Estimates (till 2035) (USD Million)
- Table 24.64 Global Digital Biomarker Solutions Market, Forecasted Estimates (till 2035): Conservative Scenario (USD Million)
- Table 24.65 Global Digital Biomarker Solutions Market, Forecasted Estimates (till 2035): Optimistic Scenario (USD Million)
- Table 24.66 Digital Biomarker Solutions Market for Software / Applications, Historical Trends (since 2018) (USD Million)
- Table 24.67 Digital Biomarker Solutions Market: Distribution by Type of Product, 2018, 2024 and 2035
- Table 24.68 Digital Biomarker Solutions Market for Wearables, Historical Trends (since 2018) (USD Million)
- Table 24.69 Digital Biomarker Solutions Market for Software / Applications, Forecasted Estimates (till 2035) (USD Million)
- Table 24.70 Digital Biomarker Solutions Market for Sensors, Historical Trends (since 2018) (USD Million)
- Table 24.71 Digital Biomarker Solutions Market for Wearables, Forecasted Estimates (till 2035) (USD Million)
- Table 24.72 Digital Biomarker Solutions Market for Gaming Solutions, Historical Trends (since 2018) (USD Million)
- Table 24.73 Digital Biomarker Solutions Market for Gaming Solutions, Forecasted Estimates (till 2035), Conservative, Base and Optimistic Scenario (USD Million)
- Table 24.74 Biomarker Solutions Market: Distribution by Purpose of Solution, 2018, 2024 and 2035
- Table 24.75 Biomarker Solutions Market for Monitoring, Historical Trends (since 2018) (USD Million)
- Table 24.76 Digital Biomarker Solutions Market for Monitoring, Forecasted Estimates (till 2035), Conservative, Base and Optimistic Scenario (USD Million)
- Table 24.77 Biomarker Solutions Market for Diagnosis, Historical Trends (since 2018) (USD Million)
- Table 24.78 Biomarker Solutions Market for Diagnosis, Forecasted Estimates (till 2035), Conservative, Base and Optimistic Scenario (USD Million)
- Table 24.79 Digital Biomarker Solutions Market for Early Detection, Historical Trends (since 2018) (USD Million)
- Table 24.80 Digital Biomarker Solutions Market for Early Detection, Forecasted Estimates (till 2035), Conservative, Base and Optimistic Scenario (USD Million)
- Table 24.81 Biomarker Solutions Market for Predictive Insights, Historical Trends (since 2018) (USD Million)
- Table 24.82 Digital Biomarker Solutions Market for Predictive Insights, Forecasted Estimates (till 2035), Conservative, Base and Optimistic Scenario (USD Million)
- Table 24.83 Digital Biomarker Solutions Market: Distribution by Type of Biomarker, 2018, 2024 and 2035
- Table 24.84 Digital Biomarker Solutions Market for Physiological Biomarkers, Historical Trends (since 2018) (USD Million)
- Table 24.85 Digital Biomarker Solutions Market for Physiological Biomarkers, Forecasted Estimates (till 2035), Conservative, Base and Optimistic Scenario (USD Million)
- Table 24.86 Digital Biomarker Solutions Market for Vocal Biomarkers, Historical Trends (since 2018) (USD Million)
- Table 24.87 Digital Biomarker Solutions Market for Vocal Biomarkers, Forecasted Estimates (till 2035), Conservative, Base and Optimistic Scenario (USD Million)
- Table 24.88 Digital Biomarker Solutions Market for Cognitive Biomarkers, Historical Trends (since 2018) (USD Million)
- Table 24.89 Digital Biomarker Solutions Market for Cognitive Biomarkers, Forecasted Estimates (till 2035), Conservative, Base and Optimistic Scenario (USD Million)
- Table 24.90 Digital Biomarker Solutions Market for Idiosyncratic Biomarkers, Historical Trends (since 2018) (USD Million)
- Table 24.91 Digital Biomarker Solutions Market for Idiosyncratic Biomarkers, Forecasted Estimates (till 2035), Conservative, Base and Optimistic Scenario (USD Million)
- Table 24.92 Digital Biomarker Solutions Market for Other Biomarkers, Historical Trends (since 2018) (USD Million)
- Table 24.93 Digital Biomarker Solutions Market for Other Biomarkers, Forecasted Estimates (till 2035), Conservative, Base and Optimistic Scenario (USD Million)
- Table 24.94 Digital Biomarker Solutions Market: Distribution by Therapeutic Area, 2018, 2024 and 2035 (USD Million)
- Table 24.95 Digital Biomarker Solutions Market for Neurological Disorders, Historical Trends (since 2018) (USD Million)
- Table 24.96 Digital Biomarker Solutions Market for Neurological Disorders, Forecasted Estimates (till 2035) Conservative, Base and Optimistic Scenario (USD Million)
- Table 24.97 Digital Biomarker Solutions Market for Mental Health Disorders, Historical Trends (since 2018) (USD Million)
- Table 24.98 Digital Biomarker Solutions Market for Mental Health Disorders, Forecasted Estimates (till 2035), Conservative, Base and Optimistic Scenario (USD Million)
- Table 24.99 Digital Biomarker Solutions Market for Cardiovascular Disorders, Historical Trends (since 2018) (USD Million)
- Table 24.100 Digital Biomarker Solutions Market for Cardiovascular Disorders, Forecasted Estimates (till 2035), Conservative, Base and Optimistic Scenario (USD Million)
- Table 24.101 Digital Biomarker Solutions Market for Infectious Diseases, Historical Trends (since 2018) (USD Million)
- Table 24.102 Digital Biomarker Solutions Market for Infectious Diseases, Forecasted Estimates (till 2035), Conservative, Base and Optimistic Scenario (USD Million)
- Table 24.103 Digital Biomarker Solutions Market for Respiratory Disorders, Historical Trends (since 2018) (USD Million)
- Table 24.104 Digital Biomarker Solutions Market for Respiratory Disorders, Historical Trends (since 2018) (USD Million)
- Table 24.105 Digital Biomarker Solutions Market for Autoimmune Disorders, Historical Trends (since 2018) (USD Million)
- Table 24.106 Digital Biomarker Solutions Market for Autoimmune Disorders, Forecasted Estimates (till 2035), Conservative, Base and Optimistic Scenario (USD Million)
- Table 24.107 Digital Biomarker Solutions Market for Substance Abuse Disorders, Historical Trends (since 2018) (USD Million)
- Table 24.108 Digital Biomarker Solutions Market for Substance Abuse Disorders, Forecasted Estimates (till 2035), Conservative, Base and Optimistic Scenario (USD Million)
- Table 24.109 Digital Biomarker Solutions Market for Other Disorders, Historical Trends (since 2018) (USD Million)
- Table 24.110 Digital Biomarker Solutions Market for Other Disorders, Forecasted Estimates (till 2035), Conservative, Base and Optimistic Scenario (USD Million)
- Table 24.111 Digital Biomarker Solutions Market: Distribution by Business Model, 2018, 2024 and 2035
- Table 24.112 Digital Biomarker Solutions Market for B2B Model, Historical Trends (since 2018) (USD Million)
- Table 24.113 Digital Biomarker Solutions Market for B2B Model, Forecasted Estimates (till 2035), Conservative, Base and Optimistic Scenario (USD Million)
- Table 24.114 Digital Biomarker Solutions Market for B2C Model, Historical Trends (since 2018) (USD Million)
- Table 24.115 Digital Biomarker Solutions Market for B2C Model, Forecasted Estimates (till 2035), Conservative, Base and Optimistic Scenario (USD Million)
- Table 24.116 Digital Biomarker Solutions Market: Distribution by Key Geographical Regions, 2018, 2024 and 2035
- Table 24.117 Digital Biomarker Solutions Market in North America, Historical Trends (since 2018) (USD Million)
- Table 24.118 Digital Biomarker Solutions Market in North America, Forecasted Estimates (till 2035), Conservative, Base and Optimistic Scenario (USD Million)
- Table 24.119 Digital Biomarker Solutions Market in Europe, Historical Trends (since 2018) (USD Million)
- Table 24.120 Digital Biomarker Solutions Market in Europe, Forecasted Estimates (till 2035), Conservative, Base and Optimistic Scenario (USD Million)
- Table 24.121 Digital Biomarker Solutions Market in Asia-Pacific, Historical Trends (since 2018) (USD Million)
- Table 24.122 Digital Biomarker Solutions Market in Asia-Pacific, Forecasted Estimates (till 2035), Conservative, Base and Optimistic Scenario (USD Million)
- Table 24.123 Digital Biomarker Solutions Market in Middle East and North Africa, Historical Trends (since 2018) (USD Million)
- Table 24.124 Digital Biomarker Solutions Market in Middle East and North Africa, Forecasted Estimates (till 2035), Conservative, Base and Optimistic Scenario (USD Million)
- Table 24.125 Digital Biomarker Solutions Market in Rest of the World, Historical Trends (since 2018) (USD Million)
- Table 24.126 Digital Biomarker Solutions Market in Rest of the World, Forecasted Estimates (till 2035), Conservative, Base and Optimistic Scenario (USD Million)
List of Figures
- Figure 2.1 Research Methodology: Project Methodology
- Figure 2.2 Research Methodology: Forecast Methodology
- Figure 2.3 Research Methodology: Robust Quality Control
- Figure 2.4 Research Methodology: Key Market Segmentation
- Figure 3.1 Lessons Learnt from Past Recessions
- Figure 4.1 Executive Summary: Digital Biomarker Solutions Market Landscape
- Figure 4.2 Executive Summary: Digital Biomarker Solution Developer Landscape
- Figure 4.3 Executive Summary: Partnerships and Collaborations
- Figure 4.4 Executive Summary: Funding and Investments
- Figure 4.5 Executive Summary: Global Events Analysis
- Figure 4.6 Executive Summary: Patent Analysis
- Figure 4.7 Executive Summary: Digital Biomarker Solutions Market Forecast and Opportunity Analysis
- Figure 5.1 Types of Digital Biomarkers
- Figure 5.2 Types of Biomarkers / Signals Captured by Digital Biomarker Solutions
- Figure 5.3 Emerging Focus Areas: Google News
- Figure 6.1 Digital Biomarker Solutions: Distribution by Type of Product
- Figure 6.2 Digital Biomarker Solutions: Distribution by Type of Digital Biomarker Solution
- Figure 6.3 Digital Biomarker Solutions: Distribution by Type of Biomarker
- Figure 6.4 Digital Biomarker Solutions: Distribution by Status of Development
- Figure 6.5 Digital Biomarker Solutions: Distribution by Type of Biomarker and Status of Development
- Figure 6.6 Digital Biomarker Solutions: Distribution by Purpose of Digital Biomarker Solution
- Figure 6.7 Digital Biomarker Solutions: Distribution by Target Therapeutic Area
- Figure 6.8 Digital Biomarker Solutions: Distribution by Type of Biomarker and Target Therapeutic Area
- Figure 6.9 Digital Biomarker Solutions: Distribution by Target Population
- Figure 6.10 Digital Biomarker Solutions: Distribution by End-user
- Figure 6.11 Digital Biomarker Solutions: Distribution by Availability of Clinical Validation
- Figure 6.12 Digital Biomarker Solutions: Distribution of Clinically Validated Solutions by Target Therapeutic Area
- Figure 6.13 Digital Biomarker Solutions: Distribution by Availability of AI Integration
- Figure 6.14 Digital Biomarker Solution Developers: Distribution by Year of Establishment
- Figure 6.15 Digital Biomarker Solution Developers: Distribution by Company Size
- Figure 6.16 Digital Biomarker Solution Developers: Distribution by Location of Headquarters (Region)
- Figure 6.17 Digital Biomarker Solution Developers: Distribution by Location of Headquarters (Country)
- Figure 6.18 Digital Biomarker Solution Developers: Distribution by Company Size and Location of Headquarters
- Figure 6.19 Most Active Players: Distribution by Number of Digital Biomarker Solutions Developed
- Figure 7.1 Product Competitiveness Analysis: Digital Biomarker Solutions Developed by Players based in North America
- Figure 7.2 Product Competitiveness Analysis: Digital Biomarker Solutions Developed by Players based in Europe
- Figure 7.3 Product Competitiveness Analysis: Digital Biomarker Solutions Developed by Players based in Asia-Pacific and Rest of the World
- Figure 9.1 Partnerships and Collaborations: Cumulative Year-Wise Trend
- Figure 9.2 Partnerships and Collaborations: Distribution by Type of Partnership
- Figure 9.3 Partnerships and Collaborations: Distribution by Year and Type of Partnership
- Figure 9.4 Partnerships and Collaborations: Distribution by Type of Biomarker
- Figure 9.5 Partnerships and Collaborations: Distribution by Type of Partnership and Type of Biomarker
- Figure 9.6 Partnerships and Collaborations: Distribution by Therapeutic Area
- Figure 9.7 Partnerships and Collaborations: Distribution by Type of Partnership and Therapeutic Area
- Figure 9.8 Partnerships and Collaborations: Distribution by Type of Partner
- Figure 9.9 Most Active Players: Distribution by Number of Partnerships
- Figure 9.10 Partnerships and Collaborations: Intercontinental and Intracontinental Deals
- Figure 9.11 Partnerships and Collaborations: International and Local Deals
- Figure 10.1 Funding and Investments: Cumulative Year-wise Trend of Funding Instances
- Figure 10.2 Funding and Investments: Cumulative Year-wise Trend of Amount Invested
- Figure 10.3 Funding and Investment: Distribution by Type of Funding
- Figure 10.4 Funding and Investments: Distribution of Amount Invested by Type of Funding (USD Million)
- Figure 10.5 Funding and Investments: Distribution by Type of Biomarker
- Figure 10.6 Funding and Investments: Distribution by Therapeutic Area
- Figure 10.7 Leading Investors: Distribution by Number of Funding Instances
- Figure 10.8 Most Active Players: Distribution by Number of Funding Instances
- Figure 10.9 Most Active Players: Distribution by Amount Raised
- Figure 10.10 Funding and Investments: Distribution by Geography (Region)
- Figure 10.11 Funding and Investments: Distribution by Geography (Country)
- Figure 11.1 Global Events Analysis: Cumulative Year-wise Trend
- Figure 11.2 Global Events Analysis: Distribution by Type of Event
- Figure 11.3 Global Events Analysis: Distribution by Year and Type of Event
- Figure 11.4 Global Events Analysis: Distribution by Event Platform
- Figure 11.5 Global Events Analysis: Distribution by Location of Event (Region)
- Figure 11.6 Global Events Analysis: Distribution by Location of Event (Country)
- Figure 11.7 Word Cloud Analysis: Key Focus Areas
- Figure 11.8 Most Active Event Organizers: Distribution by Number of Events
- Figure 11.9 Most Active Players: Distribution by Number of Events
- Figure 11.10 Most Active Speakers: Distribution by Number of Events
- Figure 11.11 Distribution by Designation / Qualification of Speakers
- Figure 12.1 Patent Analysis: Distribution by Type of Patent
- Figure 12.2 Patent Analysis: Cumulative Year-wise Trend by Patent Application Year, Pre-since 2018
- Figure 12.3 Patent Analysis: Cumulative Year-wise Trend by Patent Publication Year, since 2019
- Figure 12.4 Patent Analysis: Distribution by Type of Patent and Patent Publication Year, since 2019
- Figure 12.5 Patent Analysis: Distribution by Patent Jurisdiction (Region)
- Figure 12.6 Patent Analysis: Distribution by Patent Jurisdiction (Country)
- Figure 12.7 Patent Analysis: Distribution by CPC Symbols
- Figure 12.8 Patent Analysis: Distribution by Patent Publication Year and Type of Applicant
- Figure 12.9 Leading Players: Distribution by Number of Patents
- Figure 12.10 Leading Patent Assignees: Distribution by Number of Patents
- Figure 12.11 Patent Benchmarking: Distribution of Patent Characteristics (CPC Codes) by Leading Players
- Figure 12.12 Patent Benchmarking: Distribution of Leading Players by Patent Characteristics (Top CPC Codes)
- Figure 12.13 Patent Analysis: Distribution by Patent Age
- Figure 12.14 Digital Biomarker Solutions: Patent Valuation
- Figure 13.1 Big Pharma Initiatives Related to Digital Biomarker Solutions: Distribution by Type of Initiative
- Figure 13.2 Big Pharma Initiatives Related to Digital Biomarker Solutions: Heat Map Analysis
- Figure 13.3 Spider Web Analysis: AbbVie
- Figure 13.4 Spider Web Analysis: Amgen
- Figure 13.5 Spider Web Analysis: AstraZeneca
- Figure 13.6 Spider Web Analysis: Bayer
- Figure 13.7 Spider Web Analysis: Bristol Myers Squibb
- Figure 13.8 Spider Web Analysis: Eli Lilly
- Figure 13.9 Spider Web Analysis: GlaxoSmithKline
- Figure 13.10 Spider Web Analysis: Johnson & Johnson
- Figure 13.11 Spider Web Analysis: Merck
- Figure 13.12 Spider Web Analysis: Novartis
- Figure 13.13 Spider Web Analysis: Pfizer
- Figure 13.14 Spider Web Analysis: Roche
- Figure 13.15 Spider Web Analysis: Sanofi
- Figure 13.16. Spider Web Analysis: Takeda Pharmaceuticals
- Figure 13.17 Most Active Players: Distribution by Number of Initiatives
- Figure 15.1 Global Digital Biomarker Solutions Market, Historical Trends (since 2018) and Forecasted Estimates (till 2035) (USD Million)
- Figure 15.2 Global Digital Biomarker Solutions Market, Forecasted Estimates (till 2035): Conservative Scenario (USD Million)
- Figure 15.3 Global Digital Biomarker Solutions Market, Forecasted Estimates (till 2035): Optimistic Scenario (USD Million)
- Figure 16.1 Digital Biomarker Solutions Market: Distribution by Type of Product, 2018, 2024 and 2035
- Figure 16.2 Digital Biomarker Solutions Market for Software / Applications: Historical Trends (since 2018) and Forecasted Estimates (till 2035) (USD Million)
- Figure 16.3 Digital Biomarker Solutions Market for Wearables: Historical Trends (since 2018) and Forecasted Estimates (till 2035) (USD Million)
- Figure 16.4 Digital Biomarker Solutions Market for Sensors: Historical Trends (since 2018) and Forecasted Estimates (till 2035) (USD Million)
- Figure 16.5 Digital Biomarker Solutions Market for Gaming Solutions: Historical Trends (since 2018) and Forecasted Estimates (till 2035) (USD Million)
- Figure 17.1 Digital Biomarker Solutions Market: Distribution by Purpose of Solution, 2018, 2024 and 2035
- Figure 17.2 Digital Biomarker Solutions Market for Monitoring: Historical Trends (since 2018) and Forecasted Estimates (till 2035) (USD Million)
- Figure 17.3 Digital Biomarker Solutions Market for Diagnosis: Historical Trends (since 2018) and Forecasted Estimates (till 2035) (USD Million)
- Figure 17.4 Digital Biomarker Solutions Market for Early Detection: Historical Trends (since 2018) and Forecasted Estimates (till 2035) (USD Million)
- Figure 17.5 Digital Biomarker Solutions Market for Predictive Insights: Historical Trends (since 2018) and Forecasted Estimates (till 2035) (USD Million)
- Figure 18.1 Digital Biomarker Solutions Market: Distribution by Type of Biomarker, 2018, 2024 and 2035
- Figure 18.2 Digital Biomarker Solutions Market for Physiological Biomarkers: Historical Trends (since 2018) and Forecasted Estimates (till 2035) (USD Million)
- Figure 18.3 Digital Biomarker Solutions Market for Vocal Biomarkers: Historical Trends (since 2018) and Forecasted Estimates (till 2035) (USD Million)
- Figure 18.4 Digital Biomarker Solutions Market for Cognitive Biomarkers: Historical Trends (since 2018) and Forecasted Estimates (till 2035) (USD Million)
- Figure 18.5 Digital Biomarker Solutions Market for Idiosyncratic Biomarkers: Historical Trends (since 2018) and Forecasted Estimates (till 2035) (USD Million)
- Figure 18.6 Digital Biomarker Solutions Market for Other Biomarkers: Historical Trends (since 2018) and Forecasted Estimates (till 2035) (USD Million)
- Figure 19.1 Digital Biomarker Solutions Market: Distribution by Therapeutic Area, 2018, 2024 and 2035
- Figure 19.2 Digital Biomarker Solutions Market for Neurological Disorders: Historical Trends (since 2018) and Forecasted Estimates (till 2035) (USD Million)
- Figure 19.3 Digital Biomarker Solutions Market for Mental Health Disorders: Historical Trends (since 2018) and Forecasted Estimates (till 2035) (USD Million)
- Figure 19.4 Digital Biomarker Solutions Market for Cardiovascular Disorders: Historical Trends (since 2018) and Forecasted Estimates (till 2035) (USD Million)
- Figure 19.5 Digital Biomarker Solutions Market for Infectious Diseases: Historical Trends (since 2018) and Forecasted Estimates (till 2035) (USD Million)
- Figure 19.6 Digital Biomarker Solutions Market for Respiratory Disorders: Historical Trends (since 2018) and Forecasted Estimates (till 2035) (USD Million)
- Figure 19.7 Digital Biomarker Solutions Market for Autoimmune Disorders: Historical Trends (since 2018) and Forecasted Estimates (till 2035) (USD Million)
- Figure 19.8 Digital Biomarker Solutions Market for Substance Abuse Disorders: Historical Trends (since 2018) and Forecasted Estimates (till 2035) (USD Million)
- Figure 19.9 Digital Biomarker Solutions Market for Other Disorders: Historical Trends (since 2018) and Forecasted Estimates (till 2035) (USD Million)
- Figure 20.1 Digital Biomarker Solutions Market: Distribution by Business Model, 2018, 2024 and 2035
- Figure 20.2 Digital Biomarker Solutions Market for B2B Model: Historical Trends (since 2018) and Forecasted Estimates (till 2035) (USD Million)
- Figure 20.3 Digital Biomarker Solutions Market for B2C Model: Historical Trends (since 2018) and Forecasted Estimates (till 2035) (USD Million)
- Figure 21.1 Digital Biomarker Solutions Market: Distribution by Key Geographical Regions, 2018, 2024 and 2035
- Figure 21.2 Digital Biomarker Solutions Market in North America: Historical Trends (since 2018) and Forecasted Estimates (till 2035) (USD Million)
- Figure 21.3 Digital Biomarker Solutions Market in Europe: Historical Trends (since 2018) and Forecasted Estimates (till 2035) (USD Million)
- Figure 21.4 Digital Biomarker Solutions Market in Asia-Pacific: Historical Trends (since 2018) and Forecasted Estimates (till 2035) (USD Million)
- Figure 21.5 Digital Biomarker Solutions Market in Middle East and North Africa: Historical Trends (since 2018) and Forecasted Estimates (till 2035) (USD Million)
- Figure 21.6 Digital Biomarker Solutions Market in Rest of the World: Historical Trends (since 2018) and Forecasted Estimates (till 2035) (USD Million)
- Figure 22.1 Concluding Remarks: Digital Biomarker Solutions Market Landscape
- Figure 22.2 Concluding Remarks: Digital Biomarker Solution Developers Landscape
- Figure 22.3 Concluding Remarks: Partnerships and Collaborations
- Figure 22.4 Concluding Remarks:
Funding and Investment
- Figure 22.5 Concluding Remarks: Global Events Analysis
- Figure 22.6 Concluding Remarks: Patent Analysis
- Figure 22.7 Concluding Remarks: Market Sizing and Opportunity Analysis (I/II)
- Figure 22.8 Concluding Remarks: Market Sizing and Opportunity Analysis (II/II)
DIGITAL BIOMARKERS MARKET: OVERVIEW
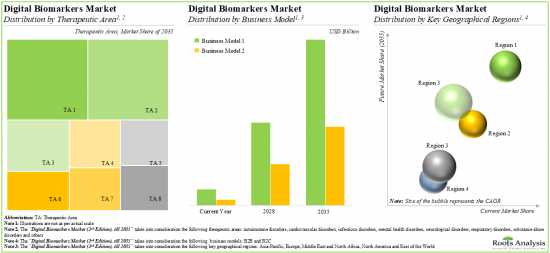
As per Roots Analysis, the global digital biomarkers market is estimated to grow from USD 5.6 billion in the current year to USD 35.8 billion by 2035, at a CAGR of 18.48% during the forecast period, till 2035.
The market opportunity for cell and gene therapy supply chain software has been distributed across the following segments:
Type of Product
- Software / Applications
- Wearables
- Sensors
- Gaming Solutions
Purpose of Solution
- Diagnosis
- Early Detection
- Monitoring
- Predictive Insights
Type of Biomarker
- Cognitive Biomarkers
- Idiosyncratic Biomarkers
- Physiological Biomarkers
- Vocal Biomarkers
- Other Biomarkers
Therapeutic Area
- Autoimmune Disorders
- Cardiovascular Disorders
- Infectious Diseases
- Mental Health Disorders
- Neurological Disorders
- Respiratory Disorders
- Substance Abuse Disorders
- Others
Business Model
- B2B
- B2C
Key Geographical Regions
- North America
- Europe
- Asia-Pacific
- Middle East and North Africa
- Rest of the World
DIGITAL BIOMARKERS MARKET: GROWTH AND TRENDS
Digital biomarker solutions are a combination of hardware and software features, such as sensors, and wearables, that monitor specific biomarkers in the human body that can be analyzed to generate significant insights about target indication(s). In modern healthcare, digital biomarkers help enhance diagnostic and therapeutic precision by enabling continuous monitoring and evaluation of clinically relevant health parameters. As per the report published by the United Nations, the population aged 65 years and above is projected to double reaching close to 1.5 billion in 2050. Owing to the rise in the prevalence of chronic disorders and the aging population, the overall healthcare costs are likely to be increased substantially over the coming years. Studies have shown that continuous symptom tracking with early intervention offers various benefits, such as improvement in the quality of life of patients and reduced medical management burden.
Further, the growing number of virtual and decentralized clinical studies has spurred the adoption of digital biomarkers that provide accurate, reliable and real-time health information without the need for frequent in-person visits by the patients. This trend promotes the participation of a large number of patients in clinical studies, offers a more patient-centric approach, and provides a more diverse and elaborate dataset of biomarkers. Driven by the rising adoption of remote patient monitoring solutions (specifically during chronic indications) and preference for personalized treatments, the digital biomarkers market is likely to grow at a significant pace in the foreseeable future.
DIGITAL BIOMARKERS MARKET: KEY INSIGHTS
The report delves into the current state of the digital biomarkers market and identifies potential growth opportunities within the industry. Some key findings from the report include:
- Presently, over 220 digital biomarker solutions are available / being developed by different players across the globe; of these, the majority of the solutions are data collection / analysis tools (specifically software platforms and wrist bands).
- Over 40% of digital solutions collect / analyze data related to various physiological biomarkers (such as pulse rate, heart rate and body temperature); most of these are used for real-time monitoring of adults and older adults.
- Several firms (encompassing startups as well as well-established companies), with varying resources, have been actively involved in this domain; the majority of these firms are based in North America.
- Several industry as well as non-industry players have forged strategic deals in this domain; most of the intercontinental and intracontinental partnerships have been signed by players based in North America.
- Foreseeing a lucrative potential within this domain, several firms have invested over USD 3 billion (across over 160 funding instances), since 2015; notably, majority of the funds were raised for developing imaging biomarkers.
- In the past three years, over 50 events (offline and online) have been held to discuss the ongoing innovation and clinical outcomes in the digital biomarkers' domain; further, around 55 eminent stakeholders have participated in these events.
- Since 2019, over 750 patents related to digital biomarkers have been filed / granted to various stakeholders to protect the intellectual property generated within this domain.
- The digital biomarkers market is anticipated to grow at an annualized rate (CAGR) of 18.5%, till 2035; the projected opportunity is likely to be distributed across different types of products, purposes of solutions and types of biomarkers.
DIGITAL BIOMARKERS MARKET: KEY SEGMENTS
Wearables Segment Occupies the Largest Share of the Digital Biomarkers Market
Based on the type of product, the market is segmented into software / applications, wearables, sensors and gaming solutions. At present, the wearables segment holds the maximum share of the digital biomarkers market. This can be attributed to the shifting preference of patients towards virtual consultations and telemedicine, and the growing prevalence of neurodegenerative disorders which in turn, has led to higher adoption of wearable digital biomarker solutions. It is worth highlighting that the digital biomarkers market for sensors is likely to grow at a relatively higher CAGR in the coming decade.
Monitoring Segment is Likely to Dominate the Digital Biomarkers Market During the Forecast Period
Based on the purpose of solution, the market is segmented into diagnosis, early detection, monitoring, and predictive insights. Currently, monitoring segment holds the maximum share of the digital biomarkers market. This can be attributed to the increasing prevalence of chronic disorders, which necessitates continuous tracking of health parameters of patients. It is worth noting that the digital biomarkers market for predictive insights is likely to grow at a relatively higher CAGR in the coming decade.
Physiological Biomarkers Occupy the Largest Share of the Digital Biomarkers Market
Based on the type of biomarker, the market is segmented into cognitive, idiosyncratic, physiological, vocal and other biomarkers. At present, the digital biomarker solutions that capture physiological biomarkers hold the maximum share of the digital biomarkers market. This can be attributed to high clinical validation of such biomarkers, compared to the other types of biomarkers, such as cognitive, idiosyncratic and vocal biomarkers. It is worth highlighting that the digital biomarkers market for vocal digital biomarkers is likely to grow at a relatively higher CAGR in the coming decade.
Neurological Disorders Account for the Largest Share of the Digital Biomarkers Market
Based on the therapeutic areas, the market is segmented into autoimmune disorders, cardiovascular disorders, infectious diseases, mental health disorders, neurological disorders, respiratory disorders, substance abuse disorders and other disorders. While neurological disorders account for a relatively higher market share, it is worth highlighting that the autoimmune disorders and substance abuse disorders segment is expected to witness substantial market growth in the coming years.
B2C Business Model Occupies the Largest Share of the Digital Biomarkers Market
Based on the business model, the market is segmented into B2B and B2C. At present, majority of the revenue is generated through the B2C business model. However, this trend is likely to evolve during the forecasted period, as developers are increasingly adopting B2B business models in order to maintain sustained growth.
North America Accounts for the Largest Share of the Market
Based on key geographical regions, the market is segmented into North America, Europe, Asia-Pacific, Middle East and North Africa, and Rest of the world. The majority share is expected to be captured by players based in North America. It is worth highlighting that, over the years, the market in Asia-Pacific is expected to grow at a higher CAGR.
Example Players in the Digital Biomarkers Market
- Acculi Labs
- ActiGraph
- AliveCor
- ATCOR
- BACtrack
- Biogen
- BioSerenity
- BioSensics
- Eyenuk
- Empatica
- Feel Therapeutics
- icometrix
- iMediSync
- IXICO
- Kinsa
- Koneksa Health
- Kontigo Care
- Progentec Diagnostics
- Quibim
- Vocalis Health
Primary Research Overview
The opinions and insights presented in this study were influenced by discussions conducted with multiple stakeholders. The research report features detailed transcripts of interviews held with the following industry stakeholders:
- Founder and Chief Executive Officer, Small Company, India
- Co-founder and Chief Executive Officer, Small Company, France
- Business Development Manager, Mid-sized Company, UK
- Former Chief Commercial Officer, Small Company, Israel
DIGITAL BIOMARKERS MARKET: RESEARCH COVERAGE
- Market Sizing and Opportunity Analysis: The report features an in-depth analysis of the digital biomarkers market, focusing on key market segments, including [A] type of product, [B] purpose of solution, [C] type of biomarker, [D] therapeutic area, [E] business model and [F] key geographical regions.
- Market Landscape: A comprehensive evaluation of digital biomarker solutions, considering various parameters, such as [A] type of product, [B] type of digital biomarker solution, [C] type of biomarker, [D] status of development, [E] purpose of biomarker, [F] target therapeutic area, [G] target population, [H] type of end-user, [I] clinical validation of biomarker solution and [J] AI integration within biomarker solution. In addition, the chapter includes a detailed analysis of digital biomarkers developers, along with information on their [K] year of establishment, [L] company size (in terms of employee count), [M] location of headquarters, [N] type of business model and [O] most active players (in terms of number of digital biomarker solutions offered).
- Product Competitiveness Analysis: A comprehensive competitive analysis of digital biomarker solutions, examining factors, such as developer strength, product competitiveness and status of development.
- Company Profiles: In-depth profiles of key digital biomarkers developers, focusing on [A] company overviews, [B] financial information (if available), [C] digital biomarker portfolio, [D] recent developments and [D] an informed future outlook.
- Partnerships and Collaborations: An analysis of partnerships established in this sector based on several parameters, such as [A] year of partnership, [B] type of partnership, [C] type of biomarker, [D] target therapeutic area, [E] type of partner and [F] most active players (in terms of the number of partnerships signed). This section also highlights the regional distribution of partnership activity in this market.
- Funding and Investment Analysis: A detailed evaluation of the investments made in this domain based on several parameters, such as [A] year of funding, [B] type of funding, [C] amount invested (USD million), [D] type of biomarker, [E] therapeutic area, [F] most active players (in terms of number of funding instances and amount raised), [G] most active investors (in terms of number of funding instances) and [H] regional distribution of funding.
- Global Events Analysis: A detailed analysis of global events attended by the companies in the digital biomarkers industry, based on relevant parameters such as year of event, type of event, event platform, event organizer, location of event, and most active players, speakers and designations (in terms of number of events).
- Patent Analysis: Detailed analysis of various patents filed / granted related to digital biomarkers based on [A] type of patent (granted patents, patent applications and others), [B] publication year, [C] application year, [D] patent jurisdiction, [E] cooperative patent classification (CPC) symbols, [F] type of applicant and [G] most active players (in terms of the number of patents filed / granted). It also includes a patent benchmarking analysis and a detailed valuation analysis.
- Big Pharma Analysis: A comprehensive examination of various initiatives focused on digital biomarkers undertaken by major pharmaceutical companies. This analysis various initiatives, such as number of clinical trials, number of collaborations, number of conferences attended, number of funding instances, and number of publications.
- Market Impact Analysis: The report analyzes various factors such as drivers, restraints, opportunities, and challenges affecting market growth.
KEY QUESTIONS ANSWERED IN THIS REPORT
- How many companies are currently engaged in this market?
- Which are the leading companies in this market?
- What kind of partnership models are commonly adopted by industry stakeholders?
- How much investment has been made by industry stakeholders in recent years?
- What factors are likely to influence the evolution of this market?
- What is the current and future market size?
- What is the CAGR of this market?
- How is the current and future market opportunity likely to be distributed across key market segments?
REASONS TO BUY THIS REPORT
- The report provides a comprehensive market analysis, offering detailed revenue projections of the overall market and its specific sub-segments. This information is valuable to both established market leaders and emerging entrants.
- Stakeholders can leverage the report to gain a deeper understanding of the competitive dynamics within the market. By analyzing the competitive landscape, businesses can make informed decisions to optimize their market positioning and develop effective go-to-market strategies.
- The report offers stakeholders a comprehensive overview of the market, including key drivers, barriers, opportunities, and challenges. This information empowers stakeholders to stay abreast of market trends and make data-driven decisions to capitalize on growth prospects.
ADDITIONAL BENEFITS
- Complimentary PPT Insights Packs
- Complimentary Excel Data Packs for all Analytical Modules in the Report
- 10% Free Content Customization
- Detailed Report Walkthrough Session with Research Team
- Free Updated report if the report is 6-12 months old or older
TABLE OF CONTENTS
1. PREFACE
- 1.1. Digital Biomarker Solutions Market
- 1.2. Market Share Insights
- 1.3. Key Market Insights
- 1.4. Report Coverage
- 1.5. Key Questions Answered
- 1.6. Chapter Outlines
2. RESEARCH METHODOLOGY
- 2.1 Chapter Overview
- 2.2. Research Assumptions
- 2.3. Project Methodology
- 2.4. Forecast Methodology
- 2.5. Robust Quality Control
- 2.6. Key Market Segmentation
- 2.7. Key Considerations
- 2.7.1. Demographics
- 2.7.2. Economic Factors
- 2.7.3. Government Regulations
- 2.7.4. Supply Chain
- 2.7.5. COVID Impact
- 2.7.6. Market Access
- 2.7.7. Healthcare Policies
- 2.7.8. Industry Consolidation
3.ECONOMIC AND OTHER PROJECT SPECIFIC CONSIDERATIONS
- 3.1. Chapter Overview
- 3.2. Market Dynamics
- 3.2.1. Time Period
- 3.2.1.1. Historical Trends
- 3.2.1.2. Current and Future Estimates
- 3.2.2. Currency Coverage and Foreign Exchange Rate
- 3.2.2.1. Major Currencies Affecting the Market
- 3.2.2.2. Factors Affecting Currency Fluctuations and Foreign Exchange Rates
- 3.2.2.3. Impact of Foreign Exchange Rate Volatility on the Market
- 3.2.2.4. Strategies for Mitigating Foreign Exchange Risk
- 3.2.3. Trade Policies
- 3.2.3.1. Impact of Trade Barriers on the Market
- 3.2.3.2. Strategies for Mitigating the Risks Associated with Trade Barriers
- 3.2.4. Recession
- 3.2.4.1. Historical Analysis of Past Recessions and Lessons Learnt
- 3.2.4.2. Assessment of Current Economic Conditions and Potential Impact on the Market
- 3.2.5. Inflation
- 3.2.5.1. Measurement and Analysis of Inflationary Pressures in the Economy
- 3.2.5.2. Potential Impact of Inflation on the Market Evolution
- 3.2.1. Time Period
4. EXECUTIVE SUMMARY
5. INTRODUCTION
- 5.1 Chapter Overview
- 5.2. Overview of Digital Biomarkers
- 5.2.1. Classification of Digital Biomarkers
- 5.2.2. Types of Biological Signals Captured by Digital Biomarker Solutions
- 5.2.3. Key Advantages and Limitations
- 5.3. Product Development and Commercialization Path for Digital Biomarker Solutions
- 5.3.1. Discovery
- 5.3.2. Validations and Submissions
- 5.3.3. Distribution and Marketing
- 5.4. Recent Advancements related to Digital Biomarker Solutions
- 5.5. Impact of COVID-19 Pandemic on the Digital Biomarkers Domain
- 5.6. Prevalent Trends Related to Digital Biomarker Solutions
- 5.6.1. Emerging Focus Areas
6. MARKET LANDSCAPE
- 6.1. Chapter Overview
- 6.2. Digital Biomarker Solutions: Overall Market Landscape
- 6.2.1. Analysis by Type of Product
- 6.2.2. Analysis by Type of Digital Biomarker Solution
- 6.2.3. Analysis by Type of Biomarker
- 6.2.4. Analysis by Status of Development
- 6.2.5. Analysis by Type of Biomarker and Status of Development
- 6.2.6. Analysis by Purpose of Digital Biomarker Solution
- 6.2.7. Analysis by Target Therapeutic Area
- 6.2.8. Analysis by Type of Biomarker and Target Therapeutic Area
- 6.2.9. Analysis by Target Population
- 6.2.10. Analysis by End-user
- 6.2.11. Analysis by Availability of Clinical Validation
- 6.2.12. Analysis by Availability of Clinical Validates Solutions by Target Therapeutic Area
- 6.2.13. Analysis by Availability of AI Integration
- 6.3. Digital Biomarker Solutions: Developer Landscape
- 6.3.1. Analysis by Year of Establishment
- 6.3.2. Analysis by Company Size
- 6.3.3. Analysis by Location of Headquarters
- 6.3.4. Analysis by Company Size and Location of Headquarters
- 6.3.5. Most Active Players: Analysis by Number of Digital Biomarker Solutions Developed
7. PRODUCT COMPETITIVENESS ANALYSIS
- 7.1. Chapter Overview
- 7.2. Assumptions and Key Parameters
- 7.3. Methodology
- 7.4. Digital Biomarker Solutions: Product Competitiveness Analysis
- 7.4.1. Digital Biomarker Solutions Developed by Players based in North America
- 7.4.2. Digital Biomarker Solutions Developed by Players based in Europe
- 7.4.3. Digital Biomarker Solutions Developed by Players based in Asia-Pacific and Rest of the World
8. COMPANY PROFILES: DIGITAL BIOMARKER SOLUTIONS DEVELOPERS
- 8.1. Chapter Overview
- 8.2. Detailed Company Profiles of Leading Digital Biomarker Solutions Developers
- 8.2.1. BioSensics
- 8.2.1.1. Company Overview
- 8.2.1.2. Digital Biomarker Solutions Portfolio
- 8.2.1.3. Recent Developments and Future Outlook
- 8.2.2. AliveCor
- 8.2.2.1. Company Overview
- 8.2.2.2. Digital Biomarker Solutions Portfolio
- 8.2.2.3. Recent Developments and Future Outlook
- 8.2.3. BACtrack
- 8.2.3.1. Company Overview
- 8.2.3.2. Digital Biomarker Solutions Portfolio
- 8.2.3.3. Recent Developments and Future Outlook
- 8.2.4. Eyenuk
- 8.2.4.1. Company Overview
- 8.2.4.2. Digital Biomarker Solutions Portfolio
- 8.2.4.3. Recent Developments and Future Outlook
- 8.2.5. Quibim
- 8.2.5.1. Company Overview
- 8.2.5.2. Digital Biomarker Solutions Portfolio
- 8.2.5.3. Recent Developments and Future Outlook
- 8.2.6. Feel Therapeutics
- 8.2.6.1. Company Overview
- 8.2.6.2. Digital Biomarker Solutions Portfolio
- 8.2.6.3. Recent Developments and Future Outlook
- 8.2.7. Empatica
- 8.2.7.1. Company Overview
- 8.2.7.2. Digital Biomarker Solutions Portfolio
- 8.2.7.3. Recent Developments and Future Outlook
- 8.2.8. icometrix
- 8.2.8.1. Company Overview
- 8.2.8.2. Digital Biomarker Solutions Portfolio
- 8.2.8.3. Recent Developments and Future Outlook
- 8.2.9. Biogen
- 8.2.9.1. Company Overview
- 8.2.9.2. Digital Biomarker Solutions Portfolio
- 8.2.9.3. Recent Developments and Future Outlook
- 8.2.1. BioSensics
- 8.3. Short Company Profiles of Other Prominent Developers
- 8.3.1. Acculi Labs
- 8.3.1.1. Company Overview
- 8.3.1.2. Product Portfolio: Digital Biomarker Solutions
- 8.3.2. IXICO
- 8.3.2.1. Company Overview
- 8.3.2.2. Product Portfolio: Digital Biomarker Solutions
- 8.3.3. Kinsa
- 8.3.3.1. Company Overview
- 8.3.3.2. Product Portfolio: Digital Biomarker Solutions
- 8.3.4. Progentec Diagnostics
- 8.3.4.1. Company Overview
- 8.3.4.2. Product Portfolio: Digital Biomarker Solutions
- 8.3.5. Vocalis Health
- 8.3.5.1. Company Overview
- 8.3.5.2. Product Portfolio: Digital Biomarker Solutions
- 8.3.6. Kontigo Care
- 8.3.6.1. Company Overview
- 8.3.6.2. Product Portfolio: Digital Biomarker Solutions
- 8.3.7. Koneksa Health
- 8.3.7.1. Company Overview
- 8.3.7.2. Product Portfolio: Digital Biomarker Solutions
- 8.3.8. ActiGraph
- 8.3.8.1. Company Overview
- 8.3.8.2. Product Portfolio: Digital Biomarker Solutions
- 8.3.9. BioSerenity
- 8.3.9.1. Company Overview
- 8.3.9.2. Product Portfolio: Digital Biomarker Solutions
- 8.3.10. ATCOR
- 8.3.10.1. Company Overview
- 8.3.10.2. Product Portfolio: Digital Biomarker Solutions
- 8.3.11. iMediSync
- 8.3.11.1. Company Overview
- 8.3.11.2. Product Portfolio: Digital Biomarker Solutions
- 8.3.1. Acculi Labs
9. PARTNERSHIPS AND COLLABORATIONS
- 9.1. Chapter Overview
- 9.2. Partnership Models
- 9.3. Digital Biomarker Solutions: Partnerships and Collaborations
- 9.3.1. Analysis by Year of Partnership
- 9.3.2. Analysis by Type of Partnership
- 9.3.3. Analysis by Year and Type of Partnership
- 9.3.4. Analysis by Type of Biomarker
- 9.3.5. Analysis by Type of Partnership and Type of Biomarker
- 9.3.6. Analysis by Therapeutic Area
- 9.3.7. Analysis of Type of Partnership and Therapeutic Area
- 9.3.8. Analysis by Type of Partner
- 9.3.9. Most Active Players: Analysis by Number of Partnerships
- 9.3.10. Analysis by Geography
- 9.3.10.1. Intracontinental and Intercontinental Deals
- 9.3.10.2. International and Local Deals
10. FUNDING AND INVESTMENTS
- 10.1. Chapter Overview
- 10.2. Funding Models
- 10.3. Digital Biomarker Solutions: Funding and Investments
- 10.3.1. Analysis by Year of Investment
- 10.3.2. Analysis by Amount Invested
- 10.3.3. Analysis of Funding Instances by Type of Funding
- 10.3.4. Analysis of Amount Invested by Type of Funding
- 10.3.5. Analysis of Funding Instances by Type of Biomarker
- 10.3.6. Analysis of Funding Instances and Amount Invested by Therapeutic Area
- 10.3.7. Leading Investors: Distribution by Number of Funding Instances
- 10.3.8. Most Active Players: Distribution by Number of Funding Instances
- 10.3.9. Most Active Players: Analysis by Amount Raised
- 10.3.10. Most Active Players: Analysis by Geography
11. GLOBAL EVENTS ANALYSIS
- 11.1. Chapter Overview
- 11.2. Scope and Methodology
- 11.3. Digital Biomarker Solutions: Global Events Analysis
- 11.3.1. Analysis by Year of Event
- 11.3.2. Analysis by Type of Event
- 11.3.3. Analysis by Year and Type of Event
- 11.3.4. Analysis by Event Platform
- 11.3.5. Analysis by Location of Event
- 11.3.6. Word Cloud Analysis: Key Focus Areas
- 11.3.7. Most Active Event Organizers: Analysis by Number of Events
- 11.3.8. Most Active Players: Analysis by Number of Events
- 11.4. Global Events: Speaker Analysis
- 11.4.1. Most Active Speakers: Analysis by Number of Events
- 11.4.2. Analysis by Designation / Qualification of Speakers
- 11.5. List of Upcoming Global Events
- 11.6. Concluding Remarks
12. PATENT ANALYSIS
- 12.1. Chapter Overview
- 12.2. Scope and Methodology
- 12.3. Digital Biomarker Solutions: Patent Analysis
- 12.3.1. Analysis by Patent Application Year
- 12.3.2. Analysis by Patent Publication Year
- 12.3.3. Analysis by Type of Patent and Patent Publication Year
- 12.3.4. Analysis by Patent Jurisdiction
- 12.3.5. Analysis by CPC Symbols
- 12.3.6. Analysis by Patent Publication Year and Type of Applicant
- 12.3.7. Leading Players: Analysis by Number of Patents
- 12.3.8. Leading Patent Assignees: Analysis by Number of Patents
- 12.4. Patent Benchmarking Analysis
- 12.4.1. Analysis By Patent Characteristics
- 12.5. Patent Valuation
- 12.6. Leading Patents by Number of Citations
13. BIG PHARMA INITIATIVES
- 13.1. Chapter Overview
- 13.2. Methodology and Key Parameters
- 13.3. Big Pharma Initiatives Related to Digital Biomarker Solutions
- 13.3.1. Analysis by Type of Initiatives
- 13.3.2. Heat Map Analysis
- 13.4. Big Pharma Players: Benchmark Analysis
- 13.4.1. Spider Web Analysis: AbbVie
- 13.4.2. Spider Web Analysis: Amgen
- 13.4.3. Spider Web Analysis: AstraZeneca
- 13.4.4. Spider Web Analysis: Bayer
- 13.4.5. Spider Web Analysis: Bristol Myers Squibb
- 13.4.6. Spider Web Analysis: Eli Lilly
- 13.4.7. Spider Web Analysis: GlaxoSmithKline
- 13.4.8. Spider Web Analysis: Johnson & Johnson
- 13.4.9. Spider Web Analysis: Merck
- 13.4.10. Spider Web Analysis: Novartis
- 13.4.11. Spider Web Analysis: Pfizer
- 13.4.12. Spider Web Analysis: Roche
- 13.4.13. Spider Web Analysis: Sanofi
- 13.4.14. Spider Web Analysis: Takeda Pharmaceuticals
- 13.5. Most Active Players: Distribution by Number of Initiatives
14. MARKET IMPACT ANALYSIS: DRIVERS, RESTRAINTS, OPPORTUNITIES AND CHALLENGES
- 14.1. Chapter Overview
- 14.2. Market Drivers
- 14.3. Market Restraints
- 14.4. Market Opportunities
- 14.5. Market Challenges
- 14.6. Conclusion
15. GLOBAL DIGITAL BIOMARKER SOLUTIONS MARKET
- 15.1. Chapter Overview
- 15.2. Assumptions and Methodology
- 15.3. Global Digital Biomarker Solutions Market, Historical Trends (since 2018) and Future
Estimates (till 2035)
- 15.3.1. Scenario Analysis
- 15.3.1.1. Conversative Scenario
- 15.3.1.2. Optimistic Scenario
- 15.4. Key Market Segmentation
16. DIGITAL BIOMARKER SOLUTIONS MARKET, BY TYPE OF PRODUCT
- 16.1. Chapter Overview
- 16.2. Assumptions and Methodology
- 16.3. Digital Biomarker Solutions Market: Distribution by Type of Product, 2018, 2024 and 2035
- 16.3.1. Digital Biomarker Solutions Market for Software / Applications: Historical Trends (since 2018) and Future Estimates (till 2035)
- 16.3.2. Digital Biomarker Solutions Market for Wearables: Historical Trends Historical Trends (since 2018) and Future
Estimates (till 2035)
- 16.3.3. Digital Biomarker Solutions Market for Sensors: Historical Trends (since 2018) and Future
Estimates (till 2035)
- 16.3.4. Digital Biomarker Solutions Market for Gaming Solutions: Historical Trends (since 2018) and Future
Estimates (till 2035)
- 16.4. Data Triangulation and Validation
17. DIGITAL BIOMARKER SOLUTIONS MARKET, BY PURPOSE OF SOLUTION
- 17.1. Chapter Overview
- 17.2. Assumptions and Methodology
- 17.3. Digital Biomarker Solutions Market: Distribution by Purpose of Solution, 2018, 2024 and 2035
- 17.3.1. Digital Biomarker Solutions Market for Monitoring: Historical Trends (since 2018) and Future Estimates (till 2035)
- 17.3.2. Digital Biomarker Solutions Market for Diagnosis: Historical Trends (since 2018) and Future Estimates (till 2035)
- 17.3.3. Digital Biomarker Solutions Market for Early Detection: Historical Trends (since 2018) and Future Estimates (till 2035)
- 17.3.4. Digital Biomarker Solutions Market for Predictive Insights: Historical Trends (since 2018) and Future Estimates (till 2035)
- 17.4. Data Triangulation and Validation
18. DIGITAL BIOMARKER SOLUTIONS MARKET, BY TYPE OF BIOMARKER
- 18.1. Chapter Overview
- 18.2. Assumptions and Methodology
- 18.3. Digital Biomarker Solutions Market: Distribution by Type of Biomarker, 2018, 2024 and 2035
- 18.3.1. Digital Biomarker Solutions Market for Physiological Biomarkers: Historical Trends (since 2018) and Future Estimates (till 2035)
- 18.3.2. Digital Biomarker Solutions Market for Vocal Biomarkers: Historical Trends (since 2018) and Future Estimates (till 2035)
- 18.3.3. Digital Biomarker Solutions Market for Cognitive Biomarkers: Historical Trends (since 2018) and Future Estimates (till 2035)
- 18.3.4. Digital Biomarker Solutions Market for Idiosyncratic Biomarkers: Historical Trends (since 2018) and Future Estimates (till 2035)
- 18.3.5. Digital Biomarker Solutions Market for Other Biomarkers: Historical Trends (since 2018) and Future Estimates (till 2035)
- 18.4. Data Triangulation and Validation
19. DIGITAL BIOMARKER SOLUTIONS MARKET, BY THERAPEUTIC AREA
- 19.1. Chapter Overview
- 19.2. Assumptions and Methodology
- 19.3. Digital Biomarker Solutions Market: Distribution by Therapeutic Area, 2018, 2024 and 2035
- 19.3.1. Digital Biomarker Solutions Market for Neurological Disorders: Historical Trends (since 2018) and Future Estimates (till 2035)
- 19.3.2. Digital Biomarker Solutions Market for Mental Health Disorders: Historical Trends (since 2018) and Future Estimates (till 2035)
- 19.3.3. Digital Biomarker Solutions Market for Cardiovascular Disorders: Historical Trends (since 2018) and Future Estimates (till 2035)
- 19.3.4. Digital Biomarker Solutions Market for Infectious Diseases: Historical Trends (since 2018) and Future Estimates (till 2035)
- 19.3.5. Digital Biomarker Solutions Market for Respiratory Disorders: Historical Trends (since 2018) and Future Estimates (till 2035)
- 19.3.6. Digital Biomarker Solutions Market for Autoimmune Disorders: Historical Trends (since 2018) and Future Estimates (till 2035)
- 19.3.7. Digital Biomarker Solutions Market for Substance Abuse Disorders: Historical Trends (since 2018) and Future Estimates (till 2035)
- 19.3.8. Digital Biomarker Solutions Market for Other Disorders: Historical Trends (since 2018) and Future Estimates (till 2035)
- 19.4. Data Triangulation and Validation
20. DIGITAL BIOMARKER SOLUTIONS MARKET, BY BUSINESS MODEL
- 20.1. Chapter Overview
- 20.2. Assumptions and Methodology
- 20.3. Digital Biomarker Solutions Market: Distribution by Business Model, 2018, 2024 and 2035
- 20.3.1. Digital Biomarker Solutions Market for B2B Model: Historical Trends (since 2018) and Future Estimates (till 2035)
- 20.3.2. Digital Biomarker Solutions Market for B2C Model: Historical Trends (since 2018) and Future Estimates (till 2035)
- 20.4. Data Triangulation and Validation
21. DIGITAL BIOMARKER SOLUTIONS MARKET, BY KEY GEOGRAPHICAL REGIONS
- 21.1. Chapter Overview
- 21.2. Assumptions and Methodology
- 21.3. Digital Biomarker Solutions Market: Distribution by Key Geographical Regions, 2018, 2024 and 2035
- 21.3.1. Digital Biomarker Solutions Market in North America: Historical Trends (since 2018) and Future Estimates (till 2035)
- 21.3.2. Digital Biomarker Solutions Market in Europe: Historical Trends (since 2018) and Future Estimates (till 2035)
- 21.3.3. Digital Biomarker Solutions Market in Asia-Pacific: Historical Trends (since 2018) and Future Estimates (till 2035)
- 21.3.4. Digital Biomarker Solutions Market in Middle East and North Africa (MENA): Historical Trends (since 2018) and Future Estimates (till 2035)
- 21.3.5. Digital Biomarker Solutions Market in Rest of the World: Historical Trends (since 2018) and Future Estimates (till 2035)
- 21.4. Data Triangulation and Validation
22. CONCLUDING REMARKS
23. EXECUTIVE INSIGHTS
- 23.1. Chapter Overview
- 23.2. Acculi Labs
- 23.2.1. Company Snapshot
- 23.2.2. Interview Transcript: Company A, Chief Executive Officer
- 23.3. IXICO
- 23.3.1. Company Snapshot
- 23.3.2. Interview Transcript: Company B, Business Development Manager
- 23.4. Tilak Healthcare
- 23.4.1. Company Snapshot
- 23.4.2. Interview Transcript: Company C, Co-Founder and Chief Executive Officer
- 23.5. Vocalis Health
- 23.5.1. Company Snapshot
- 23.5.2. Interview Transcript: , Company D, Former Chief Commercial Officer
