
|
市場調査レポート
商品コード
1624832
ペプチド合成の世界市場:ペプチド合成法タイプ別、化学合成タイプ別、受託製造機関規模別、主要地域別:2035年までの業界動向と世界の予測Peptide Synthesis Market by Type of Peptide Synthesis Method, Type of Chemical Synthesis, Contract Manufacturing Organization Size, Key Geographical Regions : Industry Trends and Global Forecasts, Till 2035 |
||||||
カスタマイズ可能
|
|||||||
| ペプチド合成の世界市場:ペプチド合成法タイプ別、化学合成タイプ別、受託製造機関規模別、主要地域別:2035年までの業界動向と世界の予測 |
|
出版日: 2025年01月06日
発行: Roots Analysis
ページ情報: 英文 390 Pages
納期: 即日から翌営業日
|

全表示
- 概要
- 図表
- 目次
世界のペプチド合成の市場規模は、2035年までの予測期間中に5.5%のCAGRで拡大し、現在の28億米ドルから2035年までに51億米ドルに成長すると予測されています。
代謝安定性の向上、高い親和性、生物学的標的特異性により、ペプチド治療薬はここ数年、有望な手段として浮上してきました。80を超えるペプチド・プログラムが、世界中の様々な規制当局によって承認されていることは注目に値します。加えて、現在630以上の臨床試験が、広範な疾患の治療のためにいくつかのペプチド治療薬を評価しています。このことは、この領域でさまざまな利害関係者が広範な開発努力を行っていることを示しています。しかし、ペプチド合成にはいくつかの課題があるため、製薬会社やバイオテクノロジー企業は主要な業務を外注するようになっています。現在、75以上の業界企業が、製剤開発、大量生産、分析/規制サポート、プロセス開発、バリデーションバッチ、パッケージングとラベリング、プレフォーミュレーション、カスタムペプチド合成など、幅広いペプチド合成サービスを提供しています。
医薬品開発企業がこうした革新的な治療法により多くの投資を行っていることから、ペプチド合成市場はさらに拡大すると予想されます。さらに、健全な初期段階のパイプラインにより、この領域の成長は長期的にも続くと予想されます。
当レポートでは、世界のペプチド合成市場について調査し、市場の概要とともに、ペプチド合成法タイプ別、化学合成タイプ別、受託製造機関規模別、地域別の動向、および市場に参入する企業のプロファイルなどを提供しています。
目次
第1章 序文
第2章 調査手法
第3章 経済およびその他のプロジェクト特有の考慮事項
第4章 エグゼクティブサマリー
第5章 イントロダクション
第6章 規制状況
- 章の概要
- 規制シナリオ:北米
- 規制シナリオ:欧州
- 規制シナリオ:アジア太平洋
- ペプチド製造に伴う課題
第7章 市場情勢
第8章 企業競争力分析
第9章 企業プロファイル
第10章 最近の動向と取り組み
第11章 臨床試験の分析
第12章 地域別能力分析
第13章 需要分析
第14章 容量分析
第15章 パートナー候補分析
第16章 製造か購入かの意思意思決定の枠組み
第17章 ペプチド受託製造組織の総所有コスト
第18章 世界のペプチド治療薬受託API製造市場
第19章 ペプチド治療薬受託API製造市場、ペプチド合成法別
第20章 ペプチド治療薬受託API製造市場、企業規模別
第21章 ペプチド治療薬受託API製造市場、地域別
第22章 SWOT分析
第23章 結論
第24章 エグゼクティブ洞察
- 章の概要
- Ascendia Pharmaceuticals
- Almac
- NUMAFERM
- Sekisui XenoTech
- Previtalica
第25章 付録I:表形式データ
第26章 付録II:企業および団体一覧
List of Tables
- Table 5.1 Comparison of Major Peptide Synthesizing Processes
- Table 5.2 Chromatographic Techniques
- Table 6.1 Comparison of Regulatory Landscape of China and India
- Table 7.1 Peptide Therapeutics Contract API Manufacturers: List of Companies
- Table 7.2 Peptide Therapeutics Contract API Manufacturers: Information on Type of API and Scale of Operation
- Table 7.3 Peptide Therapeutics Contract API Manufacturers: Information on Type of Services Offered and Peptide Synthesis Method
- Table 7.4 Peptide Therapeutics Contract API Manufacturers: Information on Type of Peptide Modification and Type of Purification Technology Used
- Table 7.5 Peptide Therapeutics Contract API Manufacturers: Information on Regulatory Certifications and Accreditations
- Table 7.6 List of Custom Peptide Manufacturers
- Table 8.1 Company Competitiveness Analysis: Peptide Therapeutics Contract API Manufacturers with Low Manufacturing Capacity
- Table 8.2 Company Competitiveness Analysis: Peptide Therapeutics Contract API Manufacturers with Medium Manufacturing Capacity
- Table 8.3 Company Competitiveness Analysis: Peptide Therapeutics Contract API Manufacturers with High Manufacturing Capacity
- Table 9.1 Leading Peptide Therapeutics Contract API Manufacturers
- Table 9.2 AmbioPharm: Company Overview
- Table 9.3 AmbioPharm: Overview of Manufacturing Capabilities
- Table 9.4 AmbioPharm: Recent Developments and Future Outlook
- Table 9.5 CPC Scientific: Company Overview
- Table 9.6 CPC Scientific: Overview of Manufacturing Capabilities
- Table 9.7 CPC Scientific: Recent Developments and Future Outlook
- Table 9.8 Creative Peptides: Company Overview
- Table 9.9 Creative Peptides: Overview of Manufacturing Capabilities
- Table 9.10 Creative Peptides: Recent Developments and Future Outlook
- Table 9.11 CSBio: Company Overview
- Table 9.12 CSBio: Overview of Manufacturing Capabilities
- Table 9.13 CSBio: Recent Developments and Future Outlook
- Table 9.14 Bachem: Company Overview
- Table 9.15 Bachem: Overview of Manufacturing Capabilities
- Table 9.16 Bachem: Recent Developments and Future Outlook
- Table 9.17 BCN Peptides: Company Overview
- Table 9.18 BCN Peptides: Overview of Manufacturing Capabilities
- Table 9.19 BCN Peptides: Recent Developments and Future Outlook
- Table 9.20 CordenPharma: Company Overview
- Table 9.21 CordenPharma: Overview of Manufacturing Capabilities
- Table 9.22 CordenPharma: Recent Developments and Future Outlook
- Table 9.23 PolyPeptide: Company Overview
- Table 9.24 PolyPeptide: Overview of Manufacturing Capabilities
- Table 9.25 PolyPeptide: Recent Developments and Future Outlook
- Table 9.26 Senn Chemicals: Company Overview
- Table 9.27 Senn Chemicals: Overview of Manufacturing Capabilities
- Table 9.28 Auspep: Company Overview
- Table 9.29 Auspep: Overview of Manufacturing Capabilities
- Table 9.30 Auspep: Recent Developments and Future Outlook
- Table 9.31 Chinese Peptide: Company Overview
- Table 9.32 Chinese Peptide: Overview of Manufacturing Capabilities
- Table 9.33 Hybio Pharmaceuticals: Company Overview
- Table 9.34 Hybio Pharmaceuticals: Overview of Manufacturing Capabilities
- Table 9.35 Peptide Institute: Company Overview
- Table 9.36 Peptide Institute: Overview of Manufacturing Capabilities
- Table 9.37 ScinoPharm: Company Overview
- Table 9.38 ScinoPharm: Overview of Manufacturing Capabilities
- Table 10.1 Peptide Therapeutics Contract API Manufacturers: List of Partnerships and Collaborations
- Table 10.2 Partnerships and Collaborations: Information on Type of Agreement (Country-wise and Region-wise)
- Table 10.3 Peptide Therapeutics Contract API Manufacturers: List of Recent Expansions
- Table 10.4 Peptide Therapeutics Contract API Manufacturers: List of Planned Upcoming Expansions
- Table 14.1 Peptide Therapeutics Contract API Manufacturers: Information on Total Installed Capacity (Sample Dataset)
- Table 14.2 Peptide Therapeutics Contract API Manufacturing: Average Capacity based on Company Size (Sample Dataset)
- Table 14.3 Peptide Therapeutics Contract API Manufacturing Capacity: Average Share Based on Synthesis Method (Sample Dataset)
- Table 14.4 Global Installed Peptide Therapeutics Contract API Manufacturing Capacity: Distribution by Company Size (liters)
- Table 15.1 Most Likely Partner Opportunities for Peptide Therapeutics Contract Manufacturers Based in North America
- Table 15.2 Likely Partner Opportunities for Peptide Therapeutics Contract Manufacturers Based in North America
- Table 15.3 Least Likely Partner Opportunities for Peptide Therapeutics Contract Manufacturers Based in North America
- Table 15.4 Most Likely Partner Opportunities for Peptide Therapeutics Contract Manufacturers Based in Europe
- Table 15.5 Likely Partner Opportunities for Peptide Therapeutics Contract Manufacturers Based in Europe
- Table 15.6 Least Likely Partner Opportunities for Peptide Therapeutics Contract Manufacturers Based in Europe
- Table 15.7 Most Likely Partner Opportunities for Peptide Therapeutics Contract Manufacturers Based in Asia Pacific and Rest of the World
- Table 15.8 Likely Partner Opportunities for Peptide Therapeutics Contract Manufacturers Based in Asia Pacific and Rest of the World
- Table 15.9 Least Likely Partner Opportunities for Peptide Therapeutics Contract Manufacturers Based in Asia Pacific and Rest of the World
- Table 24.1 Ascendia Pharmaceuticals: Company Snapshot
- Table 24.2 Almac: Company Snapshot
- Table 24.3 NUMAFERM: Company Snapshot
- Table 24.4 Sekisui: Company Snapshot
- Table 24.5 Previtalica: Company Snapshot
- Table 25.1 Peptide Therapeutics Contract API Manufacturers: Distribution by Year of Establishment
- Table 25.2 Peptide Therapeutics Contract API Manufacturers: Distribution by Year of Entrance
- Table 25.3 Peptide Therapeutics Contract API Manufacturers: Distribution by Company Size
- Table 25.4 Peptide Therapeutics Contract API Manufacturers: Distribution by Location of Headquarters
- Table 25.5 Peptide Therapeutics Contract API Manufacturers: Distribution by Type of Product
- Table 25.6 Peptide Therapeutics Contract API Manufacturers: Distribution by Type of API Manufactured
- Table 25.7 Peptide Therapeutics Contract API Manufacturers: Distribution by Scale of Operation
- Table 25.8 Peptide Therapeutics Contract API Manufacturers: Distribution by Type of Service Offered
- Table 25.9 Peptide Therapeutics Contract API Manufacturers: Distribution by Peptide Synthesis Method
- Table 25.10 Peptide Therapeutics Contract API Manufacturers: Distribution by Chemical Synthesis Method
- Table 25.11 Peptide Therapeutics Contract API Manufacturers: Distribution by Type of Peptide Modification
- Table 25.12 Peptide Therapeutics Contract API Manufacturers: Distribution by Type of Purification Technology Used
- Table 25.13 Peptide Therapeutics Contract API Manufacturers: Distribution by Regulatory Certifications and Accreditations
- Table 25.14 Peptide Therapeutics Contract API Manufacturers: Distribution by Geographical Presence (Region)
- Table 25.15 Peptide Therapeutics Contract API Manufacturers: Distribution by Location of Peptide API Manufacturing Facilities (Region)
- Table 25.16 Peptide Therapeutics Contract API Manufacturers: Distribution by Location of Peptide API Manufacturing Facilities (Country)
- Table 25.17 Partnerships and Collaborations: Cumulative Year-wise Trend
- Table 25.18 Partnerships and Collaborations: Distribution by Type of Partnership
- Table 25.19 Partnerships and Collaborations: Distribution by Year and Type of Partnership
- Table 25.20 Partnerships and Collaborations: Distribution by Company Size and Type of Partnership
- Table 25.21 Partnerships and Collaborations: Distribution by Scale of Operation
- Table 25.22 Partnerships and Collaborations: Distribution by Scale of Operation and Type of Partnership
- Table 25.23 Partnerships and Collaborations: Distribution by Green Chemistry Integration\
- Table 25.24 Most Active Players: Distribution by Number of Partnerships
- Table 25.25 Partnerships and Collaborations: Intercontinental and Intracontinental Agreements
- Table 25.26 Partnerships and Collaborations: Local and International Agreements
- Table 25.27 Recent Expansions: Cumulative Year-wise Trend of Recent Expansions
- Table 25.28 Recent Expansions: Distribution by Type of Expansion
- Table 25.29 Recent Expansions: Distribution by Year and Type of Expansion
- Table 25.30 Recent Expansions: Distribution by Location of Expanded Facility (Region)
- Table 25.31 Recent Expansions: Distribution by Location of Expanded Facility (Country)
- Table 25.32 Recent Expansions: Distribution by Location of Expanded Facility and Type of Expansion
- Table 25.33 Most Active Players: Distribution by Number of Expansions
- Table 25.34 Recent Expansions: Distribution by Geography (Country)
- Table 25.35 Clinical Trial Analysis: Cumulative Distribution by Trial Registration Year
- Table 25.36 Clinical Trial Analysis: Year-wise Trend of Number of Patients Enrolled by Trial Registration Year
- Table 25.37 Clinical Trial Analysis: Distribution by Trial Phase
- Table 25.38 Clinical Trial Analysis: Distribution by Trial Phase and Number of Patients Enrolled
- Table 25.39 Clinical Trial Analysis: Distribution by Trial Status
- Table 25.40 Clinical Trial Analysis: Distribution by Trial Registration Year and Trial Status
- Table 25.41 Clinical Trial Analysis: Distribution by Therapeutic Area
- Table 25.42 Clinical Trial Analysis: Distribution by Mechanism of Action
- Table 25.43 Clinical Trial Analysis: Distribution by Trial Registration Year and Mechanism of Action
- Table 25.44 Clinical Trial Analysis: Distribution by Type of Sponsor / Collaborator
- Table 25.45 Clinical Trial Analysis: Distribution by Type of Patient Allocation Model Used
- Table 25.46 Clinical Trial Analysis: Distribution by Type of Trial Masking Adopted
- Table 25.47 Clinical Trial Analysis: Distribution by Type of Intervention Model
- Table 25.48 Clinical Trial Analysis: Distribution by Trial Purpose
- Table 25.49 Most Active Industry Players: Distribution by Number of Clinical Trials
- Table 25.50 Most Active Non-industry Players: Distribution by Number of Clinical Trials
- Table 25.51 Clinical Trial Analysis: Distribution of Clinical Trials by Geography
- Table 25.52 Clinical Trial Analysis: Distribution of Clinical Trials by Geography and Trial Status
- Table 25.53 Clinical Trial Analysis: Distribution by Geography and Therapeutic Area
- Table 25.54 Clinical Trial Analysis: Distribution of Patients Enrolled by Geography
- Table 25.55 Clinical Trial Analysis: Distribution of Patients Enrolled by Geography and Trial Status
- Table 25.56 Regional Distribution of Peptide Therapeutics Contract API Manufacturing Facilities
- Table 25.57 Regional Capability Analysis: Regional Capability Analysis: Peptide API Contract Manufacturers in North America
- Table 25.58 Regional Capability Analysis: Regional Capability Analysis: Peptide API Contract Manufacturers in Europe
- Table 25.59 Regional Capability Analysis: Peptide API Contract Manufacturers in Asia Pacific and Rest of the World
- Table 25.60 Global Demand for Peptide Therapeutics Contract API Manufacturing, Historical Trends (since 2017) and Forecasted Estimates (till 2035) (Kilograms)
- Table 25.61 Global Clinical Demand for Peptide Therapeutics Contract API Manufacturing, Historical Trends (since 2017) and Future Estimates (till 2035) (Kilograms)
- Table 25.62 Clinical Demand for Peptide Therapeutics Contract API Manufacturing: Distribution by Phase of Development, 2024 and 2035
- Table 25.63 Clinical Demand for Peptide Therapeutics Contract API Manufacturing for Phase I Trials, till 2035 (Kilograms)
- Table 25.64 Clinical Demand for Peptide Therapeutics Contract API Manufacturing for Phase II Trials, till 2035 (Kilograms)
- Table 25.65 Clinical Demand for Peptide Therapeutics Contract API Manufacturing for Phase III Trials, till 2035 (Kilograms)
- Table 25.66 Global Commercial Demand for Peptide Therapeutics Contract API Manufacturing, Historical Trends (since 2017) and Forecasted Estimates (till 2035) (Kilograms)
- Table 25.67 Commercial Demand for Peptide Therapeutics Contract API Manufacturing: Distribution by Mechanism of Action (specific to GLP-1), Current Year and 2035
- Table 25.68 Commercial Demand for Peptide Therapeutics Contract API Manufacturing for GLP-1 Drugs, Historical Trends (since 2017) and Forecasted Estimates (till 2035) (Kilograms)
- Table 25.69 Commercial Demand for Peptide Therapeutics Contract API Manufacturing for non-GLP-1 based Drugs, Historical Trends (since 2017) and Forecasted Estimates (till 2035) (Kilograms)
- Table 25.70 Global Demand for Peptide Therapeutics Contract API Manufacturing: Distribution by Type of Peptide Synthesis Method, Current Year and 2035 (Kilograms)
- Table 25.71 Global Demand for Peptide Therapeutics Contract API Manufacturing: Distribution by Geography, Current Year and 2035 (Kilograms)
- Table 25.72 Global Installed Peptide Therapeutics Contract API Manufacturing Capacity: Distribution by Company Size (liters)
- Table 25.73 Global Installed Peptide Therapeutics Contract API Manufacturing Capacity: Range of Installed Capacity (liters)
- Table 25.74 Global Installed Peptide Therapeutics Contract API Manufacturing Capacity: Distribution by Scale of Operation (liters)
- Table 25.75 Global Installed Peptide Therapeutics Contract API Manufacturing Capacity: Distribution by Location of Manufacturing Facility (liters)
- Table 25.76 Global Installed Peptide Therapeutics Contract API Manufacturing Capacity: Distribution by Company Size and Location of Manufacturing Facility (liters)
- Table 25.77 Global Installed Peptide Therapeutics Contract API Manufacturing Capacity: Distribution by Synthesis Method (liters)
- Table 25.78 Total Cost of Ownership for Peptide Therapeutics Contract API Manufacturing Organization, Y0-Y20 (USD Million)
- Table 25.79 Total Cost of Ownership for Peptide Therapeutics Contract API Manufacturing Organization: Distribution by CAPEX and OPEX, Y0 and Y20 (USD Million)
- Table 25.80 Total Cost of Ownership for Peptide Therapeutics Contract API Manufacturing Organization, Y0: Distribution by CAPEX (USD Million)
- Table 25.81 Total Cost of Ownership for Peptide Therapeutics Contract API Manufacturing Organization, Y1-Y20: Distribution by OPEX (USD Million)
- Table 25.82 Global Peptide Therapeutics Contract API Manufacturing Market, Historical Trends (since 2021) and Forecasted Estimates (till 2035) (USD Billion)
- Table 25.83 Global Peptide Therapeutics Contract API Manufacturing Market, Forecasted Estimates (till 2035): Conservative Scenario (USD Billion)
- Table 25.84 Global Peptide Therapeutics Contract API Manufacturing Market, Forecasted Estimates (till 2035): Optimistic Scenario (USD Billion)
- Table 25.85 Peptide Therapeutics Contract API Manufacturing Market: Distribution by Type of Peptide Synthesis Method, 2024 And 2035
- Table 25.86 Peptide Therapeutics Contract API Manufacturing Market for Type of Non-chemical Synthesis, Historical Trends (since 2021) and Forecasted Estimates (till 2035) (USD Billion)
- Table 25.87 Peptide Therapeutics Contract API Manufacturing Market for Type of Chemical Synthesis, Historical Trends (since 2021) and Forecasted Estimates (till 2035) (USD Billion)
- Table 25.88 Peptide Therapeutics Contract API Manufacturing Market for Liquid Phase Synthesis, Historical Trends (since 2021) and Forecasted Estimates (till 2035) (USD Billion)
- Table 25.89 Peptide Therapeutics Contract API Manufacturing Market for Solid Phase Synthesis, Historical Trends (since 2021) and Forecasted Estimates (till 2035) (USD Billion)
- Table 25.90 Peptide Therapeutics Contract API Manufacturing Market for Hybrid Phase Synthesis, Historical Trends (since 2021) and Forecasted Estimates (till 2035) (USD Billion)
- Table 25.91 Peptide Therapeutics Contract API Manufacturing Market: Distribution by Company Size, Current Year and 2035
- Table 25.92 Peptide Therapeutics Contract API Manufacturing Market for Small Companies, Historical Trends (since 2021) and Forecasted Estimates (till 2035) (USD Billion)
- Table 25.93 Peptide Therapeutics Contract API Manufacturing Market for Mid-sized Companies, Historical Trends (since 2021) and Forecasted Estimates (till 2035) (USD Billion)
- Table 25.94 Peptide Therapeutics Contract API Manufacturing Market for Large and Very Large Companies, Historical Trends (since 2021) and Forecasted Estimates (till 2035) (USD Billion)
- Table 25.95 Peptide Therapeutics Contract API Manufacturing Market: Distribution by Geography, Current Year and 2035
- Table 25.96 Peptide Therapeutics Contract API Manufacturing Market in North America, Historical Trends (since 2021) and Forecasted Estimates (till 2035) (USD Billion)
- Table 25.97 Peptide Therapeutics Contract API Manufacturing Market for Small Companies in North America, till 2035 (USD Billion)
- Table 25.98 Peptide Therapeutics Contract API Manufacturing Market for Mid-sized Companies in North America, till 2035 (USD Billion)
- Table 25.99 Peptide Therapeutics Contract API Manufacturing Market for Large and Very Large Companies in North America, till 2035 (USD Billion)
- Table 25.100 Peptide Therapeutics Contract API Manufacturing Market in North America for Chemical Synthesis Method, till 2035 (USD Billion)
- Table 25.101 Peptide Therapeutics Contract API Manufacturing Market in North America for Non-Chemical Synthesis Method, till 2035 (USD Billion)
- Table 25.102 Peptide Therapeutics Contract API Manufacturing Market in Europe, Historical Trends (since 2021) and Forecasted Estimates (till 2035) (USD Billion)
- Table 25.103 Peptide Therapeutics Contract API Manufacturing Market for Small Companies in Europe, till 2035 (USD Billion)
- Table 25.104 Peptide Therapeutics Contract API Manufacturing Market for Mid-sized Companies in Europe, till 2035 (USD Billion)
- Table 25.105 Peptide Therapeutics Contract API Manufacturing Market for Large and Very Large Companies in Europe, till 2035 (USD Billion)
- Table 25.106 Peptide Therapeutics Contract API Manufacturing Market in Europe for Chemical Synthesis Method, till 2035 (USD Billion)
- Table 25.107 Peptide Therapeutics Contract API Manufacturing Market in Europe for Non-Chemical Synthesis Method, till 2035 (USD Billion)
- Table 25.108 Peptide Therapeutics Contract API Manufacturing Market in Asia-Pacific and Rest of the World, Historical Trends (since 2021) and Forecasted Estimates (till 2035) (USD Billion)
- Table 25.109 Peptide Therapeutics Contract API Manufacturing Market for Small Companies in Asia-Pacific and Rest of the World, till 2035 (USD Billion)
- Table 25.110 Peptide Therapeutics Contract API Manufacturing Market for Mid-sized Companies in Asia-Pacific and Rest of the World, till 2035 (USD Billion)
- Table 25.111 Peptide Therapeutics Contract API Manufacturing Market for Large and Very Large Companies in Asia- Pacific and Rest of the World, till 2035 (USD Billion)
- Table 25.112 Peptide Therapeutics Contract API Manufacturing Market in Asia-Pacific and Rest of the World for Chemical Synthesis Method, till 2035 (USD Billion)
- Table 25.113 Peptide Therapeutics Contract API Manufacturing Market in Asia-Pacific and Rest of the World for Non-Chemical Synthesis Method, till 2035 (USD Billion)
List of Figures
- Figure 2.1 Research Methodology: Project Methodology
- Figure 2.2 Research Methodology: Forecast Methodology
- Figure 2.3 Research Methodology: Robust Quality Control
- Figure 2.4 Research Methodology: Key Market Segmentation
- Figure 3.1 Lessons Learnt from Past Recessions
- Figure 4.1 Executive Summary: Overall Market Landscape
- Figure 4.2 Executive Summary: Recent Developments and Initiatives
- Figure 4.3 Executive Summary: Clinical Trial Analysis
- Figure 4.4 Executive Summary: Demand Analysis
- Figure 4.5 Executive Summary: Capacity Analysis
- Figure 4.6 Executive Summary: Total Cost of Ownership
- Figure 4.7 Executive Summary: Market Forecast and Opportunity Analysis (I/II)
- Figure 4.8 Executive Summary: Market Forecast and Opportunity Analysis (II/II)
- Figure 5.1 Methods of Peptide Synthesis
- Figure 5.2 Latest Technologies for Peptide Synthesis
- Figure 5.3 Peptide Modification Techniques
- Figure 5.4 Types of Third-Party Service Providers
- Figure 6.1 Regulatory Agencies Governing Peptide Manufacturing in the US
- Figure 7.1 Peptide Therapeutics Contract API Manufacturers: Distribution by Year of Establishment
- Figure 7.2 Peptide Therapeutics Contract API Manufacturers: Distribution by Year of Entrance of Peptide API Contract Manufacturers
- Figure 7.3 Peptide Therapeutics Contract API Manufacturers: Distribution by Company Size
- Figure 7.4 Peptide Therapeutics Contract API Manufacturers: Distribution by Location of Headquarters
- Figure 7.5 Peptide Therapeutics Contract API Manufacturers: Distribution by Type of Product
- Figure 7.6 Peptide Therapeutics Contract API Manufacturers: Distribution by Type of API Manufactured
- Figure 7.7 Peptide Therapeutics Contract API Manufacturers: Distribution by Scale of Operation
- Figure 7.8 Peptide Therapeutics Contract API Manufacturers: Distribution by Type of Services Offered
- Figure 7.9 Peptide Therapeutics Contract API Manufacturers: Distribution by Type of Peptide Synthesis Method
- Figure 7.10 Peptide Therapeutics Contract API Manufacturers: Distribution by Type of Peptide Modification
- Figure 7.11 Peptide Therapeutics Contract API Manufacturers: Distribution by Type of Purification Technology Used
- Figure 7.12 Peptide Therapeutics Contract API Manufacturers: Distribution by Regulatory Certifications and Accreditations
- Figure 7.13 Peptide Therapeutics Contract API Manufacturers: Distribution by Geographical Presence (Region)
- Figure 7.14 Peptide Therapeutics Contract API Manufacturers: Distribution by Location of Peptide API Manufacturing Facilities (Region)
- Figure 7.15 Peptide Therapeutics Contract API Manufacturers: Distribution by Location of Peptide API Manufacturing Facilities (Country)
- Figure 8.1 Company Competitiveness Analysis: Peptide Therapeutics Contract API Manufacturers with Low Manufacturing Capacity
- Figure 8.2 Company Competitiveness Analysis: Peptide Therapeutics Contract API Manufacturers with Medium Manufacturing Capacity
- Figure 8.3 Company Competitiveness Analysis: Peptide Therapeutics Contract API Manufacturers with High Manufacturing Capacity
- Figure 9.1 AmbioPharm: Service Portfolio
- Figure 9.2 CPC Scientific: Service Portfolio
- Figure 9.3 Creative peptides: Service Portfolio
- Figure 9.4 CSBio: Service Portfolio
- Figure 9.5 Bachem: Service Portfolio
- Figure 9.6 BCN Peptide: Service Portfolio
- Figure 9.7 CordenPharma: Service Portfolio
- Figure 9.8 PolyPeptide: Service Portfolio
- Figure 9.9 Senn Chemicals: Service Portfolio
- Figure 9.10 Auspep: Service Portfolio
- Figure 9.11 Chinese Peptide: Service Portfolio
- Figure 9.12 Hybio Pharmaceuticals: Service Portfolio
- Figure 9.13 Peptide Institute: Service Portfolio
- Figure 9.14 ScinoPharm: Service Portfolio
- Figure 10.1 Partnerships and Collaborations: Cumulative Year-wise Trend
- Figure 10.2 Partnerships and Collaborations: Distribution by Type of Partnership
- Figure 10.3 Partnerships and Collaborations: Distribution by Year and Type of Partnership
- Figure 10.4 Partnerships and Collaborations: Distribution by Company Size and Type of Partnership
- Figure 10.5 Partnerships and Collaborations: Distribution by Scale of Operation
- Figure 10.6 Partnerships and Collaborations: Distribution by Scale of Operation and Type of Partnership
- Figure 10.7 Partnerships and Collaborations: Distribution by Green Chemistry Integration
- Figure 10.8 Most Active Players: Distribution by Number of Partnerships
- Figure 10.9 Partnerships and Collaborations: Intercontinental and Intracontinental Agreements
- Figure 10.10 Partnerships and Collaborations: Local and International Agreements
- Figure 10.11 Recent Expansions: Cumulative Year-wise Trend of Recent Expansions
- Figure 10.12 Recent Expansions: Distribution by Type of Expansion
- Figure 10.13 Recent Expansions: Distribution by Year and Type of Expansion
- Figure 10.14 Recent Expansions: Distribution by Location of Expanded Facility (Region)
- Figure 10.15 Recent Expansions: Distribution by Location of Expanded Facility (Country)
- Figure 10.16 Recent Expansions: Distribution by Location of Expanded Facility and Type of Expansion
- Figure 10.17 Most Active Players: Distribution by Number of Expansions
- Figure 10.18 Recent Expansions: Distribution by Geography (Country)
- Figure 10.19 Chemo-Enzymatic Peptide Synthesis Technology: Advantages and Disadvantages
- Figure 10.20 Continuous Flow Technology: Advantages and Disadvantages
- Figure 10.21 Green Chemistry: Advantages and Disadvantages
- Figure 11.1 Clinical Trial Analysis: Scope and Methodology
- Figure 11.2 Clinical Trial Analysis: Cumulative Distribution by Trial Registration Year
- Figure 11.3 Clinical Trial Analysis: Year-wise Trend of Patients Enrolled by Trial Registration Year
- Figure 11.4 Clinical Trial Analysis: Distribution by Trial Phase
- Figure 11.5 Clinical Trial Analysis: Distribution by Trial Registration Year and Trial Phase
- Figure 11.6 Clinical Trial Analysis: Distribution by Trial Phase and Patients Enrolled
- Figure 11.7 Clinical Trial Analysis: Distribution by Trial Status
- Figure 11.8 Clinical Trial Analysis: Distribution by Trial Registration Year and Trial Status
- Figure 11.9 Clinical Trial Analysis: Distribution by Therapeutic Area
- Figure 11.10 Clinical Trial Analysis: Distribution by Mechanism of Action
- Figure 11.11 Clinical Trial Analysis: Distribution by Trial Registration Year and Mechanism of Action
- Figure 11.12 Clinical Trial Analysis: Distribution by Type of Sponsor / Collaborator
- Figure 11.13 Clinical Trial Analysis: Distribution by Type of Patient Allocation Model Used
- Figure 11.14 Clinical Trial Analysis: Distribution by Type of Trial Masking Adopted
- Figure 11.15 Clinical Trial Analysis: Distribution by Type of Intervention
- Figure 11.16 Clinical Trial Analysis: Distribution by Trial Purpose
- Figure 11.17 Most Active Industry Players: Distribution by Number of Clinical Trials
- Figure 11.18 Most Active Non-industry Players: Distribution by Number of Clinical Trials
- Figure 11.19 Clinical Trial Analysis: Distribution of Clinical Trials by Geography
- Figure 11.20 Clinical Trial Analysis: Distribution of Clinical Trials by Geography and Trial Status
- Figure 11.21 Clinical Trial Analysis: Distribution by Geography and Therapeutic Area
- Figure 11.22 Clinical Trial Analysis:
Distribution of Patients Enrolled by Geography
- Figure 11.23 Clinical Trial Analysis: Distribution of Patients Enrolled by Geography and Trial Status
- Figure 12.1 Regional Distribution of Peptide Therapeutics Contract API Manufacturing Facilities
- Figure 12.2 Regional Capability Analysis: Regional Capability Analysis: Peptide API Contract Manufacturers in North America
- Figure 12.3 Regional Capability Analysis: Regional Capability Analysis: Peptide API Contract Manufacturers in Europe
- Figure 12.4 Regional Capability Analysis: Peptide API Contract Manufacturers in Asia-Pacific
- Figure 13.1 Global Demand for Peptide Therapeutics Contract API Manufacturing, Historical Trends (since 2017) and Forecasted Estimates (till 2035) (Kilograms)
- Figure 13.2 Global Clinical Demand for Peptide Therapeutics Contract API Manufacturing, Historical Trends (since 2017) and Forecasted Estimates (till 2035) (Kilograms)
- Figure 13.3 Clinical Demand for Peptide Therapeutics Contract API Manufacturing: Distribution by Phase of Development, Current Year and 2035
- Figure 13.4 Clinical Demand for Peptide Therapeutics Contract API Manufacturing for Phase I Trials, till 2035 (Kilograms)
- Figure 13.5 Clinical Demand for Peptide Therapeutics Contract API Manufacturing for Phase II Trials, till 2035 (Kilograms)
- Figure 13.6 Clinical Demand for Peptide Therapeutics Contract API Manufacturing for Phase III Trials, till 2035 (Kilograms)
- Figure 13.7 Global Commercial Demand for Peptide Therapeutics Contract API Manufacturing, Historical Trends (since 2017) and Forecasted Estimates (till 2035) (Kilograms)
- Figure 13.8 Commercial Demand for Peptide Therapeutics Contract API Manufacturing: Distribution by to GLP-1 Mechanism of Action, Current Year and 2035
- Figure 13.9 Commercial Demand for Peptide Therapeutics Contract API Manufacturing for GLP-1 Drugs, Historical Trends (since 2017) and Forecasted Estimates (till 2035) (Kilograms)
- Figure 13.10 Commercial Demand for Peptide Therapeutics Contract API Manufacturing for non-GLP-1 Drugs, Historical Trends (since 2017) and Forecasted Estimates (till 2035) (Kilograms)
- Figure 13.11 Global Demand for Peptide Therapeutics Contract API Manufacturing: Distribution by Type of Peptide Synthesis Method, Current Year and 2035 (Kilograms)
- Figure 13.12 Global Demand for Peptide Therapeutics Contract API Manufacturing: Distribution by Geography, Current Year and 2035 (Kilograms)
- Figure 14.1 Global Installed Peptide Therapeutics Contract API Manufacturing Capacity: Distribution by Company Size
- Figure 14.2 Global Installed Peptide Therapeutics Contract API Manufacturing Capacity: Range of Installed Capacity (Liters)
- Figure 14.3 Global Installed Peptide Therapeutics Contract API Manufacturing Capacity: Distribution by Scale of Operation (Liters)
- Figure 14.4 Global Installed Peptide Therapeutics Contract API Manufacturing Capacity: Distribution by Location of Manufacturing Facility (Liters)
- Figure 14.5 Global Installed Peptide Therapeutics Contract API Manufacturing Capacity: Distribution by Company Size and Location of Manufacturing Facility
- Figure 14.6 Global Installed Peptide Therapeutics Contract API Manufacturing Capacity: Distribution by Synthesis Method (Liters)
- Figure 16.1 Make versus Buy Decision Making Framework
- Figure 16.2 Make versus Buy Decision Making: Possible Scenario
- Figure 17.1 Total Cost of Ownership: Capital Expenditures (CAPEX)
- Figure 17.2 Total Cost of Ownership: Operational Expenditures (OPEX)
- Figure 17.3 Total Cost of Ownership for Peptide Therapeutics Contract API Manufacturing Organization, Y0-Y20 (USD Million)
- Figure 17.4 Total Cost of Ownership for Peptide Therapeutics Contract API Manufacturing Organization: Distribution by CAPEX and OPEX, Y0 and Y20 (USD Million)
- Figure 17.5 Total Cost of Ownership for Peptide Therapeutics Contract API Manufacturing Organization, Y0: Distribution by CAPEX (USD Million)
- Figure 17.6 Total Cost of Ownership for Peptide Therapeutics Contract API Manufacturing Organization, Y1-Y20: Distribution by OPEX (USD Million)
- Figure 18.1 Global Peptide Therapeutics Contract API Manufacturing Market, Historical Trends (since 2021) and Forecasted Estimates (till 2035) (USD Billion)
- Figure 18.2 Global Peptide Therapeutics Contract API Manufacturing Market, Forecasted Estimates (till 2035): Conservative Scenario (USD Billion)
- Figure 18.3 Global Peptide Therapeutics Contract API Manufacturing Market, Forecasted Estimates (till 2035): Optimistic Scenario (USD Billion)
- Figure 19.1 Peptide Therapeutics Contract API Manufacturing Market: Distribution by Type of Peptide Synthesis Method, Current Year and 2035
- Figure 19.2 Peptide Therapeutics Contract API Manufacturing Market for Non-chemical Synthesis, Historical Trends (since 2021) and Forecasted Estimates (till 2035) (USD Billion)
- Figure 19.3 Peptide Therapeutics Contract API Manufacturing Market for Chemical Synthesis, Historical Trends (since 2021) and Forecasted Estimates (till 2035) (USD Billion)
- Figure 19.4 Peptide Therapeutics Contract API Manufacturing Market for Liquid Phase Synthesis, Historical Trends (since 2021) and Forecasted Estimates (till 2035) (USD Billion)
- Figure 19.5 Peptide Therapeutics Contract API Manufacturing Market for Solid Phase Synthesis, Historical Trends (since 2021) and Forecasted Estimates (till 2035) (USD Billion)
- Figure 19.6 Peptide Therapeutics Contract API Manufacturing Market for Hybrid Phase Synthesis, Historical Trends (since 2021) and Forecasted Estimates (till 2035) (USD Billion)
- Figure 20.1 Peptide Therapeutics Contract API Manufacturing Market: Distribution by Company Size, Current Year and 2035
- Figure 20.2 Peptide Therapeutics Contract API Manufacturing Market for Small Companies, Historical Trends (since 2021) and Forecasted Estimates (till 2035) (USD Billion)
- Figure 20.3 Peptide Therapeutics Contract API Manufacturing Market for Mid-sized Companies, Historical Trends (since 2021) and Forecasted Estimates (till 2035) (USD Billion)
- Figure 20.4 Peptide Therapeutics Contract API Manufacturing Market for Large and Very Large Companies, Historical Trends (since 2021) and Forecasted Estimates (till 2035) (USD Billion)
- Figure 21.1 Peptide Therapeutics Contract API Manufacturing Market: Distribution by Geography, Current Year and 2035
- Figure 21.2 Peptide Therapeutics Contract API Manufacturing Market in North America, Historical Trends (since 2021) and Forecasted Estimates (till 2035) (USD Billion)
- Figure 21.3 Peptide Therapeutics Contract API Manufacturing Market for Small Companies in North America, till 2035 (USD Billion)
- Figure 21.4 Peptide Therapeutics Contract API Manufacturing Market for Mid-sized Companies in North America, till 2035 (USD Billion)
- Figure 21.5 Peptide Therapeutics Contract API Manufacturing Market for Large and Very Large Companies in North America, till 2035 (USD Billion)
- Figure 21.6 Peptide Therapeutics Contract API Manufacturing Market in North America for Chemical Synthesis Method, till 2035 (USD Billion)
- Figure 21.7 Peptide Therapeutics Contract API Manufacturing Market in North America for Non-Chemical Synthesis Method, till 2035 (USD Billion)
- Figure 21.8 Peptide Therapeutics Contract API Manufacturing Market in Europe, Historical Trends (since 2021) and Forecasted Estimates (till 2035) (USD Billion)
- Figure 21.9 Peptide Therapeutics Contract API Manufacturing Market for Small Companies in Europe, till 2035 (USD Billion)
- Figure 21.10 Peptide Therapeutics Contract API Manufacturing Market for Mid-sized Companies in Europe, till 2035 (USD Billion)
- Figure 21.11 Peptide Therapeutics Contract API Manufacturing Market for Large and Very Large Companies in Europe, till 2035 (USD Billion)
- Figure 21.12 Peptide Therapeutics Contract API Manufacturing Market in Europe for Chemical Synthesis Method, till 2035 (USD Billion)
- Figure 21.13 Peptide Therapeutics Contract API Manufacturing Market in Europe for Non-Chemical Synthesis Method, till 2035 (USD Billion)
- Figure 21.14 Peptide Therapeutics Contract API Manufacturing Market in Asia-Pacific and Rest of the World, Historical Trends (since 2021) and Forecasted Estimates (till 2035) (USD Billion)
- Figure 21.15 Peptide Therapeutics Contract API Manufacturing Market for Small Companies in Asia-Pacific and Rest of the World, till 2035 (USD Billion)
- Figure 21.16 Peptide Therapeutics Contract API Manufacturing Market for Mid-sized Companies in Asia-Pacific and Rest of the World, till 2035 (USD Billion)
- Figure 21.17 Peptide Therapeutics Contract API Manufacturing Market for Large and Very Large Companies in Asia-Pacific and Rest of the World, till 2035 (USD Billion)
- Figure 21.18 Peptide Therapeutics Contract API Manufacturing Market in Asia-Pacific and Rest of the World for Chemical Synthesis Method, till 2035 (USD Billion)
- Figure 21.19 Peptide Therapeutics Contract API Manufacturing Market in Asia-Pacific and Rest of the World for Non-Chemical Synthesis Method, till 2035 (USD Billion)
- Figure 22.1 Contract Peptide API Manufacturing: SWOT Analysis
- Figure 22.2 Comparison of SWOT Factors: Harvey Ball Analysis
- Figure 23.1 Concluding Remarks: Overall Market Landscape (I/II)
- Figure 23.2 Concluding Remarks: Overall Market Landscape (I/II)
- Figure 23.3 Concluding Remarks: Recent Developments (I/II)
- Figure 23.4 Concluding Remarks: Recent Developments (I/II)
- Figure 23.5 Concluding Remarks: Clinical Trial Analysis
- Figure 23.6 Concluding Remarks: Demand Analysis
- Figure 23.7 Concluding Remarks: Capacity Analysis
- Figure 23.8 Concluding Remarks: Likely Partner Analysis
- Figure 23.9 Concluding Remarks: Total Cost of Ownership (USD Million)
- Figure 23.10 Concluding Remarks: Market Sizing and Opportunity Analysis
PEPTIDE SYNTHESIS MARKET: OVERVIEW
As per Roots Analysis, the global peptide synthesis market is estimated to grow from USD 2.8 billion in the current year to USD 5.1 billion by 2035, at a CAGR of 5.5% during the forecast period, till 2035.
The market sizing and opportunity analysis has been segmented across the following parameters:
Type of Synthesis Method Used
- Chemical Synthesis Method
- Non-Chemical Synthesis Method
Type of Chemical Synthesis Method
- Liquid Phase Peptide Synthesis
- Solid Phase Peptide Synthesis
- Hybrid Phase Peptide Synthesis
Company (CMO) Size
- Small
- Mid-sized
- Large
Key Geographical Regions
- North America
- Europe
- Asia-Pacific and Rest of the World
PEPTIDE SYNTHESIS MARKET: GROWTH AND TRENDS
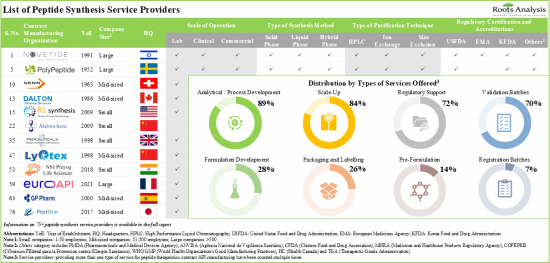
Owing to enhanced metabolic stability, higher affinity, and biological target specificity, peptide therapeutics have emerged as a promising modality in the past few years. It is worth highlighting that more than 80 peptide programs have been approved by different regulatory agencies across the globe. In addition, more than 630 clinical trials are currently evaluating several peptide therapeutics for the treatment of a wide range of diseases. This demonstrates the extensive development efforts being undertaken by various stakeholders in this domain. However, peptide synthesis is associated with several challenges that have prompted pharmaceutical and biotechnology companies to outsource key operations. At present, over 75 industry players are offering a wide range of peptide synthesis services, including formulation development, large scale production, analytical / regulatory support, process development, validation batches, packaging and labeling, pre-formulation and custom peptide synthesis.
As drug developers invest more in these innovative therapies, the peptide synthesis market is anticipated to expand further. Moreover, owing to the healthy early-stage pipeline, growth in this domain is expected to continue in the long term as well.
PEPTIDE SYNTHESIS MARKET: KEY INSIGHTS
The report delves into the current state of the peptide synthesis market and identifies potential growth opportunities within the industry. Some key findings from the report include:
1. Currently, over 75 companies claim to offer peptide therapeutics contract API manufacturing services in order to cater to the rising demand for peptide API based drugs, across the globe.
2. The market landscape is highly fragmented, featuring the presence of both new entrants and established players in different geographical regions; close to 50% of such contract manufacturers are large companies.
3. Majority of players offer generic peptide API manufacturing using the chemical synthesis method; further, 60% of the peptide synthesis service providers offer API manufacturing with more than one type of peptide synthesis method.
4. In pursuit of gaining a competitive edge, peptide therapeutics contract API manufacturers are actively upgrading their existing capabilities and enhancing their service portfolios to establish a strong foothold in the domain.
5. The growing interest of developers in peptide-based therapeutics is evident from the rise in partnership activity; more than 30% of the deals were inked specifically for peptide API manufacturing.
6. In order to meet the rising demand for peptide APIs, service providers have made elaborate investments to expand their existing capacities and capabilities; this trend is most pronounced in Germany and the US.
7. In the last decade, over 600 clinical trials, enrolling close to 200 thousand patients suffering from a myriad of disease indications, have been registered across the globe to evaluate the efficacy of peptide-based drugs.
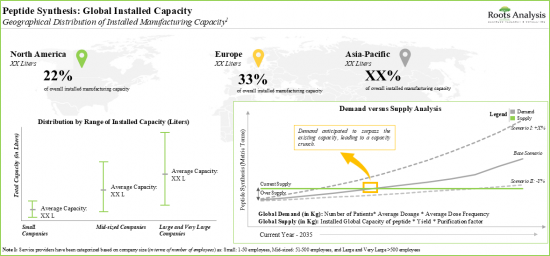
8. Since peptide-based drugs are being used progressively for the treatment of various diseases, the demand is indubitably rising and expected to grow at an annualized rate of over 7% in the near future.
9. The global installed peptide manufacturing capacity is spread across various geographies; majority of the capacity is installed in the production plants located in Asia-Pacific and Europe.
10. The projected opportunity for peptide therapeutics contract service providers is likely to be well distributed across different segments; currently, close to 40% of the contract manufacturing opportunity is captured by Europe.
PEPTIDE SYNTHESIS MARKET: KEY SEGMENTS
Currently, the Chemical Synthesis Method Occupies the Largest Share of the Peptide Synthesis Market
Based on the types of peptide synthesis methods, the global peptide synthesis market is segmented into chemical synthesis method and non-chemical synthesis method. It is worth highlighting that, owing to several benefits, such as flexibility, scalability, ease of implementation and cost-effectiveness, majority of the current peptide synthesis market is captured by the chemical synthesis method. This trend is likely to remain the same in the forthcoming years.
Currently, Solid Phase Peptide Synthesis Occupies the Largest Share of the Peptide Synthesis Market
Based on the type of chemical synthesis method, the global peptide synthesis market is segmented into solid phase peptide synthesis, liquid phase peptide synthesis, and hybrid phase peptide synthesis. It is worth highlighting that the solid phase peptide synthesis market is likely to witness substantial growth in the coming decade. This can be attributed to the fact that the solid phase peptide synthesis method offers numerous advantages, such as rapid formation of linear peptides, simple purification and cost-effectiveness.
Small Contract Manufacturers Segment is the Fastest Growing Segment of the Peptide Synthesis Market
Based on the company size, the peptide synthesis market is segmented into small, mid-sized, and large contract manufacturers. It is anticipated that small contract manufacturers are likely to grow at a higher CAGR in the forthcoming years.
Europe Accounts for the Largest Share of the Market
Based on key geographical regions, the market is segmented into North America, Europe, and Asia-Pacific and the rest of the world. Majority of the share is expected to be captured by players based in Europe. It is worth highlighting that over the years, the market in Asia-Pacific and the rest of the world is expected to grow at a higher CAGR.
Example Players in the Peptide Synthesis Market
- AmbioPharm
- CPC Scientific
- Creative Peptides
- CSBio
- Bachem
- BCN Peptide
- CordenPharma
- Senn Chemicals
- PolyPeptide
- Auspep
- Chinese Peptide Company
- Hybio Pharmaceuticals
- Peptide Institute
- ScinoPharm
Primary Research Overview
The opinions and insights presented in this study were influenced by discussions conducted with multiple stakeholders. The research report features detailed transcripts of interviews held with the following industry stakeholders:
- Chief Business Officer, Senior Director of Scientific Affairs and Technical Marketing, Ascendia Pharmaceuticals
- Vice President, Peptides, Almac
- Chief Financial Officer, NUMAFERM
- Senior Manager, Peptide Business Project Leader, Sekisui XenoTech
- Founder and Owner, Previtalica
PEPTIDE SYNTHESIS MARKET: RESEARCH COVERAGE
- Market Sizing and Opportunity Analysis: The report features an in-depth analysis of the peptide synthesis market, focusing on key market segments, including [A] type of peptide synthesis method, [B] type of chemical synthesis, [C] contract manufacturing organization size and [D] key geographical regions.
- Market Landscape: A comprehensive evaluation of companies involved in peptide contract manufacturing, considering various parameters, such as [A] year of establishment, [B] year of entrance, [C] company (CMO) size (in terms of number of employees), [D] location of headquarters, [E] type of product, [F] type of API manufactured, [G] scale of operation, [H] type of services offered, [I] peptide synthesis method, [J] type of peptide modification, [K] type of purification technology used, [L] regulatory certifications and accreditations, [M] geographical presence and [N] location of peptide API manufacturing facilities.
- Company Competitiveness Analysis: A comprehensive competitive analysis of peptide contract manufacturers, examining factors such as [A] supplier strength, [B] company competitiveness and [C] number of peptide modification services offered.
- Company Profiles: In-depth profiles of key industry players engaged in the peptide therapeutics contract manufacturing market, focusing on [A] company overviews, [B] service portfolio, [C] location of production facilities and capabilities of service providers, [D] recent developments, and [E] an informed future outlook.
- Recent Developments and Initiatives: An analysis of recent trends, covering partnerships and collaborations, and expansion initiatives held in this domain.
- Clinical Trial Analysis: Examination of completed, ongoing, and planned clinical studies of various peptide therapeutics based on several relevant parameters, such as [A] trial registration year, [B] number of patients enrolled, [C] trial phase, [D] trial status, [E] study design, [F] type of sponsor / collaborator, [G] therapeutic area, [H] type of mechanism of action and clinical trial centers, [I] geography, and [J] enrolled patient population.
- Regional Capability Analysis: A detailed analysis on the capabilities of peptide synthesis companies in different regions, based on several relevant parameters, such as the number of CMOs, number of clinical sites, number of clinical trials, number of patients enrolled, number of peptide manufacturing facilities, demand for peptide therapeutics and installed capacity.
- Demand Analysis: Informed estimates of the annual commercial and clinical demand for peptide therapeutics based on several relevant parameters, such as [A] target patient population, [B] dosing frequency and [C] dose strength.
- Capacity Analysis: The report provides an estimation of the global annual capacity of contract manufacturers in the peptide synthesis market. The analysis takes into consideration the distribution of available peptide production capacity across [A] companies of different sizes, [B] scale of operation, [C] location of manufacturing facility and [D] synthesis method.
- Likely Partner Analysis: An analysis highlighting potential strategic partners segregated based on the likelihood of entering into collaboration with peptide therapeutics developers. These players have been shortlisted based on several relevant parameters, such as [A] pipeline strength, [B] pipeline maturity, [C] year of establishment and [D] company size.
- Additional Insights: An insightful framework that emphasizes the key indicators and factors that need to be considered by developers to determine whether to manufacture their respective products in-house or outsource the manufacturing operation to contract service providers.
- Total Cost of Ownership: A region-wise, detailed analysis of the total cost of ownership for a peptide contract manufacturing service provider. It features an informed estimate of direct and indirect expenses taking into consideration 10 relevant parameters, over a span of 20 years.
- Regulatory Landscape: A discussion on general regulatory guidelines, highlighting the key differences across various geographies, including the US, Europe, Australia, China, India, Japan and South Korea. In addition, it provides details related to the various challenges, related to regulatory scrutiny, faced by peptide synthesis companies.
- SWOT Analysis: A SWOT analysis, focusing on key drivers and challenges that are likely to impact the industry's evolution. Further, it includes a Harvey ball analysis, highlighting the relative effect of each SWOT parameter on the overall industry.
KEY QUESTIONS ANSWERED IN THIS REPORT
- How many companies are currently engaged in this market?
- Which are the leading companies in this market?
- What kind of partnership models are commonly adopted by industry stakeholders?
- What is the current annual demand for peptide therapeutics?
- What factors are likely to influence the evolution of this market?
- What is the current and future market size?
- What is the CAGR of this market?
- How is the current and future market opportunity likely to be distributed across key market segments?
REASONS TO BUY THIS REPORT
- The report provides a comprehensive market analysis, offering detailed revenue projections of the overall market and its specific sub-segments. This information is valuable to both established market leaders and emerging entrants.
- Stakeholders can leverage the report to gain a deeper understanding of the competitive dynamics within the market. By analyzing the competitive landscape, businesses can make informed decisions to optimize their market positioning and develop effective go-to-market strategies.
- The report offers stakeholders a comprehensive overview of the market, including key drivers, barriers, opportunities, and challenges. This information empowers stakeholders to stay abreast of market trends and make data-driven decisions to capitalize on growth prospects.
ADDITIONAL BENEFITS
- Complimentary PPT Insights Packs
- Complimentary Excel Data Packs for all Analytical Modules in the Report
- 10% Free Content Customization
- Detailed Report Walkthrough Session with Research Team
- Free Updated report if the report is 6-12 months old or older
TABLE OF CONTENTS
1. PREFACE
- 1.1. Introduction
- 1.2. Market Share Insights
- 1.3. Key Market Insights
- 1.4. Report Coverage
- 1.5. Key Questions Answered
- 1.6. Chapter Outlines
2. RESEARCH METHODOLOGY
- 2.1. Chapter Overview
- 2.2. Research Assumptions
- 2.3. Project Methodology
- 2.4. Forecast Methodology
- 2.5. Robust Quality Control
- 2.6. Key Considerations
- 2.6.1. Demographics
- 2.6.2. Economic Factors
- 2.6.3. Government Regulations
- 2.6.4. Supply Chain
- 2.6.5. COVID Impact / Related Factors
- 2.6.6. Market Access
- 2.6.7. Healthcare Policies
- 2.6.8. Industry Consolidation
- 2.7. Key Market Segmentations
3. ECONOMIC AND OTHER PROJECT SPECIFIC CONSIDERATIONS
- 3.1. Chapter Overview
- 3.2. Market Dynamics
- 3.2.1. Time Period
- 3.2.1.1. Historical Trends
- 3.2.1.2. Current and Forecasted Estimates
- 3.2.2. Currency Coverage
- 3.2.2.1. Overview of Major Currencies Affecting the Market
- 3.2.2.2. Impact of Currency Fluctuations on the Industry
- 3.2.3. Foreign Exchange Impact
- 3.2.3.1. Evaluation of Foreign Exchange Rates and Their Impact on Market
- 3.2.3.2. Strategies for Mitigating Foreign Exchange Risk
- 3.2.4. Recession
- 3.2.4.1. Historical Analysis of Past Recessions and Lessons Learnt
- 3.2.4.2. Assessment of Current Economic Conditions and Potential Impact on the Market
- 3.2.5. Inflation
- 3.2.5.1. Measurement and Analysis of Inflationary Pressures in the Economy
- 3.2.5.2. Potential Impact of Inflation on the Market Evolution
- 3.2.1. Time Period
4. EXECUTIVE SUMMARY
5. INTRODUCTION
- 5.1. Chapter Overview
- 5.2. Overview of Peptides
- 5.2.1. Structural Analysis of Peptides
- 5.2.2. Classification of Peptides
- 5.2.3. Peptide Synthesis
- 5.2.4. Emerging Technologies for Peptide Synthesis
- 5.2.5. Peptide Modification
- 5.2.5.1. N-terminal Modification
- 5.2.5.2. Internal Modification
- 5.2.5.3. C-terminal Modification
- 5.2.5.4. Other Modifications
- 5.2.6. Peptide Purification
- 5.2.6.1. Peptide Purity Guidelines
- 5.3. Overview of Contract Manufacturing
- 5.3.1. Need for Outsourcing in the Peptide Manufacturing Industry
- 5.3.2. General Considerations for Selecting a CMO Partner
- 5.3.3. Advantages of Outsourcing Manufacturing Operations
- 5.3.4. Risks and Challenges Associated with Outsourcing of Peptide API Manufacturing
- 5.4. Future Perspectives
6. REGULATORY LANDSCAPE
- 6.1. Chapter Overview
- 6.2. Regulatory Scenario: North America
- 6.2.1. Scenario in The US
- 6.2.1.1. Overview
- 6.2.1.2. General Guidelines for Peptide Manufacturing
- 6.2.1. Scenario in The US
- 6.3. Regulatory Scenario: Europe
- 6.3.1. Scenario in Europe
- 6.3.1.1. Overview
- 6.3.1.2. General Guidelines
- 6.3.2. Scenario in The UK
- 6.3.2.1. Overview
- 6.3.2.2. General Guidelines for Peptide Manufacturing
- 6.3.1. Scenario in Europe
- 6.4. Regulatory Scenario: Asia-Pacific
- 6.4.1. Overview
- 6.4.2. Scenario in Australian
- 6.4.2.1. General Guidelines for Peptide Manufacturing
- 6.4.3. Scenario in Chinese
- 6.4.3.1. General Guidelines for Peptide Manufacturing
- 6.4.3.2. Tax-related Modifications in Chinese Pharmaceutical Sector
- 6.4.4. Scenario in India
- 6.4.4.1. General Guidelines for Peptide Manufacturing
- 6.4.4.2. Tax-related Modifications in Indian Pharmaceutical Sector
- 6.4.5. Scenario in Japan
- 6.4.5.1. General Guidelines for Peptide Manufacturing
- 6.4.6. Scenario in South Korea
- 6.4.6.1. General Guidelines for Peptide Manufacturing
- 6.5. Challenges Associated with Peptide Manufacturing
7. MARKET LANDSCAPE
- 7.1 Chapter Overview
- 7.2 Peptide Therapeutics Contract API Manufacturing: Overall Market Landscape
- 7.2.1. Analysis by Year of Establishment
- 7.2.2. Analysis by Year of Entrance of Peptide API Contract Manufacturers
- 7.2.3. Analysis by Company Size
- 7.2.4. Analysis by Location of Headquarters
- 7.2.5. Analysis by Type of Product
- 7.2.6. Analysis by Type of API Manufactured
- 7.2.7. Analysis by Scale of Operation
- 7.2.8. Analysis by Type of Services Offered
- 7.2.9. Analysis by Type of Peptide Synthesis Method
- 7.2.10. Analysis by Type of Peptide Modification
- 7.2.11. Analysis by Type of Purification Technology Used
- 7.2.12. Analysis by Regulatory Certifications and Accreditations
- 7.2.13. Analysis by Geographical Presence
- 7.2.14. Analysis by Location of Peptide API Manufacturing Facilities
- 7.3. List of Custom Peptide Manufacturers
8. COMPANY COMPETITIVENSS ANALYSIS
- 8.1. Chapter Overview
- 8.2. Key Parameters
- 8.3. Methodology
- 8.4. Company Competitiveness Analysis
- 8.4.1. Peptide Therapeutics Contract API Manufacturers with Low Manufacturing Capacity
- 8.4.2. Peptide Therapeutics Contract API Manufacturers with Medium Manufacturing Capacity
- 8.4.3. Peptide Therapeutics Contract API Manufacturers with High Manufacturing Capacity
9. COMPANY PROFILES
- 9.1 Chapter Overview
- 9.2. Peptide Therapeutics Contract API Manufacturers based in North America
- 9.2.1. AmbioPharm
- 9.2.1.1. Company Overview
- 9.2.1.2. Service Portfolio
- 9.2.1.3. Manufacturing Facilities and Capabilities
- 9.2.1.4. Recent Developments and Future Outlook
- 9.2.2. CPC Scientific
- 9.2.2.1. Company Overview
- 9.2.2.2. Service Portfolio
- 9.2.2.3. Manufacturing Facilities and Capabilities
- 9.2.2.4. Recent Developments and Future Outlook
- 9.2.3. Creative Peptides
- 9.2.3.1. Company Overview
- 9.2.3.2. Service Portfolio
- 9.2.3.3. Manufacturing Facilities and Capabilities
- 9.2.3.4. Recent Developments and Future Outlook
- 9.2.4. CSBio
- 9.2.4.1. Company Overview
- 9.2.4.2. Service Portfolio
- 9.2.4.3. Manufacturing Facilities and Capabilities
- 9.2.4.4. Recent Developments and Future Outlook
- 9.2.1. AmbioPharm
- 9.3. Peptide Therapeutics Contract API Manufacturers based in Europe
- 9.3.1. Bachem
- 9.3.1.1. Company Overview
- 9.3.1.2. Service Portfolio
- 9.3.1.3. Manufacturing Facility and Capabilities
- 9.3.1.4. Recent Developments and Future Outlook
- 9.3.2. BCN Peptides
- 9.3.2.1. Company Overview
- 9.3.2.2. Service Portfolio
- 9.3.2.3. Manufacturing Facility and Capabilities
- 9.3.2.4. Recent Development and Future Outlook
- 9.3.3. CordenPharma
- 9.3.3.1. Company Overview
- 9.3.3.2. Service Portfolio
- 9.3.3.3. Manufacturing Facility and Capabilities
- 9.3.3.4. Recent Developments and Future Outlook
- 9.3.4. PolyPeptide
- 9.3.4.1. Company Overview
- 9.3.4.2. Service Portfolio
- 9.3.4.3. Manufacturing Facilities and Capabilities
- 9.3.4.4. Recent Developments and Future Outlook
- 9.3.5. Senn Chemicals
- 9.3.5.1. Company Overview
- 9.3.5.2. Service Portfolio
- 9.3.5.3. Manufacturing Facilities and Capabilities
- 9.3.5.4. Recent Developments and Future Outlook
- 9.3.1. Bachem
- 9.4. Peptide Therapeutics Contract API Manufacturers based in Asia-Pacific
- 9.4.1. Auspep
- 9.4.1.1. Company Overview
- 9.4.1.2. Service Portfolio
- 9.4.1.3. Manufacturing Facilities and Capabilities
- 9.4.1.4. Recent Developments and Future Outlook
- 9.4.2. Chinese Peptide
- 9.4.2.1. Company Overview
- 9.4.2.2. Service Portfolio
- 9.4.2.3. Manufacturing Facilities and Capabilities
- 9.4.2.4. Recent Developments and Future Outlook
- 9.4.3. Hybio Pharmaceutical
- 9.4.3.1. Company Overview
- 9.4.3.2. Service Portfolio
- 9.4.3.3. Manufacturing Facilities and Capabilities
- 9.4.3.4. Recent Developments and Future Outlook
- 9.4.4. Peptide Institute
- 9.4.4.1. Company Overview
- 9.4.4.2. Service Portfolio
- 9.4.4.3. Manufacturing Facilities and Capabilities
- 9.4.4.4. Recent Developments and Future Outlook
- 9.4.5. ScinoPharm
- 9.4.5.1. Company Overview
- 9.4.5.2. Service Portfolio
- 9.4.5.3. Manufacturing Facilities and Capabilities
- 9.4.5.4. Recent Developments and Future Outlook
- 9.4.1. Auspep
10. RECENT DEVELOPMENTS AND INITIATIVES
- 10.1. Chapter Overview
- 10.2. Partnerships and Collaborations
- 10.2.1. Partnerships Models
- 10.2.2. List of Partnerships and Collaborations
- 10.2.3. Analysis by Year of Partnership
- 10.2.4. Analysis by Type of Partnership
- 10.2.5. Analysis by Year and Type of Partnership
- 10.2.6. Analysis by Company Size and Type of Partnership
- 10.2.7. Analysis by Scale of Operation
- 10.2.8. Analysis by Scale of Operation and Type of Partnership
- 10.2.9. Analysis by Green Chemistry Integration
- 10.2.10. Most Active Players: Analysis by Number of Partnerships
- 10.2.11. Analysis by Geography
- 10.2.11.1. Intercontinental and Intracontinental Agreements
- 10.2.11.2. Local and International Agreements
- 10.3. Recent Expansion Models
- 10.3.1. Expansion Models
- 10.3.2 List of Recent Expansions
- 10.3.3. Analysis by Year of Expansion
- 10.3.4. Analysis by Type of Expansion
- 10.3.5. Analysis by Year and Type of Expansion
- 10.3.6. Analysis by Location of Expanded Facility (Region)
- 10.3.7. Analysis by Location of Expanded Facility (Country)
- 10.3.8. Recent Expansions: Analysis by Location of Expanded Facility and Type of Expansion
- 10.3.9. Most Active Players: Analysis by Number of Expansions
- 10.3.10. Recent Expansions: Analysis by Geography (Country)
- 10.3.11. Recent Expansions: List of Planned Expansions
- 10.4. Emerging Peptide Synthesis Technologies
- 10.4.1. Chemo-Enzymatic Peptide Synthesis Technology
- 10.4.2. Continuous Flow Technology
- 10.4.3. Green Chemistry
11. CLINICAL TRIAL ANALYSIS
- 11.1. Chapter Overview
- 11.2. Scope and Methodology
- 11.3. Peptide Therapeutics: Clinical Trials Analysis
- 11.3.1. Analysis by Trial Registration Year
- 11.3.2. Analysis by Number of Patients Enrolled
- 11.3.3. Analysis by Trial Phase
- 11.3.4. Analysis by Trial Registration Year and Trial Phase
- 11.3.5. Analysis by Trial Phase and Patients Enrolled
- 11.3.6. Analysis by Trial Status
- 11.3.7. Analysis by Trial Registration Year and Trial Status
- 11.3.8. Analysis by Therapeutic Area
- 11.3.9. Analysis by Mechanism of Action
- 11.3.10. Analysis by Trial Registration Year and Mechanism of Action
- 11.3.11. Analysis by Type of Sponsor / Collaborator
- 11.3.12. Analysis by Study Design
- 11.3.12.1. Analysis by Type of Patient Allocation Model Used
- 11.3.12.2. Analysis by Type of Trial Masking Adopted
- 11.3.12.3. Analysis by Type of Intervention
- 11.3.12.4. Analysis by Trial Purpose
- 11.3.13. Most Active Players: Analysis by Number of Clinical Trials
- 11.3.14. Analysis by Geography
- 11.3.14.1. Analysis of Clinical Trials by Geography
- 11.3.14.2. Analysis of Clinical Trials by Geography and Trial Status
- 11.3.14.3. Analysis of Clinical Trials by Geography and Therapeutic Area
- 11.3.14.4. Analysis of Patients Enrolled by Geography
- 11.3.14.5. Analysis of Patients Enrolled by Geography and Trial Status
12. REGIONAL CAPABILITY ANALYSIS
- 12.1. Chapter Overview
- 12.2. Key Assumptions and Methodology
- 12.3. Overall Landscape of Peptide Therapeutics Contract API Manufacturing Facilities
- 12.4. Peptide Therapeutics Contract API Manufacturing Capability in North America
- 12.5. Peptide Therapeutics Contract API Manufacturing Capability in Europe
- 12.6. Peptide Therapeutics Contract API Manufacturing Capability in Asia-Pacific
13. DEMAND ANALYSIS
- 13.1. Chapter Overview
- 13.2. Assumptions and Methodology
- 13.3. Peptide Therapeutics Contract API Manufacturing: Overall Annual Demand
- 13.3.1. Peptide Therapeutics Contract API Manufacturing: Clinical Demand
- 13.3.1.1. Clinical Demand for Peptide Therapeutics Contract API Manufacturing: Analysis by Phase of Development
- 13.3.2. Peptide Therapeutics Contract API Manufacturing: Commercial Outsourced Demand
- 13.3.2.1. Commercial Demand for Peptide Therapeutics Contract API Manufacturing: Analysis by GLP-1 Mechanism of Action
- 13.3.3. Peptide Therapeutics Contract API Manufacturing: Analysis by Type of Peptide API Synthesis
- 13.3.4. Peptide Therapeutics Contract API Manufacturing: Analysis by Geography
- 13.3.1. Peptide Therapeutics Contract API Manufacturing: Clinical Demand
14. CAPACITY ANALYSIS
- 14.1. Chapter Overview
- 14.2. Key Assumptions and Methodology
- 14.3. Peptide Therapeutics Contract API Manufacturing: Global Installed Capacity
- 14.3.1. Analysis by Company Size
- 14.3.2. Analysis by Scale of Operation
- 14.3.3. Analysis by Location of Manufacturing Facility
- 14.3.4. Analysis by Company Size and Location of Manufacturing Facility
- 14.3.5 Analysis by Chemical Synthesis Method
- 14.4. Concluding Remarks
15. LIKELY PARTNERS ANLAYSIS
- 15.1. Chapter Overview
- 15.2. Scoring Criteria and Key Assumptions
- 15.3. Scope and Methodology
- 15.4. Potential Strategic Partners for Peptide Therapeutics Contract Manufacturers in North America
- 15.4.1. Most Likely Partners
- 15.4.2. Likely Partners
- 15.4.3. Least Likely Partners
- 15.5. Potential Strategic Partners for Peptide Therapeutics Contract Manufacturers in Europe
- 15.5.1. Most Likely Partners
- 15.5.2. Likely Partners
- 15.5.3. Least Likely Partners
- 15.6. Potential Strategic Partners for Peptide Therapeutics Contract Manufacturers in Asia Pacific and Rest of the World
- 15.6.1. Most Likely Partners
- 15.6.2. Likely Partners
- 15.6.3. Least Likely Partners
16. MAKE VERSUS BUY DECISION MAKING FRAMEWORK
- 16.1. Chapter Overview
- 16.2. Assumptions and Parameter Definitions
- 16.3. Make versus Buy Decision Making Framework
- 16.3.1. Scenario 1
- 16.3.2. Scenario 2
- 16.3.3. Scenario 3
- 16.3.4. Scenario 4
- 16.4. Concluding Remarks
17. TOTAL COST OF OWNERSHIP FOR PEPTIDE CONTRACT MANUFACTURING ORGANIZATIONS
- 17.1. Chapter Overview
- 17.2. Assumptions and Methodology
- 17.3. Key Parameters
- 17.4. Total Cost of Ownership for Peptide Therapeutics Contract API Manufacturing Organization, Y0-Y20
- 17.5. Total Cost of Ownership for Peptide Therapeutics Contract API Manufacturing Organization: Analysis by CAPEX And OPEX, Y0 and Y20
- 17.5.1. Total Cost of Ownership for Peptide Therapeutics Contract API Manufacturing Organization: Analysis by CAPEX, Y0
- 17.5.2. Total Cost of Ownership for Peptide Therapeutics Contract API Manufacturing Organization: Analysis by OPEX, Y1-Y20
18. GLOBAL PEPTIDE THERAPEUTICS CONTRACT API MANUFACTURING MARKET
- 18.1. Chapter Overview
- 18.2. Key Assumptions and Methodology
- 18.3. Global Peptide Therapeutics Contract API Manufacturing Market, Historical Trends (since 2021) and Forecasted Estimates (till 2035)
- 18.3.1. Scenario Analysis
- 18.3.1.1. Conservative Scenario
- 18.3.1.2. Optimistic Scenario
- 18.3.1. Scenario Analysis
- 18.4. Key Market Segmentations
19. PEPTIDE THERAPEUTICS CONTRACT API MANUFACTURING MARKET, BY TYPE OF PEPTIDE SYNTHESIS METHOD
- 19.1. Chapter Overview
- 19.2. Key Assumptions and Methodology
- 19.3. Peptide Therapeutics Contract API Manufacturing Market: Distribution by Type of Peptide Synthesis Method, Current Year and 2035
- 19.3.1. Non-chemical Synthesis Method Market: Historical Trends (since 2021) and Forecasted Estimates (till 2035)
- 19.3.2. Chemical Synthesis Method Market: Historical Trends (since 2021) and Forecasted Estimates (till 2035)
- 19.3.2.1 Liquid Phase Synthesis: Historical Trends (since 2021) and Forecasted Estimates (till 2035)
- 19.3.2.2 Solid Phase Synthesis: Historical Trends (since 2021) and Forecasted Estimates (till 2035)
- 19.3.2.3 Hybrid Phase Synthesis: Historical Trends (since 2021) and Forecasted Estimates (till 2035)
- 19.4. Data Triangulation and Validation
20. PEPTIDE THERAPEUTICS CONTRACT API MANUFACTURING MARKET, BY COMPANY SIZE
- 20.1. Chapter Overview
- 20.2. Key Assumptions and Methodology
- 20.3. Peptide Therapeutics Contract API Manufacturing Market: Distribution by Company Size, Current Year and 2035
- 20.3.1. Small Company: Historical Trends (since 2021) and Forecasted Estimates (till 2035)
- 20.3.2. Mid-sized Company: Historical Trends (since 2021) and Forecasted Estimates (till 2035)
- 20.3.3. Large Company: Historical Trends (since 2021) and Forecasted Estimates (till 2035)
- 20.4. Data Triangulation and Validation
21. PEPTIDE THERAPEUTICS CONTRACT API MANUFACTURING MARKET, BY GEOGRAPHY
- 21.1. Chapter Overview
- 21.2. Assumptions and Methodology
- 21.3. Peptide Therapeutics Contract API Manufacturing Market: Distribution by Geography, Current Year and 2035
- 21.3.1. Peptide Therapeutics Contract API Manufacturing Market in North America: Historical Trends (since 2021) and Forecasted Estimates (till 2035)
- 21.3.1.1. Peptide Therapeutics Contract API Manufacturing Market for Small Companies in North America
- 21.3.1.2. Peptide Therapeutics Contract API Manufacturing Market for Mid-sized Companies in North America
- 21.3.1.3. Peptide Therapeutics Contract API Manufacturing Market for Large and Very Large Companies in North America
- 21.3.1.4. Peptide Therapeutics Contract API Manufacturing Market in North America for Chemical Synthesis Method
- 21.3.1.5. Peptide Therapeutics Contract API Manufacturing Market in North America for Non- Chemical Synthesis Method
- 21.3.2. Peptide Therapeutics Contract API Manufacturing Market in Europe: Historical Trends (since 2021) and Forecasted Estimates (till 2035)
- 21.3.2.1. Peptide Therapeutics Contract API Manufacturing Market for Small Companies in Europe
- 21.3.2.2. Peptide Therapeutics Contract API Manufacturing Market for Mid-sized Companies in Europe
- 21.3.2.3. Peptide Therapeutics Contract API Manufacturing Market for Large and Very Large Companies in Europe
- 21.3.2.4. Peptide Therapeutics Contract API Manufacturing Market in Europe for Chemical Synthesis Method
- 21.3.2.5. Peptide Therapeutics Contract API Manufacturing Market in Europe for Non-Chemical Synthesis Method
- 21.3.3. Peptide Therapeutics Contract API Manufacturing Market in Asia-Pacific and Rest of the World: Historical Trends (since 2021) and Forecasted Estimates (till 2035)
- 21.3.3.1. Peptide Therapeutics Contract API Manufacturing Market for Small Companies in Asia- Pacific and Rest of the World
- 21.3.3.2. Peptide Therapeutics Contract API Manufacturing Market for Mid-sized Companies in Asia- Pacific and Rest of the World
- 21.3.3.3. Peptide Therapeutics Contract API Manufacturing Market for Large and Very Large Companies in Asia-Pacific and Rest of the World
- 21.3.3.4. Peptide Therapeutics Contract API Manufacturing Market in Asia-Pacific and Rest of the World for Chemical Synthesis Method
- 21.3.3.5. Peptide Therapeutics Contract API Manufacturing Market in Asia-Pacific and Rest of the World for Non-Chemical Synthesis Method
- 21.3.1. Peptide Therapeutics Contract API Manufacturing Market in North America: Historical Trends (since 2021) and Forecasted Estimates (till 2035)
- 21.4. Data Triangulation and Validation
22. SWOT ANALYSIS
- 22.1. Chapter Overview
- 22.2. Strengths
- 22.3. Weaknesses
- 22.4. Opportunities
- 22.5. Threats
- 22.6. Comparison of SWOT Factors
- 22.7. Concluding Remarks
23. CONCLUSION
24. EXECUTIVE INSIGHTS
- 24.1. Chapter Overview
- 24.2. Ascendia Pharmaceuticals
- 24.2.1. Company Snapshot
- 24.2.2. Interview Transcript: Chief Business Officer, and Senior Director of Scientific Affairs and Technical Marketing
- 24.3. Almac
- 24.3.1. Company Snapshot
- 24.3.2. Interview Transcript: Vice President, Peptides
- 24.4. NUMAFERM
- 24.4.1. Company Snapshot
- 24.4.2. Interview Transcript: Chief Financial Officer
- 24.5. Sekisui XenoTech
- 24.5.1. Company Snapshot
- 24.5.2. Interview Transcript: Senior Manager, Peptide Business Project Leader
- 24.6. Previtalica
- 24.6.1. Company Snapshot
- 24.6.2. Interview Transcript: Founder and Owner

