
自動リキッドハンドリングシステム市場:業界動向と世界の予測 - ピペッティング技術別、洗浄技術別、モダリティ別、機器タイプ別、用途別、エンドユーザー別、主要地域別
Automated Liquid Handling Systems Market: Industry Trends and Global Forecasts - Distribution by Pipetting Technology, Washing Technology, Modality, Type of Instrument, Application, End User and Key Geographical Regions- 発行日
- ページ情報
- 英文 292 Pages
- 納期
- 即日から翌営業日
- 商品コード
- 1771287
- カスタマイズ可能 お客様のご希望に応じて、既存データの加工や未掲載情報(例:国別セグメント)の追加などの対応が可能です。詳細はお問い合わせください。
- 翻訳ツール提供対象 PDF対応AI翻訳ツールの無料貸し出しサービスのご利用が可能です
- 医薬品関連専門 医薬品関連専門を専門とする市場調査会社です。
概要
世界の自動リキッドハンドリングシステム市場:概要
世界の自動リキッドハンドリングシステムの市場規模は、2035年までの予測期間中に6.9%のCAGRで拡大し、現在の32億6,000万米ドルから2035年までに63億5,000万米ドルに成長すると予測されています。
市場セグメンテーションでは、市場規模と機会分析を以下のパラメータで区分しています:
ピペッティング技術
- 接触技術
- 空気置換技術
- ピストン/容積式技術
- 音響技術
- フリージェット技術
洗浄技術
- 超音波技術
- 音響技術
- 遠心技術
モダリティ
- 固定チップ
- ディスポーザブルチップ
機器タイプ
- スタンドアロン
- ベンチトップ型ワークステーション
- マルチ機器システム
- その他
用途
- 連続希釈
- プレート複製
- PCR/qPCRセットアップ
- プレート再フォーマット
- ハイスループットスクリーニング
- 全ゲノム増幅
- 細胞培養
- ELISA
- セルベースアッセイ
- ビーズ洗浄
- その他
エンドユーザー
- バイオテクノロジーおよび製薬会社
- 学術機関および政府研究機関
- 病院および診断センター
- その他
主要地域
- 北米
- 欧州
- アジア太平洋
- 中東・北アフリカ
- ラテンアメリカ
世界の自動リキッドハンドリングシステム市場:成長と動向
近年、バイオ医薬品の分野では、自動化システムの出現を含め、ラボラトリーサイエンスの分野でいくつかの進歩を目の当たりにしてきました。製薬業界における自動リキッドハンドリングシステムの使用は、現代のラボの運営方法に革命をもたらしました。自動リキッドハンドリングシステムが提供する手動方式に対する利点が、主にこの市場の成長を後押ししています。さらに、処理能力の向上、精度の向上、大幅な時間短縮を可能にするワークフローの改善により、現在ではますます多くのラボがこれらのシステムを採用しています。これは、過去20年間における検査室の競争力を高めるために行われています。しかし、自動リキッドハンドラーの潜在能力をフルに活用し、将来の成長を維持するためには、様々なハードルや既存の課題に対処することが重要です。
特に、多くの利害関係者は、液体分注機能を備えた自動リキッドハンドリングシステムの開発など、ラボオートメーションの進歩を取り入れることに注力しています。現在、125社以上の企業が自動分注システム/自動マイクロプレートウォッシャーを含む自動リキッドハンドラーの製造に携わっています。
自動リキッドハンドリングシステムの世界市場:主要インサイト
この調査レポートは、世界の自動リキッドハンドリングシステム市場の現状を調査し、業界内の潜在的な成長機会を特定しています。当レポートの主な調査結果は以下の通りです。
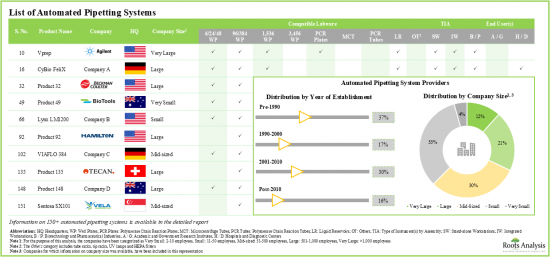
- 現在、世界中の70の老舗企業が150以上の自動ピペッティングシステムを提供していると主張しており、これらのシステムの70%以上は統合ワークステーションとして使用できます。
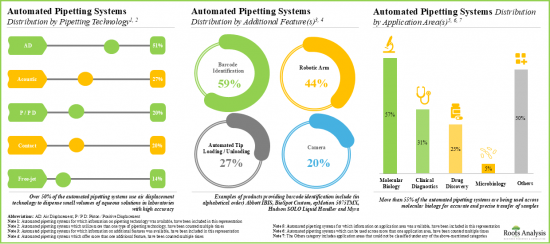
- 自動分注システムは、再現性とワークフローの正確性を高める高度な機能を備えています。システムの60%近くは、サンプル試薬を便利に追跡できるバーコード識別機能を備えています。
- この業界で競合優位性を築くため、利害関係者は製品ポートフォリオを充実させるべく、既存の自動分注システムを積極的にアップグレードしています。
- 調査中、バイオ医薬品および製薬業界で様々な用途に使用されている100以上の自動マイクロプレート洗浄機を確認しました。
- 自動マイクロプレートウォッシャーの80%近くは、サンプル調製に柔軟性を提供するスタンドアロン型ワークステーションとして使用されており、そのようなシステムの95%以上は平板マイクロプレートに対応しています。
- このようなシステムの95%以上が平板マイクロプレートと互換性があります。各社が、進化する業界ベンチマークに準拠するため、自動マイクロプレート洗浄機に高度な機能を統合することに注力していることは注目に値します。
- この分野でのパートナーシップ活動はCAGR30%以上で増加しており、実際、自動リキッドハンドリングシステムに関連する取引は過去3年間で最も多く結ばれています。
- 自動リキッドハンドリングシステムに関連する約500件の特許が最近、様々な利害関係者別出願/付与されており、この分野における技術革新のペースが高まっていることを示しています。
- 自動分注システムに対する需要の高まりに伴い、市場は2035年まで年率6.9%以上で成長すると予想されています。
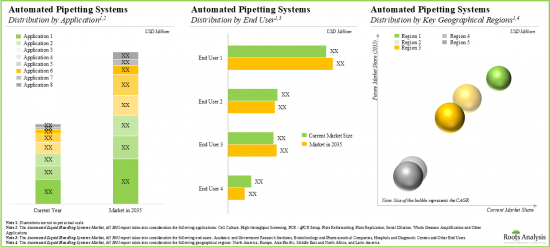
- 現在と将来の自動分注装置市場の機会は、様々な用途、エンドユーザー、主要な地域にわたって十分に分散していると思われます。
- 自動マイクロプレートウォッシャーの領域における成長は、主に音響技術の需要の高まり別牽引されると予測されており、北米が2035年までに市場の大きなシェア(35%)を獲得すると予測されています。
自動リキッドハンドリングシステムの世界市場:主要セグメント
空気置換技術セグメントが自動リキッドハンドリングシステム市場で最大シェアを占めています。
ピペッティング技術別では、市場は接触技術、エアディスプレイスメント技術、ピストン/ポジティブディスプレイスメント技術、音響技術、フリージェット技術に区分されます。現在、自動リキッドハンドリングシステム世界市場の大半のシェア(~30%)を占めているのはエア置換技術セグメントです。また、音響技術セグメントは、他のセグメントに比べて速いペースで成長する可能性が高いです。
モダリティ別では、ディスポーザブルチップが自動リキッドハンドリングシステムの世界市場で急成長しています。
モダリティ別では、市場は固定チップとディスポーザブルチップに区分されます。現在、自動リキッドハンドリングシステムの世界市場において、ディスポーザブルチップセグメントが最も高い割合(~75%)を占めています。ディスポーザブルチップセグメントの自動リキッドハンドリングシステム市場は、比較的高いCAGRで成長する可能性が高いことは注目に値します。
自動リキッドハンドリングシステム市場の機器タイプ別シェアはスタンドアローンセグメントが最大
機器タイプ別では、市場はスタンドアロン、個別ベンチトップワークステーション、マルチ装置システム、その他に区分されます。現在、自動リキッドハンドリングシステム市場では、スタンドアロン型が最大シェア(~35%)を占めています。また、マルチインストルメントシステムセグメントは比較的高いCAGRで成長すると思われます。
用途別では、ハイスループット・スクリーニング・セグメントが予測期間中に自動リキッドハンドリングシステム市場で最も急成長するセグメントです。
市場は用途別に、連続希釈、プレート複製、PCR/qPCRセットアップ、プレート再フォーマット、ハイスループットスクリーニング、全ゲノム増幅、細胞培養、ELISA、セルベースアッセイ、ビーズ洗浄、その他の用途に区分されます。現在、自動リキッドハンドリングシステム市場では、連続希釈分野が最も高い比率(30%以上)を占めています。さらに、ハイスループットスクリーニング用の自動リキッドハンドリングシステム市場は、比較的高いCAGRで成長する可能性が高いことは注目に値します。
バイオテクノロジーと製薬会社セグメントが自動リキッドハンドリングシステム世界市場の最大シェアを占める
エンドユーザー別では、市場はバイオテクノロジーおよび製薬会社、学術および政府研究機関、病院および診断センター、その他に区分されます。現在、バイオテクノロジーおよび製薬会社セグメントが世界の自動リキッドハンドリングシステム市場で最大シェア(~45%)を占めています。この動向は今後も変わらないと思われます。
北米が市場の最大シェアを占めます。
主要地域別に見ると、市場は北米、欧州、アジア太平洋、ラテンアメリカ、中東・北アフリカに区分されます。現在、北米(~45%)が自動リキッドハンドリングシステム市場を独占し、最大の収益シェアを占めています。しかし、アジア太平洋の市場はより高いCAGRで成長すると予想されています。
自動リキッドハンドリングシステム市場の参入企業例
- Agilent Technologies
- Beckman Coulter Life Sciences
- Eppendorf
- Hamilton Robotics
- MyGenostics
- Tecan
- Thermo Fisher Scientific
当レポートでは、世界の自動リキッドハンドリングシステム市場について調査し、市場の概要とともに、ピペッティング技術別、洗浄技術別、モダリティ別、機器タイプ別、用途別、エンドユーザー別動向、地域別の動向、および市場に参入する企業のプロファイルなどを提供しています。
目次
第1章 序文
第2章 エグゼクティブサマリー
第3章 イントロダクション
- 章の概要
- 自動リキッドハンドリングシステムの概要
- 手動と自動の液体処理
- 自動ピペッティングシステム
- 自動マイクロプレートウォッシャー
- 自動リキッドハンドリングシステムの用途
- 自動リキッドハンドリングシステムの導入における課題
- 将来の展望
第4章 自動ピペッティングシステム:市場情勢
- 章の概要
- 自動ピペッティングシステム:市場情勢
- 自動ピペッティングシステムプロバイダーの情勢
第5章 自動ピペッティングシステムプロバイダー:競争力分析
- 章の概要
- 前提と主要なパラメータ
- 調査手法
- 企業競争力分析:自動ピペッティングシステムプロバイダー
- 北米に拠点を置く企業(ピアグループI)
- 欧州に拠点を置く企業(ピアグループII)
- アジア太平洋およびその他の地域に拠点を置く企業(ピアグループIII)
第6章 自動ピペッティングシステムプロバイダー:企業プロファイル
- 章の概要
- Beckman Coulter Life Sciences
- Eppendorf
- Hamilton Robotics
- MyGenostics
第7章 自動マイクロプレートウォッシャー:市場情勢
- 章の概要
- 自動マイクロプレートウォッシャー:市場情勢
- 自動マイクロプレートウォッシャープロバイダーの情勢
第8章 自動マイクロプレートウォッシャープロバイダー:競争力分析
- 章の概要
- 前提と主要なパラメータ
- 調査手法
- 企業競争力分析:自動マイクロプレートウォッシャープロバイダー
- 北米に拠点を置く企業(ピアグループI)
- 欧州に拠点を置く企業(ピアグループII)
- アジア太平洋およびその他の地域に拠点を置く企業(ピアグループIII)
第9章 自動マイクロプレートウォッシャープロバイダー:企業プロファイル
- 章の概要
- Agilent Technologies
- Tecan
- Thermo Fisher Scientific
第10章 パートナーシップとコラボレーション
- 章の概要
- パートナーシップモデル
- 自動リキッドハンドリングシステム:パートナーシップとコラボレーション
第11章 特許分析
- 章の概要
- 範囲と調査手法
- 自動リキッドハンドリングシステム:特許分析
- 自動リキッドハンドリングシステム:特許ベンチマーク分析
- 自動リキッドハンドリングシステム:特許評価分析
- 主要特許:引用数別分析
第12章 市場規模の評価と機会分析
- 章の概要
- 調査手法と主要な前提
- 世界の自動リキッドハンドリングシステム市場(2035年まで)
第13章 SWOT分析
- 章の概要
- 自動リキッドハンドリングシステム:SWOT分析
- SWOT要因の比較
- 結論
第14章 結論
第15章 付録I:表形式データ
第16章 付録II:企業および組織の一覧
図表
List of Tables
- Table 3.1 Manual, Semi-automated and Automated Pipetting Systems
- Table 4.1 Automated Pipetting Systems: Information on Type of Technology, Pipetting Technology, Certification(s) and Type of Instrument(s) by Assembly
- Table 4.2 Automated Pipetting Systems: Information on Pipetting Head Option(s), Weight of Automated Pipetting System (in Kg), Compatible Labware and Application Area(s)
- Table 4.3 Automated Pipetting Systems: Information on Application(s), Additional Feature(s) and End User(s)
- Table 4.4 Automated Pipetting System Providers: Information on Year of Establishment, Employee Count, Company Size, Location and Region of Headquarters
- Table 6.1 Automated Pipetting System Manufacturers: List of Companies Profiled
- Table 6.2 Beckman Coulter Life Sciences: Company Snapshot
- Table 6.3 Beckman Coulter Life Sciences: Echo 525
- Table 6.4 Beckman Coulter Life Sciences: Echo 550
- Table 6.5 Beckman Coulter Life Sciences: Echo 650
- Table 6.6 Beckman Coulter Life Sciences: Echo 655
- Table 6.7 Beckman Coulter Life Sciences: Biomek 3000
- Table 6.8 Beckman Coulter Life Sciences: Biomek i5
- Table 6.9 Beckman Coulter Life Sciences: Biomek i7
- Table 6.10 Beckman Coulter Life Sciences: Biomek NGeniuS
- Table 6.11 Beckman Coulter Life Sciences: Sagian Multipette Automated Liquid Handler
- Table 6.12 Beckman Coulter Life Sciences: Biomek 4000
- Table 6.13 Beckman Coulter Life Sciences: Recent Developments and Future Outlook
- Table 6.14 Eppendorf: Company Snapshot
- Table 6.15 Eppendorf: epMotion 5075v
- Table 6.16 Eppendorf: epMotion 5075t
- Table 6.17 Eppendorf: epMotion 5075l
- Table 6.18 Eppendorf: epMotion 5075m
- Table 6.19 Eppendorf: epMotion 5075vt
- Table 6.20 Eppendorf: epMotion 5075MC
- Table 6.21 Eppendorf: epMotion 5075TMX
- Table 6.22 Eppendorf: epMotion 5075VAC
- Table 6.23 Eppendorf: epMotion 5075LH
- Table 6.24 Eppendorf: epMotion 5073t NGS solution
- Table 6.25 Eppendorf: epMotion 96/96xl
- Table 6.26 Eppendorf: epMotion 5070
- Table 6.27 Eppendorf: Recent Developments and Future Outlook
- Table 6.28 Hamilton Robotics: Company Snapshot
- Table 6.29 Hamilton Robotics: Microlab STAR
- Table 6.30 Hamilton Robotics: Microlab VANTAGE
- Table 6.31 Hamilton Robotics: NIMBUS384
- Table 6.32 Hamilton Robotics: NIMBUS4
- Table 6.33 Hamilton Robotics: NIMBUS96
- Table 6.34 Hamilton Robotics: Recent Developments and Future Outlook
- Table 6.35 MyGenostics: Company Snapshot
- Table 6.36 MyGenostics: MGS-96
- Table 6.37 MyGenostics: MGN-H200/H1000
- Table 6.38 MyGenostics: MGN-SIRO-4000
- Table 6.39 MyGenostics: SIRO-3000
- Table 7.1 Automated Microplate Washers: Information on Type of Instrument(s) by Assembly and Compatible Microplate(s)
- Table 7.2 Automated Microplate Washers: Information on Weight of Automated Microplate Washer (in Kg), Compatible Software and Compatible Labware
- Table 7.3 Automated Microplate Washers: Information on Application Area(s), Application(s) and End User(s)
- Table 7.4 Automated Microplate Washer Providers: Information on Year of Establishment, Employee Count, Company Size, Location and Region of Headquarters
- Table 9.1 Automated Microplate Washer Manufacturers: List of Companies Profiled
- Table 9.2 Agilent Technologies: Company Snapshot
- Table 9.3 Agilent Technologies: BioTek ELX405s
- Table 9.4 Agilent Technologies: BioTek ELx405 Select
- Table 9.5 Agilent Technologies: ELx405 HT
- Table 9.6 Agilent Technologies: ELx405 Magna
- Table 9.7 Agilent Technologies: Biotek 405TS
- Table 9.8 Agilent Technologies: BioTek 50 TS
- Table 9.9 Agilent Technologies: EL406 Microplate Washer Dispenser
- Table 9.10 Agilent Technologies: 405 LS
- Table 9.11 Agilent Technologies: Recent Developments and Future Outlook
- Table 9.12 Tecan: Company Snapshot
- Table 9.13 Tecan: HydroFlex
- Table 9.14 Tecan: 96 PW
- Table 9.15 Tecan: HydroFlex Plus
- Table 9.16 Tecan: HydroSpeed
- Table 9.17 Tecan: Recent Developments and Future Outlook
- Table 9.18 Thermo Fisher Scientific: Company Snapshot
- Table 9.19 Thermo Fisher Scientific: Wellwash Versa
- Table 9.20 Thermo Fisher Scientific: Wellwash
- Table 9.21 Thermo Fisher Scientific: accuWash
- Table 9.22 Thermo Fisher Scientific: accuWash Versa
- Table 9.23 Thermo Fisher Scientific: Recent Developments and Future Outlook
- Table 10.1 Automated liquid Handling Systems: List of Partnerships and Collaborations
- Table 11.1 Patent Analysis: Top CPC Sections
- Table 11.2 Patent Analysis: Top Five CPC Symbols
- Table 11.3 Patent Analysis: Top Seven CPC Codes
- Table 11.4 Patent Analysis: Summary of Benchmarking Analysis
- Table 11.5 Patent Analysis: Categorization based on Weighted Valuation Scores
- Table 11.6 Patent Portfolio: List of Leading Patents (by Highest Relative Valuation)
- Table 11.7 Patent Portfolio: List of Leading Patents (by Number of Citations)
- Table 15.1 Automated Pipetting Systems: Distribution by Type of Technology
- Table 15.2 Automated Pipetting Systems: Distribution by Pipetting Technology
- Table 15.3 Automated Pipetting Systems: Distribution by Certification(s)
- Table 15.4 Automated Pipetting Systems: Distribution by Type of Instrument(s) by Assembly
- Table 15.5 Automated Pipetting Systems: Distribution by Pipetting Head Option(s)
- Table 15.6 Automated Pipetting Systems: Distribution by Weight of Automated Pipetting Systems (in Kg)
- Table 15.7 Automated Pipetting Systems: Distribution by Compatible Labware
- Table 15.8 Automated Pipetting Systems: Distribution by Application Area(s)
- Table 15.9 Automated Pipetting Systems: Distribution by Application(s)
- Table 15.10 Automated Pipetting Systems: Distribution by Additional Feature(s)
- Table 15.11 Automated Pipetting Systems: Distribution by End User(s)
- Table 15.12 Automated Pipetting System Providers: Distribution by Year of Establishment
- Table 15.13 Automated Pipetting System Providers: Distribution by Company Size
- Table 15.14 Automated Pipetting System Providers: Distribution by Location of Headquarters (Region-wise)
- Table 15.15 Automated Pipetting System Providers: Distribution by Company Size and Location of Headquarters (Region-wise)
- Table 15.16 Automated Pipetting System Providers: Distribution by Location of Headquarters (Country-wise)
- Table 15.17 Most Active Players: Distribution by Number of Automated Pipetting Systems Manufactured
- Table 15.18 Beckman Coulter Life Sciences: Annual Revenues, Since 2018 (USD Billion)
- Table 15.19 Eppendorf: Annual Revenues, Since 2018 (USD Billion)
- Table 15.20 Automated Microplate Washers: Distribution by Type of Instrument(s) by Assembly
- Table 15.21 Automated Microplate Washers: Distribution by Compatible Microplate(s)
- Table 15.22 Automated Microplate Washers: Distribution by Weight of Automated Microplate Washer (in Kg)
- Table 15.23 Automated Microplate Washers: Distribution by Compatible Labware
- Table 15.24 Automated Microplate Washers: Distribution by Application Area(s)
- Table 15.25 Automated Microplate Washers: Distribution by Application(s)
- Table 15.26 Automated Microplate Washers: Distribution by End User(s)
- Table 15.27 Automated Microplate Washer Providers: Distribution by Year of Establishment
- Table 15.28 Automated Microplate Washer Providers: Distribution by Company Size
- Table 15.29 Automated Microplate Washer Providers: Distribution by Location of Headquarters (Region-wise)
- Table 15.30 Automated Microplate Washer Providers: Distribution by Company Size and Location of Headquarters (Region-wise)
- Table 15.31 Automated Microplate Washer Providers: Distribution by Location of Headquarters (Country-wise)
- Table 15.32 Most Active Players: Distribution by Number of Compatible Software
- Table 15.33 Most Active Players: Distribution by Number of Automated Microplate Washers Manufactured
- Table 15.34 Agilent Technologies: Annual Revenues, Since 2018 (USD Billion)
- Table 15.35 Tecan: Annual Revenues, Since 2018 (CHF Million)
- Table 15.36 Thermo Fisher Scientific: Annual Revenues, Since 2018 (USD Billion)
- Table 15.37 Partnerships and Collaborations: Distribution by Year of Partnership, Since 2018
- Table 15.38 Partnerships and Collaborations: Distribution by Type of Partnership
- Table 15.39 Partnerships and Collaborations: Distribution by Year and Type of Partnership, Since 2018
- Table 15.40 Partnerships and Collaborations: Distribution by Type of Automated Liquid Handling System(s)
- Table 15.41 Partnerships and Collaborations: Distribution by Product and Type of Partnership
- Table 15.42 Most Popular Products: Distribution by Number of Partnerships
- Table 15.43 Most Active Players: Distribution by Type of Partnership
- Table 15.44 Partnerships and Collaborations: Local and International Agreements
- Table 15.45 Partnerships and Collaborations: Intracontinental and Intercontinental Agreements
- Table 15.46 Patent Analysis: Distribution by Type of Patent
- Table 15.47 Patent Analysis: Cumulative Distribution by Patent Publication Year, Since 2017
- Table 15.48 Patent Analysis: Year-wise Distribution by Granted Patents and Patent Applications, Since 2017
- Table 15.49 Patent Analysis: Distribution by Geography
- Table 15.50 Patent Analysis: Distribution by CPC Sections
- Table 15.51 Patent Analysis: Cumulative Year-wise Distribution by Type of Organization, Since 2017
- Table 15.52 Leading Industry Players: Distribution by Number of Patents
- Table 15.53 Leading Non-Industry Players: Distribution by Number of Patents
- Table 15.54 Leading Individual Assignees: Distribution by Number of Patents
- Table 15.55 Patent Analysis: Distribution by Patent Age
- Table 15.56 Automated Liquid Handling Systems: Patent Valuation Analysis
- Table 15.57 Global Automated Liquid Handling Systems Market, Till 2035
- Table 15.58 Automated Liquid Handling Systems Market: Distribution by Type of Automated Liquid Handling System
- Table 15.59 Automated Pipetting Systems Market: Till 2035
- Table 15.60 Automated Pipetting Systems Market: Distribution by Pipetting Technology
- Table 15.61 Automated Pipetting Systems Market for Contact Technology: Conservative, Base and Optimistic Scenarios, Till 2035
- Table 15.62 Automated Pipetting Systems Market for Air Displacement Technology: Conservative, Base and Optimistic Scenarios, Till 2035
- Table 15.63 Automated Pipetting Systems Market for Piston / Positive Displacement Technology: Conservative, Base and Optimistic Scenarios, Till 2035
- Table 15.64 Automated Pipetting Systems Market for Acoustic Technology: Conservative, Base and Optimistic Scenarios: Till 2035
- Table 15.65 Automated Pipetting Systems Market for Free-jet Technology: Conservative, Base and Optimistic Scenarios: Till 2035
- Table 15.66 Automated Pipetting Systems Market: Distribution by Modality
- Table 15.67 Automated Pipetting Systems Market for Fixed Tips: Conservative, Base and Optimistic Scenarios, Till 2035
- Table 15.68 Automated Pipetting Systems Market for Disposable Tips: Conservative, Base and Optimistic Scenarios, Till 2035
- Table 15.69 Automated Pipetting Systems Market: Distribution by Type of Instrument
- Table 15.70 Automated Pipetting Systems Market for Standalone: Conservative, Base and Optimistic Scenarios, Till 2035
- Table 15.71 Automated Pipetting Systems Market for Individual Benchtop Workstation: Conservative, Base and Optimistic Scenarios, Till 2035
- Table 15.72 Automated Pipetting Systems Market for Multi Instrument System: Conservative, Base and Optimistic Scenarios, Till 2035
- Table 15.73 Automated Pipetting Systems Market for Others: Conservative, Base and Optimistic Scenarios, Till 2035
- Table 15.74 Automated Pipetting Systems Market: Distribution by Application
- Table 15.75 Automated Pipetting Systems Market for Serial Dilution: Conservative, Base and Optimistic Scenarios, Till 2035
- Table 15.76 Automated Pipetting Systems Market for Plate Replication: Conservative, Base and Optimistic Scenarios, Till 2035
- Table 15.77 Automated Pipetting Systems Market for PCR / qPCR Setup: Conservative, Base and Optimistic Scenarios, Till 2035
- Table 15.78 Automated Pipetting Systems Market for Plate Reformatting: Conservative, Base and Optimistic Scenarios, Till 2035
- Table 15.79 Automated Pipetting Systems Market for High-throughput Screening: Conservative, Base and Optimistic Scenarios, Till 2035
- Table 15.80 Automated Pipetting Systems Market for Whole Genome Amplification: Conservative, Base and Optimistic Scenarios, Till 2035
- Table 15.81 Automated Pipetting Systems Market for Cell Culture: Conservative, Base and Optimistic Scenarios, Till 2035
- Table 15.82 Automated Pipetting Systems Market for Other Applications: Conservative, Base and Optimistic Scenarios, Till 2035
- Table 15.83 Automated Pipetting Systems Market: Distribution by End User
- Table 15.84 Automated Pipetting Systems Market for Biotechnology and Pharmaceutical Companies: Conservative, Base and Optimistic Scenarios, Till 2035
- Table 15.85 Automated Pipetting Systems Market for Academic and Government Research Institutes: Conservative, Base and Optimistic Scenarios, Till 2035
- Table 15.86 Automated Pipetting Systems Market for Hospitals and Diagnostic Centers: Conservative, Base and Optimistic Scenarios, Till 2035
- Table 15.87 Automated Pipetting Systems Market for Other End Users: Conservative, Base and Optimistic Scenarios, Till 2035
- Table 15.88 Automated Pipetting Systems Market: Distribution by Key Geographical Regions
- Table 15.89 Automated Pipetting Systems Market in North America: Conservative, Base and Optimistic Scenarios, Till 2035
- Table 15.90 Automated Pipetting Systems Market in Europe: Conservative, Base and Optimistic Scenarios, Till 2035
- Table 15.91 Automated Pipetting Systems Market in Asia-Pacific: Conservative, Base and Optimistic Scenarios, Till 2035
- Table 15.92 Automated Pipetting Systems Market in Middle East and North Africa: Conservative, Base and Optimistic Scenarios, Till 2035
- Table 15.93 Automated Pipetting Systems Market in Latin America: Conservative, Base and Optimistic Scenarios, Till 2035
- Table 15.94 Automated Microplate Washers Market: Till 2035
- Table 15.95 Automated Microplate Washers Market: Distribution by Washing Technology
- Table 15.96 Automated Microplate Washers Market for Ultrasonic Technology: Conservative, Base and Optimistic Scenarios, Till 2035
- Table 15.97 Automated Microplate Washers Market for Acoustic Technology: Conservative, Base and Optimistic Scenarios, Till 2035
- Table 15.98 Automated Microplate Washers Market for Centrifugal Technology: Conservative, Base and Optimistic Scenarios, Till 2035
- Table 15.99 Automated Microplate Washers Market: Distribution by Application
- Table 15.100 Automated Microplate Washers Market for ELISA: Conservative, Base and Optimistic Scenarios, Till 2035
- Table 15.101 Automated Microplate Washers Market for Cell-based Assays: Conservative, Base and Optimistic Scenarios, Till 2035
- Table 15.102 Automated Microplate Washers Market for Bead Washing: Conservative, Base and Optimistic Scenarios, Till 2035
- Table 15.103 Automated Microplate Washers Market for Other Applications: Conservative, Base and Optimistic Scenarios, Till 2035
- Table 15.104 Automated Microplate Washers Market: Distribution by End User
- Table 15.105 Automated Microplate Washers Market for Biotechnology and Pharmaceutical Companies: Conservative, Base and Optimistic Scenarios, Till 2035
- Table 15.106 Automated Microplate Washers Market for Academic and Government Research Institutes: Conservative, Base and Optimistic Scenarios, Till 2035
- Table 15.107 Automated Microplate Washers Market for Hospitals and Diagnostic Centers: Conservative, Base and Optimistic Scenarios, Till 2035
- Table 15.108 Automated Microplate Washers Market for Other End Users: Conservative, Base and Optimistic Scenarios, Till 2035
- Table 15.109 Automated Microplate Washers Market: Distribution by Key Geographical Regions
- Table 15.110 Automated Microplate Washers Market in North America: Conservative, Base and Optimistic Scenarios, Till 2035
- Table 15.111 Automated Microplate Washers Market in Europe: Conservative, Base and Optimistic Scenarios, Till 2035
- Table 15.112 Automated Microplate Washers Market in Asia-Pacific: Conservative, Base and Optimistic Scenarios, Till 2035
- Table 15.113 Automated Microplate Washers Market in Middle East and North Africa: Conservative, Base and Optimistic Scenarios, Till 2035
- Table 15.114 Automated Microplate Washers Market in Latin America: Conservative, Base and Optimistic Scenarios, Till 2035
List of Figures
- Figure 2.1. Executive Summary: Current Market Landscape of Automated Pipetting Systems
- Figure 2.2. Executive Summary: Current Market Landscape of Automated Microplate Washers
- Figure 2.3. Executive Summary: Partnerships and Collaborations
- Figure 2.4. Executive Summary: Patent Analysis
- Figure 2.5. Executive Summary: Market Sizing and Opportunity Analysis
- Figure 3.1. Manual versus Automated Liquid Handling
- Figure 3.2. Working Mechanism of Automated Pipetting Systems
- Figure 3.3. Advantages of Automated Pipetting Systems
- Figure 3.4. Features of an Ideal Automated Microplate Washer
- Figure 3.5. Applications of Automated Liquid Handling Systems
- Figure 4.1. Automated Pipetting Systems: Distribution by Type of Technology
- Figure 4.2. Automated Pipetting Systems: Distribution by Pipetting Technology
- Figure 4.3. Automated Pipetting Systems: Distribution by Certification(s)
- Figure 4.4. Automated Pipetting Systems: Distribution by Type of Instrument(s) by Assembly
- Figure 4.5. Automated Pipetting Systems: Distribution by Pipetting Head Option(s)
- Figure 4.6. Automated Pipetting Systems: Distribution of Weight of Automated Pipetting Systems (in Kg)
- Figure 4.7. Automated Pipetting Systems: Distribution by Compatible Labware
- Figure 4.8. Automated Pipetting Systems: Distribution by Application Area(s)
- Figure 4.9. Automated Pipetting Systems: Distribution by Application(s)
- Figure 4.10. Automated Pipetting Systems: Distribution by Additional Feature (s)
- Figure 4.11. Automated Pipetting Systems: Distribution by End User(s)
- Figure 4.12. Automated Pipetting System Providers: Distribution by Year of Establishment
- Figure 4.13. Automated Pipetting System Providers: Distribution by Company Size
- Figure 4.14. Automated Pipetting System Providers: Distribution by Location of Headquarters (Region-wise)
- Figure 4.15. Automated Pipetting System Providers: Distribution by Company Size and Location of Headquarters (Region-wise)
- Figure 4.16. Automated Pipetting System Providers: Distribution by Location of Headquarters (Country-wise)
- Figure 4.17. Most Active Players: Distribution by Number of Automated Pipetting Systems Manufactured
- Figure 5.1. Company Competitiveness Analysis: Automated Pipetting System Providers based in North America (Peer Group I)
- Figure 5.2. Company Competitiveness Analysis: Automated Pipetting System Providers based in Europe (Peer Group II)
- Figure 5.3. Company Competitiveness Analysis: Automated Pipetting System Providers based in Asia-Pacific and Rest of the World (Peer Group III)
- Figure 6.1. Beckman Coulter Life Sciences: Annual Revenues, Since 2018 (USD Billion)
- Figure 6.2. Eppendorf: Annual Revenues, Since 2018 (USD Billion)
- Figure 7.1. Automated Microplate Washers: Distribution by Type of Instrument(s) by Assembly
- Figure 7.2. Automated Microplate Washers: Distribution by Compatible Microplate(s)
- Figure 7.3. Automated Microplate Washers: Distribution by Weight of Automated Microplate Washer (in Kg)
- Figure 7.4. Automated Microplate Washers: Distribution by Compatible Labware
- Figure 7.5. Automated Microplate Washers: Distribution by Application Area(s)
- Figure 7.6. Automated Microplate Washers: Distribution by Application(s)
- Figure 7.7. Automated Microplate Washers: Distribution by End User(s)
- Figure 7.8. Automated Microplate Washer Providers: Distribution by Year of Establishment
- Figure 7.9. Automated Microplate Washer Providers: Distribution by Company Size
- Figure 7.10. Automated Microplate Washer Providers: Distribution by Location of Headquarters (Region-wise)
- Figure 7.11. Automated Microplate Washer Providers: Distribution by Company Size and Location of Headquarters (Region-wise)
- Figure 7.12. Automated Microplate Washer Providers: Distribution by Location Headquarters (Country-wise)
- Figure 7.13. Most Active Players: Distribution by Number of Compatible Software
- Figure 7.14. Most Active Players: Distribution by Number of Automated Microplate Washers Manufactured
- Figure 8.1. Company Competitiveness Analysis: Automated Microplate Washer Providers based in North America (Peer Group I)
- Figure 8.2. Company Competitiveness Analysis: Automated Microplate Washer Providers based in Europe (Peer Group II)
- Figure 8.3. Company Competitiveness Analysis: Automated Microplate Washer Providers based in Asia-Pacific and Rest of the World (Peer Group III)
- Figure 9.1. Agilent Technologies: Annual Revenues, Since 2018 (USD Billion)
- Figure 9.2. Tecan: Annual Revenues, Since 2018 (CHF Million)
- Figure 9.3. Thermo Fisher Scientific: Annual Revenues, Since 2018 (USD Billion)
- Figure 10.1. Partnerships and Collaborations: Distribution by Year of Partnership, Since 2018
- Figure 10.2. Partnerships and Collaborations: Distribution by Type of Partnership
- Figure 10.3. Partnerships and Collaborations: Distribution by Year and Type of Partnership, Since 2018
- Figure 10.4. Partnerships and Collaborations: Distribution by Type of Automated Liquid Handling System(s)
- Figure 10.5. Partnerships and Collaborations: Distribution by Product and Type of Partnership
- Figure 10.6. Most Popular Products: Distribution by Number of Partnerships
- Figure 10.7. Most Active Players: Distribution by Type of Partnership
- Figure 10.8. Partnerships and Collaborations: Local and International Agreements
- Figure 10.9. Partnerships and Collaborations: Intracontinental and Intercontinental Agreements
- Figure 11.1. Patent Analysis: Distribution by Type of Patent
- Figure 11.2. Patent Analysis: Cumulative Distribution by Patent Publication Year, Since 2017
- Figure 11.3. Patent Analysis: Year-wise Distribution of Granted Patents and Patent Applications, Since 2017
- Figure 11.4. Patent Analysis: Distribution by Geography
- Figure 11.5. Patent Analysis: Distribution by CPC Sections
- Figure 11.6. Word Cloud Analysis: Emerging Focus Areas
- Figure 11.7. Patent Analysis: Cumulative Year-wise Distribution by Type of Organization, Since 2017
- Figure 11.8. Leading Industry Players: Distribution by Number of Patents
- Figure 11.9. Leading Non-Industry Players: Distribution by Number of Patents
- Figure 11.10. Leading Individual Assignees: Distribution by Number of Patents
- Figure 11.11. Leading Players: Benchmarking by Patent Characteristics (CPC Codes)
- Figure 11.12. Patent Analysis: Distribution by Patent Age
- Figure 11.13. Automated Liquid Handling Systems: Patent Valuation Analysis
- Figure 12.1. Global Automated Liquid Handling Systems Market, Till 2035
- Figure 12.2. Automated Liquid Handling Systems Market: Distribution by Type of Automated Liquid Handling System
- Figure 12.3. Automated Pipetting Systems Market: Till 2035
- Figure 12.4. Automated Pipetting Systems Market: Distribution by Pipetting Technology
- Figure 12.5. Automated Pipetting Systems Market for Contact Technology, Till 2035
- Figure 12.6. Automated Pipetting Systems Market for Air Displacement Technology, Till 2035
- Figure 12.7. Automated Pipetting Systems Market for Piston / Positive Displacement Technology, Till 2035
- Figure 12.8. Automated Pipetting Systems Market for Acoustic Technology, Till 2035
- Figure 12.9. Automated Pipetting Systems Market for Free-jet Technology, Till 2035
- Figure 12.10. Automated Pipetting Systems Market: Distribution by Modality
- Figure 12.11. Automated Pipetting Systems Market for Fixed Tips, Till 2035
- Figure 12.12. Automated Pipetting Systems Market for Disposable Tips, Till 2035
- Figure 12.13. Automated Pipetting Systems Market: Distribution by Type of Instrument
- Figure 12.14. Automated Pipetting Systems Market for Standalone, Till 2035
- Figure 12.15. Automated Pipetting Systems Market for Individual Benchtop Workstation, Till 2035
- Figure 12.16. Automated Pipetting Systems Market for Multi Instrument System, Till 2035
- Figure 12.17. Automated Pipetting Systems Market for Others, Till 2035
- Figure 12.18. Automated Pipetting Systems Market: Distribution by Application
- Figure 12.19. Automated Pipetting Systems Market for Serial Dilution, Till 2035
- Figure 12.20. Automated Pipetting Systems Market for Plate Replication, Till 2035
- Figure 12.21. Automated Pipetting Systems Market for PCR / qPCR Setup, Till 2035
- Figure 12.22. Automated Pipetting Systems Market for Plate Reformatting, Till 2035
- Figure 12.23. Automated Pipetting Systems Market for High-throughput Screening, Till 2035
- Figure 12.24. Automated Pipetting Systems Market for Whole Genome Amplification, Till 2035
- Figure 12.25. Automated Pipetting Systems Market for Cell Culture, Till 2035
- Figure 12.26. Automated Pipetting Systems Market for Other Applications, Till 2035
- Figure 12.27. Automated Pipetting Systems Market: Distribution by End User
- Figure 12.28. Automated Pipetting Systems Market for Biotechnology and Pharmaceutical Companies, Till 2035
- Figure 12.29. Automated Pipetting Systems Market for Academic and Government Research Institutes, Till 2035
- Figure 12.30. Automated Pipetting Systems Market for Hospitals and Diagnostic Centers, Till 2035
- Figure 12.31. Automated Pipetting Systems Market for Other End Users, Till 2035
- Figure 12.32. Automated Pipetting Systems Market: Distribution by Key Geographical Regions
- Figure 12.33. Automated Pipetting Systems Market in North America, Till 2035
- Figure 12.34. Automated Pipetting Systems Market in Europe, Till 2035
- Figure 12.35. Automated Pipetting Systems Market in Asia-Pacific, Till 2035
- Figure 12.36. Automated Pipetting Systems Market in Middle East and North Africa, Till 2035
- Figure 12.37. Automated Pipetting Systems Market in Latin America, Till 2035
- Figure 12.38. Automated Microplate Washers Market: Till 2035
- Figure 12.39. Automated Microplate Washers Market: Distribution by Washing Technology
- Figure 12.40. Automated Microplate Washers Market for Ultrasonic Technology
- Figure 12.41. Automated Microplate Washers Market for Acoustic Technology
- Figure 12.42. Automated Microplate Washers Market for Centrifugal Technology
- Figure 12.43. Automated Microplate Washers Market: Distribution by Application
- Figure 12.44. Automated Microplate Washers Market for ELISA, Till 2035
- Figure 12.45. Automated Microplate Washers Market for Cell-based Assays, Till 2035
- Figure 12.46. Automated Microplate Washers Market for Bead Washing, Till 2035
- Figure 12.47. Automated Microplate Washers Market for Other Applications, Till 2035
- Figure 12.48. Automated Microplate Washers Market: Distribution by End User
- Figure 12.49. Automated Microplate Washers Market for Biotechnology and Pharmaceutical Companies, Till 2035
- Figure 12.50. Automated Microplate Washers Market for Academic and Government Research Institutes, Till 2035
- Figure 12.51. Automated Microplate Washers Market for Hospitals and Diagnostic Centers, Till 2035
- Figure 12.52. Automated Microplate Washers Market for Other End Users, Till 2035
- Figure 12.53. Automated Microplate Washers Market: Distribution by Key Geographical Regions
- Figure 12.54. Automated Microplate Washers Market in North America, Till 2035
- Figure 12.55. Automated Microplate Washers Market in Europe, Till 2035
- Figure 12.56. Automated Microplate Washers Market in Asia-Pacific, Till 2035
- Figure 12.57. Automated Microplate Washers Market in Middle East and North Africa, Till 2035
- Figure 12.58. Automated Microplate Washers Market in Latin America, Till 2035
- Figure 13.1. Automated Liquid Handling Systems: SWOT Analysis
- Figure 13.2. Comparison of SWOT Factors: Harvey Ball Analysis
- Figure 14.1. Concluding Remarks: Current Market Landscape of Automated Pipetting Systems
- Figure 14.2. Concluding Remarks: Current Market Landscape of Automated Microplate Washers
- Figure 14.3. Concluding Remarks: Partnerships and Collaborations
- Figure 14.4. Concluding Remarks: Patent Analysis
- Figure 14.5. Concluding Remarks: Market Sizing and Opportunity Analysis
目次
GLOBAL AUTOMATED LIQUID HANDLING SYSTEMS MARKET: OVERVIEW
As per Roots Analysis, the global automated liquid handling systems market is estimated to grow from USD 3.26 billion in the current year to USD 6.35 billion by 2035, at a CAGR of 6.9% during the forecast period, till 2035.
The market sizing and opportunity analysis has been segmented across the following parameters:
Pipetting Technology
- Contact Technology
- Air Displacement Technology
- Piston / Positive Displacement Technology
- Acoustic Technology
- Free-jet Technology
Washing Technology
- Ultrasonic Technology
- Acoustic Technology
- Centrifugal Technology
Modality
- Fixed Tips
- Disposable Tips
Type of Instrument
- Standalone
- Individual Benchtop Workstation
- Multi Instrument Systems
- Others
Application
- Serial Dilution
- Plate Replication
- PCR / qPCR Setup
- Plate Reformatting
- High-throughput Screening
- Whole Genome Amplification
- Cell Culture
- ELISA
- Cell-based Assays
- Bead Washing
- Other Applications
End User
- Biotechnology and Pharmaceutical Companies
- Academics and Government Research Institutes
- Hospitals and Diagnostic Centers
- Other End Users
Key Geographical Regions
- North America
- Europe
- Asia-Pacific
- Middle East and North Africa
- Latin America
GLOBAL AUTOMATED LIQUID HANDLING SYSTEMS MARKET: GROWTH AND TRENDS
In recent years, the biopharmaceutical domain has witnessed several advancements in the field of laboratory sciences, including the emergence of automated systems. The use of automated liquid handling systems in the pharmaceutical industry has revolutionized the way modern laboratories operate. The advantages offered by automated liquid handling systems over manual methods primarily drive the growth of this market. Moreover, due to the increased throughput, greater precision and improved workflows that allow significant time saving, more and more laboratories are now adopting these systems. This is being done in order to give laboratories a competitive edge in the past two decades. However, to leverage the full potential of automated liquid handlers and sustain growth in the future, it is important to address the various hurdles and existing challenges.
Notably, many stakeholders are focused on incorporating advancements in lab automation such as the development of automated liquid handling systems with the capability to dispense liquid volumes. Presently, over 125 companies are engaged in the manufacturing of automated liquid handlers including automated pipetting systems / automated microplate washers.
GLOBAL AUTOMATED LIQUID HANDLING SYSTEMS MARKET: KEY INSIGHTS
The report delves into the current state of global automated liquid handling systems market and identifies potential growth opportunities within industry. Some key findings from the report include:
- Presently, 70 well-established players across the globe claim to offer more than 150 automated pipetting systems; more than 70% of these systems can be used as integrated workstations.
- Automated pipetting systems are equipped with advanced features to enhance reproducibility and workflow accuracy; nearly 60% of the systems offer barcode identification for tracking sample reagents conveniently.
- In pursuit of building a competitive edge in this industry, stakeholders are actively upgrading their existing automated pipetting systems in order to augment their product portfolio offerings.
- During our research, we identified more than 100 automated microplate washers that have various applications in the biopharmaceutical and pharmaceutical industries.
- Close to 80% of the automated microplate washers are used as stand-alone workstations, offering flexibility in sample preparation; over 95% of such systems are compatible with flat microplates.
- It is worth highlighting that players are focused on the integration of advanced features into their automated microplate washers to comply with the evolving industry benchmarks.
- The partnership activity in this domain has increased at a CAGR of over 30%; in fact, the maximum deals related to automated liquid handling systems have been inked in the last three years.
- Around 500 patents related to automated liquid handling systems have recently been filed / granted by various stakeholders, indicating the growing pace of innovation in this field.
- With the rising demand for automated pipetting systems, the market is expected to grow at an annualized rate of more than 6.9% till 2035.
- The current and projected future automated pipetting systems market opportunity is likely to be well distributed across various applications, end users and key geographical regions.
- Growth in the automated microplate washer's domain is anticipated to be primarily driven by the rising demand of acoustic technology; North America is expected to capture larger share (35%) of the market by 2035.
GLOBAL AUTOMATED LIQUID HANDLING SYSTEMS MARKET: KEY SEGMENTS
Air Displacement Technology Segment Occupies the Largest Share of the Automated Liquid Handling Systems Market
Based on pipetting technology, the market is segmented into contact technology, air displacement technology, piston / positive displacement technology, acoustic technology and free-jet technology. At present, air displacement technology segment holds the majority share (~30%) of the global automated liquid handling systems market. Additionally, the acoustic technology segment is likely to grow at a faster pace compared to the other segments.
By Modality, Disposable Tips is the Fastest Growing Segment of the Global Automated Liquid Handling Systems Market
Based on the modality, the market is segmented into fixed tips and disposable tips. Currently, the disposable tips segment captures the highest proportion (~75%) of the global automated liquid handling systems market. It is worth highlighting that the automated liquid handling systems market for disposable tips segment is likely to grow at a relatively higher CAGR.
Standalone Segment Occupies the Largest Share of the Automated Liquid Handling Systems Market by Type of Instrument
Based on the type of instrument, the market is segmented into standalone, individual benchtop workstation, multi-instrument systems and others. At present, the standalone segment holds the maximum share (~35%) of the automated liquid handling systems market. In addition, the multi-instrument systems segment is likely to grow at a relatively higher CAGR.
By Application, the High-throughput Screening Segment is the Fastest Growing Segment of the Automated Liquid Handling Systems Market During the Forecast Period
Based on the application, the market is segmented into serial dilution, plate replication, PCR / qPCR setup, plate reformatting, high-throughput screening, whole genome amplification, cell culture, ELISA, cell-based assays, bead washing and other applications. Currently, serial dilution segment captures the highest proportion (>30%) of the automated liquid handling systems market. Further, it is worth highlighting that the automated liquid handling systems market for high-throughput screening is likely to grow at a relatively higher CAGR.
Biotechnology and Pharmaceutical Companies Segment Account for the Largest Share of the Global Automated Liquid Handling Systems Market
Based on the end user, the market is segmented into biotechnology and pharmaceutical companies, academic and government research institutes, hospitals and diagnostic centers and other end users. Currently, biotechnology and pharmaceutical companies segment holds the maximum share (~45%) of the global automated liquid handling systems market. This trend is likely to remain the same in the coming years.
North America Accounts for the Largest Share of the Market
Based on key geographical regions, the market is segmented into North America, Europe, Asia-Pacific, Latin America, and Middle East and North Africa. Currently, North America (~45%) dominates the automated liquid handling systems market and accounts for the largest revenue share. However, the market in Asia-Pacific is expected to grow at a higher CAGR.
Example Players in the Automated Liquid Handling Systems Market
- Agilent Technologies
- Beckman Coulter Life Sciences
- Eppendorf
- Hamilton Robotics
- MyGenostics
- Tecan
- Thermo Fisher Scientific
GLOBAL AUTOMATED LIQUID HANDLING SYSTEMS MARKET: RESEARCH COVERAGE
- Market Sizing and Opportunity Analysis: The report features an in-depth analysis of the global automated liquid handling systems market, focusing on key market segments, including [A] pipetting technology, [B] washing technology, [C] modality, [D] type of instrument, [E] application, [F] end user and [G] key geographical regions.
- Automated Pipetting Systems Market Landscape: A comprehensive evaluation of automated pipetting systems, considering various parameters, such as [A] pipetting technology, [B] certification(s), [C] type of instrument(s) by assembly, [D] pipetting head option(s), [E] weight of automated pipetting system (in kg), [F] compatible labware, [G] application area(s), [H] application(s), [I] additional feature(s) and [J] end user(s). Additionally, a comprehensive evaluation of automated pipetting system providers, based on parameters, such as [A] year of establishment, [B] company size (in terms of employee count) and [C] location of headquarters.
- Automated Pipetting System Providers Competitiveness Analysis: A comprehensive competitive analysis of automated pipetting system providers, examining factors, such as [A] company strength, [B] product diversity and [C] product strength.
- Automated Pipetting System Providers Company Profiles: In-depth profiles of companies engaged in the manufacturing of automated pipetting systems, focusing on [A] company overviews, [B] financial information (if available), [C] product portfolio and [D] recent developments and an informed future outlook.
- Automated Microplate Washers Market Landscape: A comprehensive evaluation of automated microplate washers, considering various parameters, such as [A] type of instrument(s), [B] compatible microplate(s), [C] weight of automated microplate washers (in Kg), [D] compatible labware, [E] application(s), and [F] end user(s). Additionally, a comprehensive evaluation of automated microplate washer providers, based on parameters, such as [A] year of establishment, [B] company size (in terms of employee count) and [C] location of headquarters.
- Automated Microplate Washer Providers Competitiveness Analysis: A comprehensive competitive analysis of automated microplate washer providers, examining factors, such as [A] company strength, [B] product diversity and [C] product strength.
- Automated Microplate Washer Providers Company Profiles: In-depth profiles of companies engaged in the manufacturing of automated microplate washers, focusing on [A] company overviews, [B] financial information (if available), [C] product portfolio and [D] recent developments and an informed future outlook.
- Partnerships and Collaborations: An insightful analysis of the deals inked by stakeholders in the automated liquid handling systems market, based on several parameters, such as [A] year of partnership, [B] type of partnership, [C] type of automated liquid handling system, [D] most popular products, [E] most active players (in terms of the number of partnerships signed) and [F] geographical distribution of partnership activity.
- Patent Analysis: An in-depth analysis of patents filed / granted till date in the automated liquid handling systems domain, based on various relevant parameters, such as [A] patent publication year, [B] type of patent, [C] patent jurisdiction, [D] CPC symbols, [F] type of applicant, [G] emerging focus areas, [H] leading players, [I] benchmarking analysis and [J] patent valuation.
- SWOT Analysis: An analysis of industry affiliated trends, opportunities and challenges, which are likely to impact the evolution of automated liquid handling systems market; it includes a Harvey ball analysis, assessing the relative impact of each SWOT parameter on industry dynamics.
KEY QUESTIONS ANSWERED IN THIS REPORT
- How many companies are currently engaged in this market?
- Which are the leading companies in this market?
- What factors are likely to influence the evolution of this market?
- What is the current and future market size?
- What is the CAGR of this market?
- How is the current and future market opportunity likely to be distributed across key market segments?
REASONS TO BUY THIS REPORT
- The report provides a comprehensive market analysis, offering detailed revenue projections of the overall market and its specific sub-segments. This information is valuable to both established market leaders and emerging entrants.
- Stakeholders can leverage the report to gain a deeper understanding of the competitive dynamics within the market. By analyzing the competitive landscape, businesses can make informed decisions to optimize their market positioning and develop effective go-to-market strategies.
- The report offers stakeholders a comprehensive overview of the market, including key drivers, barriers, opportunities, and challenges. This information empowers stakeholders to stay abreast of market trends and make data-driven decisions to capitalize on growth prospects.
ADDITIONAL BENEFITS
- Complimentary PPT Insights Packs
- Complimentary Excel Data Packs for all Analytical Modules in the Report
- 15% Free Content Customization
- Detailed Report Walkthrough Session with Research Team
- Free Updated report if the report is 6-12 months old or older
TABLE OF CONTENTS
1. PREFACE
- 1.1. Scope of the Report
- 1.2. Research Methodology
- 1.2.1. Research Assumptions
- 1.2.2. Project Methodology
- 1.2.3. Forecast Methodology
- 1.2.4. Robust Quality Control
- 1.2.5. Key Considerations
- 1.2.5.1. Demographics
- 1.2.5.2. Economic Factors
- 1.2.5.3. Government Regulations
- 1.2.5.4. Supply Chain
- 1.2.5.5. COVID Impact / Related Factors
- 1.2.5.6. Market Access
- 1.2.5.7. Healthcare Policies
- 1.2.5.8. Industry Consolidation
- 1.3 Key Questions Answered
- 1.4. Chapter Outlines
2. EXECUTIVE SUMMARY
3. INTRODUCTION
- 3.1. Chapter Overview
- 3.2. Overview of Automated Liquid Handling Systems
- 3.3. Manual versus Automated Liquid Handling
- 3.4. Automated Pipetting Systems
- 3.4.1. Working Mechanism of Automated Pipetting Systems
- 3.4.2. Types of Automated Pipetting Systems
- 3.4.2.1. Tip-based Pipetting Systems
- 3.4.2.2. Non-tip based Pipetting Systems
- 3.4.3. Advantages of Automated Pipetting Systems
- 3.5. Automated Microplate Washers
- 3.5.1. Features of an Ideal Automated Microplate Washer
- 3.6. Applications of Automated Liquid Handling Systems
- 3.7. Challenges in Adoption of Automated Liquid Handling Systems
- 3.8. Future Perspectives
4. AUTOMATED PIPETTING SYSTEMS: MARKET LANDSCAPE
- 4.1. Chapter Overview
- 4.2. Automated Pipetting Systems: Overall Market Landscape
- 4.2.1. Analysis by Type of Technology
- 4.2.2. Analysis by Pipetting Technology
- 4.2.3. Analysis by Certification(s)
- 4.2.4. Analysis by Type of Instrument(s) by Assembly
- 4.2.5. Analysis by Pipetting Head Option(s)
- 4.2.6. Analysis by Weight of Automated Pipetting System (in Kg)
- 4.2.7. Analysis by Compatible Labware
- 4.2.8. Analysis by Application Area(s)
- 4.2.9. Analysis by Application(s)
- 4.2.10. Analysis by Additional Feature(s)
- 4.2.11. Analysis by End User(s)
- 4.3. Automated Pipetting System Providers Landscape
- 4.3.1. Analysis by Year of Establishment
- 4.3.2. Analysis by Company Size
- 4.3.3. Analysis by Location of Headquarters (Region-wise)
- 4.3.4. Analysis by Company Size and Location of Headquarters (Region-wise)
- 4.3.5. Analysis by Location of Headquarters (Country-wise)
- 4.3.6. Most Active Players: Analysis by Number of Automated Pipetting Systems Manufactured
5. AUTOMATED PIPETTING SYSTEM PROVIDERS: COMPETITIVENESS ANALYSIS
- 5.1. Chapter Overview
- 5.2. Assumptions and Key Parameters
- 5.3. Methodology
- 5.4. Company Competitiveness Analysis: Automated Pipetting System Providers
- 5.4.1. Companies based in North America (Peer Group I)
- 5.4.2. Companies based in Europe (Peer Group II)
- 5.4.3. Companies based in Asia-Pacific and Rest of the World (Peer Group III)
6. AUTOMATED PIPETTING SYSTEM PROVIDERS: COMPANY PROFILES
- 6.1. Chapter Overview
- 6.2. Beckman Coulter Life Sciences
- 6.2.1. Company Overview
- 6.2.2. Financial Information
- 6.2.3. Product Portfolio
- 6.2.4. Recent Developments and Future Outlook
- 6.3. Eppendorf
- 6.3.1. Company Overview
- 6.3.2. Financial Information
- 6.3.3. Product Portfolio
- 6.3.4. Recent Developments and Future Outlook
- 6.4. Hamilton Robotics
- 6.4.1. Company Overview
- 6.4.2. Product Portfolio
- 6.4.3. Recent Developments and Future Outlook
- 6.5. MyGenostics
- 6.5.1. Company Overview
- 6.5.2. Product Portfolio
- 6.5.3. Recent Developments and Future Outlook
7. AUTOMATED MICROPLATE WASHERS: MARKET LANDSCAPE
- 7.1. Chapter Overview
- 7.2. Automated Microplate Washers: Overall Market Landscape
- 7.2.1. Analysis by Type of Instrument(s) by Assembly
- 7.2.2. Analysis by Compatible Microplate(s)
- 7.2.3. Analysis by Weight of Automated Microplate Washer (in Kg)
- 7.2.4. Analysis by Compatible Software
- 7.2.5. Analysis by Compatible Labware
- 7.2.6. Analysis by Application Area(s)
- 7.2.7. Analysis by Application(s)
- 7.2.8. Analysis by End User(s)
- 7.3. Automated Microplate Washer Providers Landscape
- 7.3.1. Analysis by Year of Establishment
- 7.3.2. Analysis by Company Size
- 7.3.3. Analysis by Location of Headquarters (Region-wise)
- 7.3.4. Analysis by Company Size and Location of Headquarters (Region-wise)
- 7.3.5. Analysis by Location of Headquarters (Country-wise)
- 7.3.6. Most Active Players: Analysis by Number of Automated Microplate Washers Manufactured
8. AUTOMATED MICROPLATE WASHER PROVIDERS: COMPETITIVENESS ANALYSIS
- 8.1. Chapter Overview
- 8.2. Assumptions and Key Parameters
- 8.3. Methodology
- 8.4. Company Competitiveness Analysis: Automated Microplate Washer Providers
- 8.4.1. Companies based in North America (Peer Group I)
- 8.4.2. Companies based in Europe (Peer Group II)
- 8.4.3. Companies based in Asia-Pacific and Rest of the World (Peer Group III)
9. AUTOMATED MICROPLATE WASHER PROVIDERS: COMPANY PROFILES
- 9.1. Chapter Overview
- 9.2. Agilent Technologies
- 9.2.1. Company Overview
- 9.2.2. Financial Information
- 9.2.3. Product Portfolio
- 9.2.4. Recent Developments and Future Outlook
- 9.3. Tecan
- 9.3.1. Company Overview
- 9.3.2. Financial Information
- 9.3.3. Product Portfolio
- 9.3.4. Recent Developments and Future Outlook
- 9.4. Thermo Fisher Scientific
- 9.4.1. Company Overview
- 9.4.2. Financial Information
- 9.4.3. Product Portfolio
- 9.4.4. Recent Developments and Future Outlook
10. PARTNERSHIPS AND COLLABORATIONS
- 10.1. Chapter Overview
- 10.2. Partnership Models
- 10.3. Automated Liquid Handling Systems: Partnerships and Collaborations
- 10.3.1. Analysis by Year of Partnership
- 10.3.2. Analysis by Type of Partnership
- 10.3.3. Analysis by Year and Type of Partnership
- 10.3.4. Analysis by Type of Automated Liquid Handling System(s)
- 10.3.5. Analysis by Product and Type of Partnership
- 10.3.6. Most Popular Products: Distribution by Number of Partnerships
- 10.3.7. Most Active Players: Analysis by Type of Partnership
- 10.3.8. Analysis by Geography
- 10.3.8.1. Local and International Agreements
- 10.3.8.2. Intracontinental and Intercontinental Agreements
11. PATENT ANALYSIS
- 11.1. Chapter Overview
- 11.2. Scope and Methodology
- 11.3. Automated Liquid Handling Systems: Patent Analysis
- 11.3.1. Analysis by Patent Publication Year
- 11.3.2. Analysis by Annual Number of Granted Patents and Patent Applications
- 11.3.3. Analysis by Geography
- 11.3.4. Analysis by CPC Sections
- 11.3.5. Word Cloud Analysis: Emerging Focus Areas
- 11.3.6. Analysis by Type of Organization
- 11.3.7. Leading Industry Players: Analysis by Number of Patents
- 11.3.8. Leading Non-Industry Players: Analysis by Number of Patents
- 11.3.9. Leading Individual Assignees: Analysis by Number of Patents
- 11.4. Automated Liquid Handling Systems: Patent Benchmarking Analysis
- 11.4.1. Analysis by Patent Characteristics
- 11.5. Automated Liquid Handling Systems: Patent Valuation Analysis
- 11.6. Leading Patents: Analysis by Number of Citations
12. MARKET SIZING AND OPPORTUNITY ANALYSIS
- 12.1. Chapter Overview
- 12.2. Methodology and Key Assumptions
- 12.3. Global Automated Liquid Handling Systems Market, Till 2035
- 12.3.1. Automated Liquid Handling Systems Market: Distribution by Type of Automated Liquid Handling System
- 12.3.1.1. Automated Pipetting Systems Market: Till 2035
- 12.3.1.1.1. Automated Pipetting Systems Market: Distribution by Pipetting Technology
- 12.3.1.1.1.1. Automated Pipetting Systems Market for Contact Technology, Till 2035
- 12.3.1.1.1.2. Automated Pipetting Systems Market for Air Displacement Technology, Till 2035
- 12.3.1.1.1.3. Automated Pipetting Systems Market for Piston / Positive Displacement Technology, Till 2035
- 12.3.1.1.1.4. Automated Pipetting Systems Market for Acoustic Technology, Till 2035
- 12.3.1.1.1.5. Automated Pipetting Systems Market for Free-jet Technology, Till 2035
- 12.3.1.1.2. Automated Pipetting Systems Market: Distribution by Modality
- 12.3.1.1.2.1. Automated Pipetting Systems Market for Fixed Tips, Till 2035
- 12.3.1.1.2.2. Automated Pipetting Systems Market for Disposable Tips, Till 2035
- 12.3.1.1.3. Automated Pipetting Systems Market: Distribution by Type of Instrument
- 12.3.1.1.3.1. Automated Pipetting Systems Market for Standalone, Till 2035
- 12.3.1.1.3.2. Automated Pipetting Systems Market for Individual Benchtop Workstation, Till 2035
- 12.3.1.1.3.1. Automated Pipetting Systems Market for Multi Instrument System, Till 2035
- 12.3.1.1.3.2. Automated Pipetting Systems Market for Others, Till 2035
- 12.3.1.1.4. Automated Pipetting Systems Market: Distribution by Application
- 12.3.1.1.4.1. Automated Pipetting Systems Market for Serial Dilution, Till 2035
- 12.3.1.1.4.2. Automated Pipetting Systems Market for Plate Replication, Till 2035
- 12.3.1.1.4.3. Automated Pipetting Systems Market for PCR / qPCR Setup, Till 2035
- 12.3.1.1.4.4. Automated Pipetting Systems Market for Plate Reformatting, Till 2035
- 12.3.1.1.4.5. Automated Pipetting Systems Market for High-throughput Screening, Till 2035
- 12.3.1.1.4.6. Automated Pipetting Systems Market for Whole Genome Amplification, Till 2035
- 12.3.1.1.4.7. Automated Pipetting Systems Market for Cell Culture, Till 2035
- 12.3.1.1.4.8. Automated Pipetting Systems Market for Other Applications, Till 2035
- 12.3.1.1.5. Automated Pipetting Systems Market: Distribution by End User
- 12.3.1.1.5.1. Automated Pipetting Systems Market for Biotechnology and Pharmaceutical Companies, Till 2035
- 12.3.1.1.5.2. Automated Pipetting Systems Market for Academic and Government Research Institutes, Till 2035
- 12.3.1.1.5.3. Automated Pipetting Systems Market for Hospitals and Diagnostic Centers, Till 2035
- 12.3.1.1.5.4. Automated Pipetting Systems Market for Other End Users, Till 2035
- 12.3.1.1.6. Automated Pipetting Systems Market: Distribution by Key Geographical Regions
- 12.3.1.1.6.1 Automated Pipetting Systems Market in North America, Till 2035
- 12.3.1.1.6.2. Automated Pipetting Systems Market in Europe, Till 2035
- 12.3.1.1.6.3. Automated Pipetting Systems Market in Asia-Pacific, Till 2035
- 12.3.1.1.6.4. Automated Pipetting Systems Market in Middle East and North Africa, Till 2035
- 12.3.1.1.6.5. Automated Pipetting Systems Market in Latin America, Till 2035
- 12.3.1.1.1. Automated Pipetting Systems Market: Distribution by Pipetting Technology
- 12.3.1.2. Automated Microplate Washers Market: Till 2035
- 12.3.1.2.1. Automated Microplate Washers Market: Distribution by Washing Technology
- 12.3.1.2.1.1. Automated Microplate Washers Market for Ultrasonic Technology, Till 2035
- 12.3.1.2.1.2. Automated Microplate Washers Market for Acoustic Technology, Till 2035
- 12.3.1.2.1.3. Automated Microplate Washers Market for Centrifugal Technology, Till 2035
- 12.3.1.2.2. Automated Microplate Washers Market: Distribution by Application
- 12.3.1.2.2.1. Automated Microplate Washers Market for ELISA, Till 2035
- 12.3.1.2.2.2. Automated Microplate Washers Market for Cell-based Assays, Till 2035
- 12.3.1.2.2.3. Automated Microplate Washers Market for Bead Washing, Till 2035
- 12.3.1.2.2.4. Automated Microplate Washers Market for Other Applications, Till 2035
- 12.3.1.2.3. Automated Microplate Washers Market: Distribution by End User
- 12.3.1.2.3.1. Automated Microplate Washers Market for Biotechnology and Pharmaceutical Companies, Till 2035
- 12.3.1.2.3.2. Automated Microplate Washers Market for Academic and Government Research Institutes, Till 2035
- 12.3.1.2.3.3. Automated Microplate Washers Market for Hospitals and Diagnostic Centers, Till 2035
- 12.3.1.2.3.4. Automated Microplate Washers Market for Other End Users, Till 2035
- 12.3.1.2.4. Automated Microplate Washers Market: Distribution by Key Geographical Regions
- 12.3.1.2.4.1. Automated Microplate Washers Market in North America, Till 2035
- 12.3.1.2.4.2. Automated Microplate Washers Market in Europe, Till 2035
- 12.3.1.2.4.3. Automated Microplate Washers Market in Asia-Pacific, Till 2035
- 12.3.1.2.4.4. Automated Microplate Washers Market in Middle East and North Africa, Till 2035
- 12.3.1.2.4.5. Automated Microplate Washers Market in Latin America, Till 2035
- 12.3.1.2.1. Automated Microplate Washers Market: Distribution by Washing Technology
- 12.3.1.1. Automated Pipetting Systems Market: Till 2035
- 12.3.1. Automated Liquid Handling Systems Market: Distribution by Type of Automated Liquid Handling System
13. SWOT ANALYSIS
- 13.1. Chapter Overview
- 13.2. Automated Liquid Handling Systems: SWOT Analysis
- 13.3. Comparison of SWOT Factors
- 13.3.1. Weaknesses
- 13.3.2. Opportunities
- 13.3.3. Threats
- 13.4. Concluding Remarks
14. CONCLUDING REMARKS
15. APPENDIX I: TABULATED DATA
16. APPENDIX II: LIST OF COMPANIES AND ORGANIZATIONS
- 発行日
- 発行
- Roots Analysis
- ページ情報
- 英文 292 Pages
- 納期
- 即日から翌営業日