|
|
市場調査レポート
商品コード
1226687
創薬サービスにおける量子コンピューティング市場:提供する創薬サービス別、治療分野別、主要地域別:業界動向と世界の予測、2023年~2035年Quantum Computing in Drug Discovery Services Market: Distribution by Drug Discovery Service Offered, Therapeutic Area, and Key Geographical Regions : Industry Trends and Global Forecasts, 2023-2035 |
||||||
|
|
|||||||
カスタマイズ可能
|
|||||||


| 創薬サービスにおける量子コンピューティング市場:提供する創薬サービス別、治療分野別、主要地域別:業界動向と世界の予測、2023年~2035年 |
|
出版日: 2023年09月01日
発行: Roots Analysis
ページ情報: 英文 178 Pages
納期: 即日から翌営業日
|

- 全表示
- 概要
- 図表
- 目次
当レポートでは、世界の創薬サービスにおける量子コンピューティング市場について調査し、市場の概要とともに、提供する創薬サービス別、治療分野別、主要地域別動向、地域別の動向、および市場に参入する企業のプロファイルなどを提供しています。
目次
第1章 序文
第2章 エグゼクティブサマリー
第3章 イントロダクション
第4章 市場情勢:ソフトウェアプロバイダー
- 量子コンピューティングソフトウェアプロバイダー:全体的市場情勢
第5章 企業の競争力分析
第6章 企業プロファイル:ソフトウェアプロバイダー
- Accenture
- Atos
- Fujitsu
- Huawei
- Microsoft
- Xanadu
- XtalPi
第7章 市場情勢:ハードウェアプロバイダー
- 量子コンピューティングハードウェアプロバイダー:全体的市場情勢
第8章 企業プロファイル:ハードウェアプロバイダー
- Amazon Web Services
- IBM
- Microsoft
第9章 学術助成金の分析
第10章 パートナーシップとコラボレーション
第11章 使用事例スタディ
- 量子コンピューティングの概要
- 量子コンピューティングのさまざまな産業への応用
- 量子コンピューティングの今後の動向
- 将来の展望
第12章 ポーターのファイブフォース分析
- 調査手法と前提
- 主なパラメータ
第13章 ブルーオーシャン戦略:新興企業が競争の激しい市場に参入するための戦略ガイド
第14章 市場規模と機会分析
第15章 エグゼクティブインサイト
第16章 付録1:表形式のデータ
第17章 付録2:会社および組織のリスト
LIST OF TABLES
- Table 4.1 List of Quantum Computing Software Providers
- Table 6.1 Accenture: Service Portfolio
- Table 6.2 Accenture: Recent Developments and Future Outlook
- Table 6.3 Atos: Service Portfolio
- Table 6.4 Atos: Recent Developments and Future Outlook
- Table 6.5 Fujitsu: Service Portfolio
- Table 6.6 Fujitsu: Recent Developments and Future Outlook
- Table 6.7 Huawei: Service Portfolio
- Table 6.8 Huawei: Recent Developments and Future Outlook
- Table 6.9 Microsoft: Service Portfolio
- Table 6.10 Microsoft: Recent Developments and Future Outlook
- Table 6.11 Xanadu: Service Portfolio
- Table 6.12 Xanadu: Recent Developments and Future Outlook
- Table 6.13 XtalPi: Service Portfolio
- Table 6.14 XtalPi: Recent Developments and Future Outlook
- Table 7.1 List of Quantum Computing Hardware Providers
- Table 8.1 Amazon Web Services: Recent Developments and Future Outlook
- Table 8.2 IBM: Recent Developments and Future Outlook
- Table 8.3 Microsoft: Recent Developments and Future Outlook
- Table 10.1 Quantum Computing in Drug Discovery Services: List of Partnerships and Collaborations
- Table 16.1 Quantum Computing Software Providers: Distribution by Year of Establishment
- Table 16.2 Quantum Computing Software Providers: Distribution by Company Size
- Table 16.3 Quantum Computing Software Providers: Distribution by Location of Headquarters
- Table 16.4 Quantum Computing Software Providers: Distribution by Business Capabilities
- Table 16.5 Quantum Computing Software Providers: Distribution by Platform Capabilities
- Table 16.6 Quantum Computing Software Providers: Distribution by Type of Drug Discovery Service(s) Offered
- Table 16.7 Quantum Computing Software Providers: Distribution by Type of Molecule(s) Supported
- Table 16.8 Quantum Computing Software Providers: Distribution by Type Compatible Computational Approaches
- Table 16.9 Quantum Computing Software Providers: Distribution by End user(s)
- Table 16.10 Quantum Computing Software Providers: Distribution by Therapeutic Area(s)
- Table 16.11 Accenture: Revenues in USD Billion (FY 2017-FY 2022)
- Table 16.12 Atos: Revenues in EUR Billion (FY 2017-FY 9M 2022)
- Table 16.13 Fujitsu: Revenues in Yen Billion (FY 2017-FY H1 2022)
- Table 16.14 Huawei: Revenues in CNY Billion (FY 2017-FY 9M 2022)
- Table 16.15 Microsoft: Revenues in USD Billion (FY 2017-FY 2022)
- Table 16.16 Quantum Computing Hardware Providers: Distribution by Year of Establishment
- Table 16.17 Quantum Computing Hardware Providers: Distribution by Company Size
- Table 16.18 Quantum Computing Hardware Providers: Distribution by Region of Headquarters
- Table 16.19 Quantum Computing Hardware Providers: Distribution by Location of Headquarters
- Table 16.20 Quantum Computing Hardware Providers: Distribution by Type of Offering(s)
- Table 16.21 Quantum Computing Hardware Providers: Distribution by Data Storage on Cloud
- Table 16.22 Quantum Computing Hardware Providers: Distribution by Compatible Computational Approaches
- Table 16.23 Quantum Computing Hardware Providers: Distribution by Type of offering(s) and Compatible Computational Approaches
- Table 16.24 Amazon Web Services: Revenues in USD Billion (FY 2017- FY 9M 2022)
- Table 16.25 IBM: Revenues in USD Billion (FY 2017- FY 9M 2022)
- Table 16.26 Microsoft: Revenues in USD Billion (FY 2017-FY 2022)
- Table 16.27 Academic Grants Analysis: Distribution by Year of Grant
- Table 16.28 Academic Grants Analysis: Distribution by Amount Awarded
- Table 16.29 Academic Grants Analysis: Distribution by Support Period
- Table 16.30 Academic Grants Analysis: Distribution by Study Section
- Table 16.31 Academic Grants Analysis: Distribution by Administrating Institute Center
- Table 16.32 Academic Grants Analysis: Distribution by Type of Grant
- Table 16.33 Academic Grants Analysis: Distribution by Activity Code
- Table 16.34 Academic Grants Analysis: Distribution by Purpose of Grant
- Table 16.35 Academic Grants Analysis: Distribution by Administering Institute Center and Support Period
- Table 16.36 Prominent Program Officers: Distribution by Number of Grants
- Table 16.37 Academic Grants Analysis: Distribution by Location of Organizations
- Table 16.38 Academic Grants Analysis: Distribution by Type of Organization
- Table 16.39 Popular Recipient Organizations: Analysis by Number of Grants
- Table 16.40 Popular Recipient Organizations: Analysis by Amount Awarded
- Table 16.41 Partnerships and Collaborations: Distribution by Year
- Table 16.42 Partnerships and Collaborations: Distribution by Type of Partnership
- Table 16.43 Partnerships and Collaborations: Distribution by Year and Type of Partnership
- Table 16.44 Most Active Players: Distribution by Number of Partnerships
- Table 16.45 Partnerships and Collaborations: Distribution by Type of Continent
- Table 16.46 Partnerships and Collaborations: Distribution by Company Size and Type of Partnership
- Table 16.47 Partnerships and Collaborations: Local and International Agreements
- Table 16.48 Partnerships and Collaborations: Intercontinental and Intracontinental Agreements
- Table 16.49 Quantum Computing in Drug Discovery Services Market, 2023-2035: Scenario I, Scenario II and Scenario III (USD Million)
- Table 16.50 Quantum Computing in Drug Discovery Services Market, 2023 and 2035: Distribution by Type of Drug Discovery Service Offered
- Table 16.51 Quantum Computing in Drug Discovery Services Market for Target Identification / Validation, 2023-2035: Scenario I, Scenario II and Scenario III (USD Million)
- Table 16.52 Quantum Computing in Drug Discovery Services Market for Hit Generation / Lead Identification, 2023-2035: Scenario I, Scenario II and Scenario III (USD Million)
- Table 16.53 Quantum Computing in Drug Discovery Services Market for Target Lead Optimization, 2023-2035: Scenario I, Scenario II and Scenario III (USD Million)
- Table 16.54 Quantum Computing in Drug Discovery Services Market, 2023 and 2035: Distribution by Therapeutic Area
- Table 16.55 Quantum Computing in Drug Discovery Services Market for Cardiovascular Disorders, 2023-2035: Scenario I, Scenario II and Scenario III (USD Million)
- Table 16.56 Quantum Computing in Drug Discovery Services Market for CNS Disorders, 2023-2035: Scenario I, Scenario II and Scenario III (USD Million)
- Table 16.57 Quantum Computing in Drug Discovery Services Market for Dermatological Disorders, 2023-2035: Scenario I, Scenario II and Scenario III (USD Million)
- Table 16.58 Quantum Computing in Drug Discovery Services Market for Endocrine Disorders, 2023-2035: Scenario I, Scenario II and Scenario III (USD Million)
- Table 16.59 Quantum Computing in Drug Discovery Services Market for Gastrointestinal Disorders, 2023-2035: Scenario I, Scenario II and Scenario III (USD Million)
- Table 16.60 Quantum Computing in Drug Discovery Services Market for Immunological Disorders, 2023-2035: Scenario I, Scenario II and Scenario III (USD Million)
- Table 16.61 Quantum Computing in Drug Discovery Services Market for Infectious Diseases, 2023-2035: Scenario I, Scenario II and Scenario III (USD Million)
- Table 16.62 Quantum Computing in Drug Discovery Services Market for Musculoskeletal Disorders, 2023-2035: Scenario I, Scenario II and Scenario III (USD Million)
- Table 16.63 Quantum Computing in Drug Discovery Services Market for Oncological Disorders, 2023-2035: Scenario I, Scenario II and Scenario III (USD Million)
- Table 16.64 Quantum Computing in Drug Discovery Services Market for Respiratory Disorders, 2023-2035: Scenario I, Scenario II and Scenario III (USD Million)
- Table 16.65 Quantum Computing in Drug Discovery Services Market for Others, 2023-2035: Scenario I, Scenario II and Scenario III (USD Million)
- Table 16.66 Quantum Computing in Drug Discovery Services Market, 2023 and 2035: Distribution by Key Geographical Regions
- Table 16.67 Quantum Computing in Drug Discovery Services Market in North America, 2023-2035: Scenario I, Scenario II and Scenario III (USD Million)
- Table 16.68 Quantum Computing in Drug Discovery Services Market in the US, 2023-2035: Scenario I, Scenario II and Scenario III (USD Million)
- Table 16.69 Quantum Computing in Drug Discovery Services Market in Canada, 2023-2035: Scenario I, Scenario II and Scenario III (USD Million)
- Table 16.70 Quantum Computing in Drug Discovery Services Market for Europe, 2023-2035: Scenario I, Scenario II and Scenario III (USD Million)
- Table 16.71 Quantum Computing in Drug Discovery Services Market in the UK, 2023-2035: Scenario I, Scenario II and Scenario III (USD Million)
- Table 16.72 Quantum Computing in Drug Discovery Services Market in France, 2023-2035: Scenario I, Scenario II and Scenario III (USD Million)
- Table 16.73 Quantum Computing in Drug Discovery Services Market in Germany, 2023-2035: Scenario I, Scenario II and Scenario III (USD Million)
- Table 16.74 Quantum Computing in Drug Discovery Services Market in Rest of the Europe, 2023-2035: Scenario I, Scenario II and Scenario III (USD Million)
- Table 16.75 Quantum Computing in Drug Discovery Services Market in Asia-Pacific, 2023-2035: Scenario I, Scenario II and Scenario III (USD Million)
- Table 16.76 Quantum Computing in Drug Discovery Services Market in China, 2023-2035: Scenario I, Scenario II and Scenario III (USD Million)
- Table 16.77 Quantum Computing in Drug Discovery Services Market in Japan, 2023-2035: Scenario I, Scenario II and Scenario III (USD Million)
- Table 16.78 Quantum Computing in Drug Discovery Services Market in Rest of Asia-Pacific, 2023-2035: Scenario I, Scenario II and Scenario III (USD Million)
- Table 16.79 Quantum Computing in Drug Discovery Services Market in Latin America, 2023-2035: Scenario I, Scenario II and Scenario III (USD Million)
- Table 16.80 Quantum Computing in Drug Discovery Services Market in Middle East and North Africa, 2023-2035: Scenario I, Scenario II and Scenario III (USD Million)
LIST OF FIGURES
- Figure 4.1 Quantum Computing Software Providers: Distribution by Year of Establishment
- Figure 4.2 Quantum Computing Software Providers: Distribution by Company Size
- Figure 4.3 Quantum Computing Software Providers: Distribution by Location of Headquarters
- Figure 4.4 Quantum Computing Software Providers: Distribution by Business Capabilities
- Figure 4.5 Quantum Computing Software Providers: Distribution by Platform Capabilities
- Figure 4.6 Quantum Computing Software Providers: Distribution by Type of Drug Discovery Service(s) Offered
- Figure 4.7 Quantum Computing Software Providers: Distribution by Type of Molecule(s) Supported
- Figure 4.8 Quantum Computing Software Providers: Distribution by Compatible Computational Approaches
- Figure 4.9 Quantum Computing Software Providers: Distribution by End user(s)
- Figure 4.10 Quantum Computing Software Providers: Distribution by Therapeutic Area(s)
- Figure 5.1 Company Competitiveness Analysis: Players based in North America (Peer Group I)
- Figure 5.2 Company Competitiveness Analysis: Players based in Europe (Peer Group II)
- Figure 5.3 Company Competitiveness Analysis: Players based in Asia-Pacific and Rest of the World (Peer Group III)
- Figure 6.1 Accenture: Revenues in USD Billion (FY 2017-FY 2022)
- Figure 6.2 Atos: Revenues in EUR Billion (FY 2017- FY 9M 2022)
- Figure 6.3 Fujitsu: Revenues in Yen Billion (FY 2017-FY H1 2022)
- Figure 6.4 Huawei: Revenues in CNY Billion (FY 2017-FY 9M 2022)
- Figure 6.5 Microsoft: Revenues in USD Billion (FY 2017-FY 2022)
- Figure 7.1 Quantum Computing Hardware Providers: Distribution by Year of Establishment
- Figure 7.2 Quantum Computing Hardware Providers: Distribution by Company Size
- Figure 7.3 Quantum Computing Hardware Providers: Distribution by Region of Headquarters
- Figure 7.4 Quantum Computing Hardware Providers: Distribution by Location of Headquarters
- Figure 7.5 Quantum Computing Hardware Providers: Distribution by Type of Offering(s)
- Figure 7.6 Quantum Computing Hardware Providers: Distribution by Data Storage on Cloud
- Figure 7.6 Quantum Computing Hardware Providers: Distribution by Compatible Computational Approaches
- Figure 7.7 Quantum Computing Hardware Providers: Distribution by Type of Offering(s) and Compatible Computational Approaches
- Figure 8.1 Amazon Web Services: Revenues in USD Billion (FY 2017- FY 9M 2022)
- Figure 8.2 Amazon Web Services: Service Portfolio
- Figure 8.3 IBM: Revenues in USD Billion (FY 2017- FY 9M 2022)
- Figure 8.4 IBM: Service Portfolio
- Figure 8.5 Microsoft: Revenues in USD Billion (FY 2017- FY 2022)
- Figure 8.6 Microsoft: Service Portfolio
- Figure 9.1 Academic Grants Analysis: Distribution by Year of Grant
- Figure 9.2 Academic Grants Analysis: Distribution by Amount Awarded
- Figure 9.3 Academic Grants Analysis: Distribution by Support Period
- Figure 9.4 Academic Grants Analysis: Distribution by Study Section
- Figure 9.5 Word Cloud Analysis: Emerging Focus Areas
- Figure 9.6 Academic Grants Analysis: Distribution by Administrating Institute Center
- Figure 9.7 Academic Grants Analysis: Distribution by Type of Grant
- Figure 9.8 Academic Grants Analysis: Distribution by Activity Code
- Figure 9.9 Academic Grants Analysis: Distribution by Purpose of Grant
- Figure 9.10 Academic Grants Analysis: Distribution by Funding Institute Center and Support Period
- Figure 9.11 Prominent Program Officers: Distribution by Number of Grants
- Figure 9.12 Academic Grants Analysis: Distribution by Location of Recipient Organizations
- Figure 9.13 Academic Grants Analysis: Distribution by Type of Organization
- Figure 9.14 Popular Recipient Organizations: Analysis by Number of Grants
- Figure 9.15 Popular Recipient Organizations: Analysis by Amount Awarded
- Figure 10.1 Partnerships and Collaborations: Cumulative Year-wise Trend
- Figure 10.2 Partnerships and Collaborations: Distribution by Type of Partnership
- Figure 10.3 Partnerships and Collaborations: Distribution by Year and Type of Partnership
- Figure 10.4 Most Active Players: Distribution by Number of Partnerships
- Figure 10.5 Word Cloud Analysis: Emerging Focus Areas
- Figure 10.6 Partnerships and Collaborations: Distribution by Type of Continent
- Figure 10.7 Partnerships and Collaborations: Distribution by Company Size and Type of Partnership
- Figure 10.8 Partnerships and Collaborations: Local and International Agreements
- Figure 10.9 Partnerships and Collaborations: Intercontinental and Intracontinental Agreements
- Figure 10.10 Partnerships and Collaborations: Key Value Drivers
- Figure 12.1 Porter's Five Forces: Key Parameters
- Figure 12.2 Porter's Five Forces: Harvey Ball Analysis
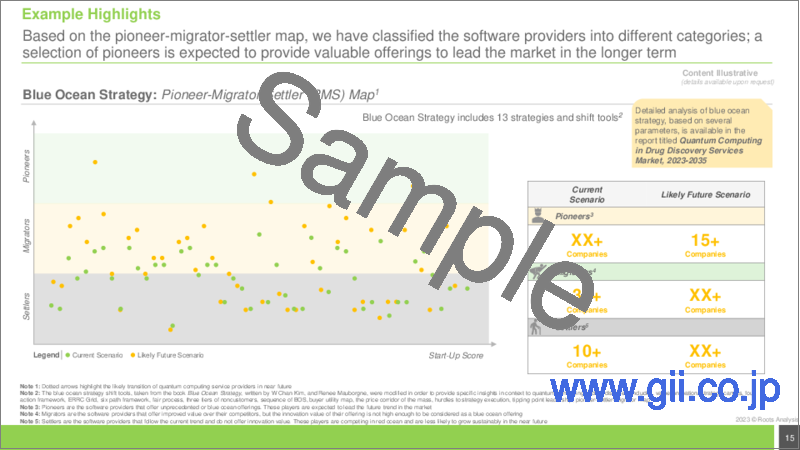
- Figure 13.1 Blue Ocean Strategy: Strategy Canvas
- Figure 13.2 Blue Ocean Strategy: Pioneer-Migrator-Settler (PMS) Map
- Figure 14.1 Quantum Computing in Drug Discovery Services Market, 2023-2035 (USD Million)
- Figure 14.2 Quantum Computing in Drug Discovery Services Market, 2023 and 2035: Distribution by Type of Drug Discovery Service Offered
- Figure 14.3 Quantum Computing in Drug Discovery Services Market for Target Identification / Validation, 2023-2035 (USD Million)
- Figure 14.4 Quantum Computing in Drug Discovery Services Market for Hit Generation / Lead Identification, 2023-2035 (USD Million)
- Figure 14.5 Quantum Computing in Drug Discovery Services Market for Target Lead Optimization, 2023-2035 (USD Million)
- Figure 14.6 Quantum Computing in Drug Discovery Services Market, 2023 and 2035: Distribution by Therapeutic Area
- Figure 14.7 Quantum Computing in Drug Discovery Services Market for Cardiovascular Disorders, 2023-2035 (USD Million)
- Figure 14.8 Quantum Computing in Drug Discovery Services Market for CNS Disorders, 2023-2035 (USD Million)
- Figure 14.9 Quantum Computing in Drug Discovery Services Market for Dermatological Disorders, 2023-2035 (USD Million)
- Figure 14.10 Quantum Computing in Drug Discovery Services Market for Endocrine Disorders, 2023-2035 (USD Million)
- Figure 14.11 Quantum Computing in Drug Discovery Services Market for Gastrointestinal Disorders, 2023-2035 (USD Million)
- Figure 14.12 Quantum Computing in Drug Discovery Services Market for Immunological Disorders, 2023-2035 (USD Million)
- Figure 14.13 Quantum Computing in Drug Discovery Services Market for Infectious Diseases, 2023-2035 (USD Million)
- Figure 14.14 Quantum Computing in Drug Discovery Services Market for Musculoskeletal Disorders, 2023-2035 (USD Million)
- Figure 14.15 Quantum Computing in Drug Discovery Services Market for Oncological Disorders, 2023-2035 (USD Million)
- Figure 14.16 Quantum Computing in Drug Discovery Services Market for Respiratory Disorders, 2023-2035 (USD Million)
- Figure 14.17 Quantum Computing in Drug Discovery Services Market for Others, 2023-2035 (USD Million)
- Figure 14.18 Quantum Computing in Drug Discovery Services Market, 2023 and 2035: Distribution by Key Geographical Regions
- Figure 14.19 Quantum Computing in Drug Discovery Services Market in North America, 2023-2035 (USD Million)
- Figure 14.20 Quantum Computing in Drug Discovery Services Market in the US, 2023-2035 (USD Million)
- Figure 14.21 Quantum Computing in Drug Discovery Services Market in Canada, 2023-2035 (USD Million)
- Figure 14.22 Quantum Computing in Drug Discovery Services Market for Europe, 2023-2035 (USD Million)
- Figure 14.23 Quantum Computing in Drug Discovery Services Market in the UK, 2023-2035 (USD Million)
- Figure 14.24 Quantum Computing in Drug Discovery Services Market in France, 2023-2035 (USD Million)
- Figure 14.25 Quantum Computing in Drug Discovery Services Market in Germany, 2023-2035 (USD Million)
- Figure 14.26 Quantum Computing in Drug Discovery Services Market in Rest of the Europe, 2023-2035 (USD Million)
- Figure 14.27 Quantum Computing in Drug Discovery Services Market in Asia-Pacific, 2023-2035 (USD Million)
- Figure 14.28 Quantum Computing in Drug Discovery Services Market in China, 2023-2035 (USD Million)
- Figure 14.29 Quantum Computing in Drug Discovery Services Market in Japan, 2023-2035 (USD Million)
- Figure 14.30 Quantum Computing in Drug Discovery Services Market in Rest of Asia-Pacific, 2023-2035 (USD Million)
- Figure 14.31 Quantum Computing in Drug Discovery Services Market in Latin America, 2023-2035 (USD Million)
- Figure 14.32 Quantum Computing in Drug Discovery Services Market in Middle East and North Africa, 2023-2035 (USD Million)
INTRODUCTION
The early stages of research related to drug discovery, including the identification of a relevant biological target and a viable lead compound, play an important role in the overall success of a drug candidate in preclinical and clinical studies. The process of drug development, beginning from the discovery of a pharmacological lead to its commercial launch, is estimated to take around 10-15 years, involving capital investments in the range of USD 4 billion - USD 10 billion. Over time, the complexities associated with drug discovery have increased, specifically, for large molecules, which are inherently more complex than small molecule drugs. In order to overcome various challenges related to drug discovery, such as rising capital requirements and failure of late-stage programs, several pharmaceutical players are currently exploring the implementation of quantum computing in drug discovery processes. Quantum computing is a process that uses laws of quantum mechanics to solve large and complex problems in a short span as compared to the computer aided drug discovery. Currently, there are several quantum computing related approaches that are being used in the drug discovery process alone, such as structure-based drug design, fragment-based drug discovery and ligand-based drug discovery. The predictive power of quantum computing has proven to reduce the complexity, cost and time investment in the overall drug discovery procedure by allowing researchers to bypass the random screening of billions of molecules in a short span of time. As a result, the pharmaceutical industry stakeholders have started relying on the players offering services for quantum computing in drug discovery. Furthermore, considering the various initiatives being undertaken actively by players based in this domain, we are led to believe that the opportunity for stakeholders in this niche, upcoming industry is likely to grow at a steady pace in the foreseen future.
SCOPE OF THE REPORT
"The Quantum Computing in Drug Discovery Services Market: Distribution by Drug Discovery Service Offered (Target Identification / Validation, Hit Generation / Lead Identification and Lead Optimization), Therapeutic Area (Cardiovascular Disorders, CNS Disorders, Dermatological Disorders, Endocrine Disorders, Gastrointestinal Disorders, Immunological Disorders, Infectious Diseases, Musculoskeletal Disorders, Oncological Disorders, Respiratory Disorders and Others), and Key Geographical Regions (North America (US and Canada), Europe (UK, France, Germany and Rest of the Europe), Asia-Pacific (China, Japan and Rest of the Asia Pacific), Latin America and Middle East and North Africa): Industry Trends and Global Forecasts, 2023-2035" report features an extensive study of the current market landscape and future potential of quantum computing in drug discovery services market. The report highlights the efforts of several stakeholders engaged in this rapidly emerging segment of the pharmaceutical industry. The report answers many key questions related to this domain.
What is quantum computing and how does it work in drug discovery?
Quantum computing is a rapidly emerging technology that uses quantum mechanism to solve large and complex problems in a short span of time as compared to traditional computers. Presently, quantum computing is used for the discovery and development of drugs owing to its capability of screening billions of molecules for specific targets in a short span of time. This procedure reduces the complexity and helps in saving time and cost associated with the drug discovery process.
What is the current market landscape of the quantum computing market focused on drug discovery?
The current market landscape of quantum computing comprises of both software and hardware providers. Software providers claim to offer services across various types of drug discovery steps. Further, these are focused on different types of therapeutic areas, primarily including oncological disorders, infectious diseases and cardiovascular disorders. Hardware providers primarily offer hardware as a service; some of the players also offer the option of purchasing the hardware directly.
What are the key trends across grants awarded for quantum computing in drug discovery?
Currently, more than 170 grants have been awarded to various organizations, primarily focused on quantum computing in drug discovery. Further, it is important to mention that the maximum number of grants have been awarded under type 5 category.
What are the key trends in the partnerships and collaborations for quantum computing in drug discovery?
Currently, various partnerships have been inked for quantum computing in drug discovery domain. Majority of these partnerships are research and development agreements, followed by platform utilization agreements.
What is the impact of quantum computing on the pharmaceutical industry?
Quantum computing has created a huge impact on the pharmaceutical industry in a short time period. Various industry stakeholders are integrating quantum computing for the discovery and development of drugs. Owing to the various benefits of quantum computing, such as big data processing and complex molecular modeling for minimizing cost and time investment, the adoption rate in pharmaceutical industry is expected to increase rapidly in the coming future.
What is the market size of quantum computing in drug discovery services market?
As the adoption of quantum computing in drug discovery increases amongst innovators in the pharmaceutical and biopharmaceutical industries, lucrative opportunities are expected to emerge for players offering services for quantum computing in drug discovery. The global quantum computing market, focused on drug discovery is expected to grow at a CAGR of 14% from 2023 to 2035.
Who are the players in the quantum computing in drug discovery services market?
Examples of service providers engaged in this domain (which have also been captured in this report) include (in alphabetic order) Accenture, Aurora Fine Chemicals, Amazon Web Services, Huawei, IBM, Microsoft, Fujitsu, Xanadu and XtalPi.
The study presents an in-depth analysis, highlighting the capabilities of various stakeholders engaged in this domain, across different geographies. Amongst other elements, the report includes:
- An executive summary of the insights captured during our research. It offers a high-level view on the current state of quantum computing in drug discovery services market and its likely evolution in the short to mid and long term.
- A general overview of quantum computing in drug discovery services, along with information on its types and applications across various industries. It also highlights the applications of quantum computing, specifically related to drug discovery. Further, the chapter features a discussion on the challenges, key growth drivers, and future perspectives.
- A detailed assessment of the overall market landscape of quantum computing software providers, based on several relevant parameters, including year of establishment, company size (in terms of number of employees), location of headquarters, business capabilities (platform / software, quantum as a service, drug discovery service and in-house pipeline), platform capabilities (drug discovery, drug design, supply chain management and drug development(clinical trials)), type of drug discovery service(s) offered (target discovery / identification, target validation / selection, hit generation / identification / discovery, hit to lead / hit expansion / target to lead / lead identification / select lead series and lead optimization), type of molecule(s) supported (small molecules and large molecules), compatible computational approaches (artificial intelligence and cloud computing), end user(s) (pharmaceutical companies, contract research organizations and academic / research institutes) and therapeutic area(s) (cardiovascular disorders, infectious diseases, neurological disorders , oncological disorders and others)
- A detailed competitiveness analysis of quantum computing service providers based on company strength (in terms of years of experience), portfolio strength (in terms of type of drug discovery services offered, type of molecule(s) supported, type of computational approaches and type of end-user(s)), and portfolio diversity (in terms of business capabilities).
- Elaborate profiles of quantum computing software providers. Each profile includes a brief overview of the company, financial information (if available), details on service portfolio, recent developments and an informed future outlook.
- A detailed assessment of the overall market landscape of quantum computing hardware providers, based on several parameters including year of establishment, company size (in terms of number of employees), location of headquarters, type of offering(s) (hardware as a service and hardware for purchase), data storage on cloud and compatible computational approaches (artificial intelligence and cloud computing)
- Detailed profiles of quantum computing hardware providers. Each profile includes a brief overview of the company, financial information (if available), details on service portfolio, recent developments and an informed future outlook.
- A detailed review of over 170 academic grants focused on quantum computing in drug discovery, based on several relevant parameters, such as year of grants awarded, amount awarded, support period, type of study section, administering institute center, type of grant, activity code, funding mechanism and amount granted, funding institute and support period, prominent program officers (by number of grants), location of recipient organizations, popular recipient organizations, organization type and amount granted to popular recipient.
- A detailed analysis of recent partnerships inked between stakeholders engaged in this domain, since 2017, based on several relevant parameters, such as year of partnership, type of partnership, most active players (in terms of number of partnerships), and regional distribution of partnership activity in this domain.
- A use case study highlighting the applications of quantum computing across various industries, such as chemical industry, cybersecurity, financial modeling, space sciences, oil and gas industry and weather forecasting, and its likely evolution in the foreseen future.
- A qualitative analysis, highlighting the five competitive forces prevalent in this domain, including threats for new entrants, bargaining power of buyers, bargaining power of suppliers, threats of substitute product and rivalry among existing competitors.
- A detailed analysis of the current and future market based on blue ocean strategy, covering a strategic plan / guide for emerging players in this domain to help unlock an uncontested market, featuring thirteen strategic tools that can help software providers to shift towards a blue ocean strategic market.
One of the key objectives of the report was to estimate the current opportunity and future growth potential of quantum computing in drug discovery services market over the coming years. We have provided informed estimates on the likely evolution of the market for the period, 2023-2035. Our year-wise projections of the current and future opportunity have further been segmented based on relevant parameters, such as drug discovery services offered (target identification / validation, hit generation / lead identification and lead optimization), therapeutic area (cardiovascular disorders, CNS disorders, dermatological disorders, endocrine disorders, gastrointestinal disorders, immunological disorders, infectious diseases, musculoskeletal disorders, oncological disorders, respiratory disorders and others), and key geographical regions ((North America (US and Canada), Europe (UK, France, Germany and Rest of the Europe), Asia-Pacific (China, Japan and Rest of the Asia Pacific), Latin America and Middle East and North Africa). In order to account for future uncertainties associated with some of the key parameters and to add robustness to our model, we have provided three market forecast scenarios, namely conservative, base, and optimistic scenarios, representing different tracks of the industry's evolution.
The opinions and insights presented in the report were influenced by discussions held with stakeholders in this domain. The report features detailed transcripts of interviews held with the industry stakeholders.
All actual figures have been sourced and analyzed from publicly available information forums and primary research discussions. Financial figures mentioned in this report are in USD, unless otherwise specified.
RESEARCH METHODOLOGY
The data presented in this report has been gathered via secondary and primary research. For all our projects, we conduct interviews / surveys with experts in this domain (academia, industry, medical practice, and other associations) to solicit their opinions on emerging trends in the market. This is primarily useful for us to draw out our own opinion on how the market will evolve across different regions and technology segments. Wherever possible, the available data has been checked for accuracy from multiple sources of information.
The secondary sources of information include:
- Annual reports
- Investor presentations
- SEC filings
- Industry databases
- News releases from company websites
- Government policy documents
- Industry analysts' views
While the focus has been on forecasting the market till 2035, the report also provides our independent views on various technological and non-commercial trends emerging in the industry. This opinion is solely based on our knowledge, research, and understanding of the relevant market gathered from various secondary and primary sources of information.
KEY QUESTIONS ANSWERED
Question 1: What is the growth rate of quantum computing market focusing on drug discovery?
Answer: The global quantum computing market focusing on drug discovery is expected to grow at an annualized rate of 14% from 2023 to 2035.
Question 2: Which region is likely to hold the largest share in the quantum computing market focused on drug discovery?
Answer: North America is anticipated to capture the highest market share by 2035. In addition, the market in Asia-Pacific is likely to grow at a relatively faster pace, in the long term.
Question 3: Which type of service providers are most likely to dominate the quantum computing market for drug discovery?
Answer: Currently, software providers hold the largest share in the quantum computing in drug discovery services market; this is followed by hardware providers.
Question 4: What kind of partnership models are most commonly being adopted by stakeholders engaged in this domain?
Answer: Research and development agreements emerged as the most popular type of partnership model adopted by players engaged in offering quantum computing services for drug discovery. This is followed by platform utilization agreements.
CHAPTER OUTLINES
- Chapter 1: is a preface providing an introduction to the full report, Quantum Computing in Drug Discovery Services Market, 2023-2035.
- Chapter 2: is an executive summary of the key insights captured in our report. It offers a high-level view of the current scenario of quantum computing in drug discovery services market and its likely evolution in the short term to mid-term and long term.
- Chapter 3: provides an overview of quantum computing, along with information on its business and platform capabilities with respect to its use across various industries Additionally, it highlights the application of quantum computing, specifically in drug discovery. Further, the chapter features a discussion on the challenges, key growth drivers, and future perspectives associated with the use of quantum computing in drug discovery services.
- Chapter 4: provides a detailed assessment of the overall market landscape of quantum computing software providers, based on several relevant parameters including year of establishment, company size (in terms of number of employees), location of headquarters, business capabilities (platform / software, quantum as a service, drug discovery service and in-house pipeline), platform capabilities (drug discovery, drug design, supply chain management and drug development(clinical trials)), type of drug discovery service(s) offered (target discovery / identification, target validation / selection, hit generation / identification / discovery, hit to lead / hit expansion / target to lead / lead identification / select lead series and lead optimization), type of molecule(s) supported (small molecules and large molecules), compatible computational approaches (artificial intelligence and cloud computing), end user(s) (pharmaceutical companies, contract research organizations and academic / research institutes) and therapeutic area(s) (cardiovascular disorders, infectious diseases, neurological disorders , oncological disorders and others).
- Chapter 5: provides an insightful company competitiveness analysis of quantum computing service providers based on company strength (in terms of the years of experience), portfolio strength (in terms of type of drug discovery services offered, type of molecule(s) supported, type of computational approaches and type of end-user(s)), and portfolio diversity (in terms of business capabilities).
- Chapter 6: features elaborate profiles of quantum computing software providers . Each profile includes a brief overview of the company, financial information (if available), details on service portfolio, recent developments and an informed future outlook.
- Chapter 7: features a detailed assessment of the overall market of quantum computing hardware providers based on various parameters including year of establishment, company size (in terms of number of employees), location of headquarters, type of offering(s) (hardware as a service and hardware for purchase), data storage on cloud and compatible computational approaches (artificial intelligence and cloud computing).
- Chapter 8: features detailed profiles of quantum computing hardware providers. It includes a brief overview of the company, financial information (if available), details of service portfolio, recent developments and an informed future outlook.
- Chapter 9: features a detailed review of academic grants related to research on quantum computing in drug discovery, based on several relevant parameters, such as year of grants awarded, amount awarded, support period, type of study section, administering institute center, type of grant, activity code, funding mechanism and amount granted, funding institute and support period, prominent program officers (by number of grants), location of recipient organizations, popular recipient organizations, organization type and amount granted to popular recipient.
- Chapter 10: provides an in-depth analysis of the various collaborations and partnerships that have been inked by stakeholders engaged in this domain, during the period 2017-2022. It includes a brief description of the partnership models (including acquisitions, joint ventures, platform development agreements, platform installation agreements, platform integration agreements, platform integration and development agreements, platform utilization agreements, product installation agreements, research and development agreements, service agreements and service alliances) adopted by stakeholders in this domain. Further, the partnership activity in this domain has been analyzed based on various parameters, such as year of partnership, type of partnership, analysis on most active players, regional analysis.
- Chapter 11: provides a detailed use-case study on the applications of quantum computing across various industries, such as chemical industry, cybersecurity, financial modeling, space sciences, oil and gas industry and weather forecasting, and its likely evolution in the foreseen future.
- Chapter 12: provides information on five competitive forces prevalent in this domain, including threats for new entrants, bargaining power of buyers, bargaining power of suppliers, threats of substitute product and rivalry among existing competitors.
- Chapter 13: provides the detailed analysis of the current and future market based on blue ocean strategy, covering a strategic plan / guide for emerging players in this domain to help unlock an uncontested market, featuring thirteen strategic tools that can help software providers to shift towards a blue ocean strategic market.
- Chapter 14: presents an insightful market forecast, highlighting the likely growth of the quantum computing in drug discovery services market till the year 2035. In order to provide details on the future opportunity, our projections have been segmented based on relevant parameters, such as drug discovery services offered (target identification / validation, hit generation / lead identification and lead optimization), type of therapeutic area (cardiovascular disorders, CNS disorders, dermatological disorders, endocrine disorders, gastrointestinal disorders, immunological disorders, infectious diseases, musculoskeletal disorders, oncological disorders, respiratory disorders and others), and key geographical regions ((North America (US and Canada), Europe (UK, France, Germany and Rest of the Europe), Asia-Pacific (China, Japan and Rest of the Asia Pacific), Latin America and Middle East and North Africa).
- Chapter 15: provides the transcripts of interviews conducted with key stakeholders in the industry.
- Chapter 16: is an appendix, which contains tabulated data and numbers for all the figures provided in the report.
- Chapter 17: is an appendix, which contains a list of companies and organizations mentioned in this report.
TABLE OF CONTENTS
1. PREFACE
- 1.1. Introduction
- 1.2. Key Market Insights
- 1.3. Scope of the Report
- 1.4. Research Methodology
- 1.5. Frequently Asked Questions
- 1.6. Chapter Outlines
2. EXECUTIVE SUMMARY
3. INTRODUCTION
- 3.1. Overview of Quantum Computing in Drug Discovery
- 3.2. Drug Discovery and Development Timeline
- 3.3. Historical Evolution of Computational Drug Discovery Approaches
- 3.4. Classification of Quantum Computing Approaches
- 3.5. Applications of Quantum Computing in Drug Discovery Process
- 3.6. Advantages of Quantum Computing in Drug Discovery
- 3.7. Challenges Associated with Quantum Computing in Drug Discovery
- 3.8. Future Perspectives
4. MARKET LANDSCAPE: SOFTWARE PROVIDERS
- 4.1. Quantum Computing Software Providers: Overall Market Landscape
- 4.1.1. Analysis by Year of Establishment
- 4.1.2. Analysis by Company Size
- 4.1.3. Analysis by Location of Headquarters
- 4.1.4. Analysis by Business Capabilities
- 4.1.5. Analysis by Platform Capabilities
- 4.1.6. Analysis by Type of Drug Discovery Service(s) Offered
- 4.1.7. Analysis by Type of Molecule(s) Supported
- 4.1.8. Analysis by Compatible Computational Approaches
- 4.1.9. Analysis by End User(s)
- 4.1.10. Analysis by Therapeutic Area(s)
5. COMPANY COMPETITIVENESS ANALYSIS
- 5.1. Methodology and Key Parameters
- 5.2 Scoring Criteria
- 5.3. Company Competitiveness Analysis: Players based in North America (Peer Group I)
- 5.4. Company Competitiveness Analysis: Players based in Europe (Peer Group II)
- 5.5. Company Competitiveness Analysis: Players based in Asia-Pacific and Rest of the World (Peer Group III)
6. COMPANY PROFILES: SOFTWARE PROVIDERS
- 6.1. Accenture
- 6.1.1. Company Overview
- 6.1.2. Financial Information
- 6.1.3. Service Portfolio
- 6.1.4. Recent Developments and Future Outlook
- 6.2. Atos
- 6.2.1. Company Overview
- 6.2.2. Financial Information
- 6.2.3. Service Portfolio
- 6.2.4. Recent Developments and Future Outlook
- 6.3. Fujitsu
- 6.3.1. Company Overview
- 6.3.2. Financial Information
- 6.3.3. Service Portfolio
- 6.3.4. Recent Developments and Future Outlook
- 6.4. Huawei
- 6.4.1. Company Overview
- 6.4.2. Financial Information
- 6.4.3. Service Portfolio
- 6.4.4. Recent Developments and Future Outlook
- 6.5. Microsoft
- 6.5.1. Company Overview
- 6.5.2. Financial Information
- 6.5.3. Service Portfolio
- 6.5.4. Recent Developments and Future Outlook
- 6.6. Xanadu
- 6.6.1. Company Overview
- 6.6.2. Service Portfolio
- 6.6.3. Recent Developments and Future Outlook
- 6.7. XtalPi
- 6.7.1. Company Overview
- 6.7.2. Service Portfolio
- 6.7.3. Recent Developments and Future Outlook
7. MARKET LANDSCAPE: HARDWARE PROVIDERS
- 7.1. Quantum Computing Hardware Providers: Overall Market Landscape
- 7.1.1. Analysis by Year of Establishment
- 7.1.2. Analysis by Company Size
- 7.1.3. Analysis by Region of Headquarters
- 7.1.4. Analysis by Location of Headquarters
- 7.1.5. Analysis by Type of Offering(s)
- 7.1.6. Analysis by Data Storage on Cloud
- 7.1.7. Analysis by Compatible Computational Approaches
- 7.1.8. Analysis by Type of Offering(s) and Compatible Computational Approaches
8. COMPANY PROFILES: HARDWARE PROVIDERS
- 8.1. Amazon Web Services
- 8.1.1. Company Overview
- 8.1.2. Financial Information
- 8.1.3. Service Portfolio
- 8.1.4. Recent Developments and Future Outlook
- 8.2. IBM
- 8.2.1. Company Overview
- 8.2.2. Financial Information
- 8.2.3. Service Portfolio
- 8.2.4. Recent Developments and Future Outlook
- 8.3. Microsoft
- 8.3.1. Company Overview
- 8.3.2. Financial Information
- 8.3.3. Service Portfolio
- 8.3.4. Recent Developments and Future Outlook
9. ACADEMIC GRANTS ANALYSIS
- 9.1. Analysis Methodology
- 9.2. Key Parameters
- 9.3. Analysis by Year of Grant
- 9.4. Analysis by Amount Awarded
- 9.5. Analysis by Support Period
- 9.6. Analysis by Study Section
- 9.7. Word Cloud Analysis: Emerging Focus Areas
- 9.8. Analysis by Administering Institute Center
- 9.9. Analysis by Type of Grant
- 9.10. Analysis by Activity Code
- 9.11. Analysis by Purpose of Grant
- 9.12. Analysis by Administering Institute Center and Support Period
- 9.13. Prominent Program Officers: Analysis by Number of Grants
- 9.14. Analysis by Location of Recipient Organizations
- 9.15. Analysis by Type of Organization
- 9.16. Popular Recipient Organizations: Analysis by Number of Grants
- 9.17. Popular Recipient Organizations: Analysis by Amount Awarded
10. PARTNERSHIPS AND COLLABORATIONS
- 10.1. Partnership Models
- 10.2. Quantum Computing in Drug Discovery, Drug Manufacturing and Other Services: Partnerships and Collaborations
- 10.3. Analysis by Year of Partnership
- 10.4. Analysis by Type of Partnership
- 10.5. Analysis by Year and Type of Partnership
- 10.6. Most Active Players: Analysis by Number of Partnerships
- 10.7. Word Cloud Analysis: Key Focus Areas
- 10.8. Analysis by Type of Continent
- 10.9. Analysis by Company Size and Type of Partnership
- 10.10. Local and Intercontinental Agreements
- 10.11. Intercontinental and Intracontinental Agreements
11. USE CASE STUDY
- 11.1. Overview of Quantum Computing
- 11.2. Applications of Quantum Computing Across Various Industries
- 11.3. Upcoming Trends in Quantum Computing
- 11.4. Future Perspectives
12. PORTER'S FIVE FORCES ANALYSIS
- 12.1. Methodology and Assumptions
- 12.2. Key Parameters
- 12.2.1. Threats of New Entrants
- 12.2.2. Bargaining Power of Buyers
- 12.2.3. Bargaining Power of Suppliers
- 12.2.4. Threats of Substitute Products
- 12.2.5. Rivalry among Existing Competitors
13. BLUE OCEAN STRATEGY: A STRATEGIC GUIDE FOR START-UPS TO ENTER INTO HIGHLY COMPETITIVE MARKET
- 13.1. Overview of Blue Ocean Strategy
- 13.1.1 Red Oceans
- 13.1.2 Blue Oceans
- 13.1.3 Comparison of Red Ocean Strategy and Blue Ocean Strategy
- 13.1.4. Quantum Computing in Drug Discovery Services Market: Blue Ocean Strategy and Shift Tools
- 13.1.4.1. Value Innovation
- 13.1.4.2. Strategy Canvas
- 13.1.4.3. Four Action Framework
- 13.1.4.4. Eliminate-Raise-Reduce-Create (ERRC) Grid
- 13.1.4.5. Six Path Framework
- 13.1.4.6. Pioneer-Migrator-Settler (PMS) Map
- 13.1.4.7. Three Tiers of Non-customers
- 13.1.4.8. Sequence of Blue Ocean Strategy
- 13.1.4.9. Buyer Utility Map
- 13.1.4.10. The Price Corridor of the Mass
- 13.1.4.11. Four Hurdles to Strategy Execution
- 13.1.4.12. Tipping Point Leadership
- 13.1.4.13. Fair Process
14. MARKET SIZING AND OPPORTUNITY ANALYSIS
- 14.1. Forecast Methodology and Key Assumptions
- 14.2. Quantum Computing in Drug Discovery Services Market, 2023-2035
- 14.2.1. Quantum Computing in Drug Discovery Services Market, 2023-2035: Analysis by Type of Drug Discovery Service Offered
- 14.2.1.1. Quantum Computing in Drug Discovery Services Market for Target Identification / Validation, 2023-2035
- 14.2.1.2. Quantum Computing in Drug Discovery Services Market for Hit Generation / Lead Identification, 2023-2035
- 14.2.1.3. Quantum Computing in Drug Discovery Services Market for Target Lead Optimization, 2023-2035
- 14.2.2. Quantum Computing in Drug Discovery Services Market, 2023-2035: Analysis by Therapeutic Area
- 14.2.2.1. Quantum Computing in Drug Discovery Services Market for Cardiovascular Disorders, 2023-2035
- 14.2.2.2. Quantum Computing in Drug Discovery Services Market for CNS Disorders, 2023-2035
- 14.2.2.3. Quantum Computing in Drug Discovery Services Market for Dermatological Disorders, 2023-2035
- 14.2.2.4. Quantum Computing in Drug Discovery Services Market for Endocrine Disorders, 2023-2035
- 14.2.2.5. Quantum Computing in Drug Discovery Services Market for Gastrointestinal Disorders, 2023-2035
- 14.2.2.6. Quantum Computing in Drug Discovery Services Market for Immunological Disorders, 2023-2035
- 14.2.2.7. Quantum Computing in Drug Discovery Services Market for Infectious Diseases, 2023-2035
- 14.2.2.8. Quantum Computing in Drug Discovery Services Market for Musculoskeletal Disorders, 2023-2035
- 14.2.2.9. Quantum Computing in Drug Discovery Services Market for Oncological Disorders, 2023-2035
- 14.2.2.10. Quantum Computing in Drug Discovery Services Market for Respiratory Disorders, 2023-2035
- 14.2.2.11. Quantum Computing in Drug Discovery Services Market for Others, 2023-2035
- 14.2.3. Quantum Computing in Drug Discovery Services Market, 2023-2035: Analysis by Key Geographical Regions
- 14.2.3.1. Quantum Computing in Drug Discovery Services Market in North America, 2023-2035
- 14.2.3.1.1. Quantum Computing in Drug Discovery Services Market in the US, 2023-2035
- 14.2.3.1.2. Quantum Computing in Drug Discovery Services Market in Canada, 2023-2035
- 14.2.3.2. Quantum Computing in Drug Discovery Services Market for Europe, 2023-2035
- 14.2.3.2.1. Quantum Computing in Drug Discovery Services Market in the UK, 2023-2035
- 14.2.3.2.2. Quantum Computing in Drug Discovery Services Market in France, 2023-2035
- 14.2.3.1.3. Quantum Computing in Drug Discovery Services Market in Germany, 2023-2035
- 14.2.3.1.4. Quantum Computing in Drug Discovery Services Market in Rest of the Europe, 2023-2035
- 14.2.3.3. Quantum Computing in Drug Discovery Services Market in Asia-Pacific, 2023-2035
- 14.2.3.3.1. Quantum Computing in Drug Discovery Services Market in China, 2023-2035
- 14.2.3.3.2. Quantum Computing in Drug Discovery Services Market in Japan, 2023-2035
- 14.2.3.3.3. Quantum Computing in Drug Discovery Services Market in Rest of Asia-Pacific, 2023-2035
- 14.2.3.4. Quantum Computing in Drug Discovery Services Market in Latin America, 2023-2035
- 14.2.3.5. Quantum Computing in Drug Discovery Services Market in Middle East and North Africa, 2023-2035
- 14.2.3.1. Quantum Computing in Drug Discovery Services Market in North America, 2023-2035
- 14.2.1. Quantum Computing in Drug Discovery Services Market, 2023-2035: Analysis by Type of Drug Discovery Service Offered
15. EXECUTIVE INSIGHTS
16. APPENDIX 1: TABULATED DATA
17. APPENDIX 2: LIST OF COMPANIES AND ORGANIZATIONS
