|
|
市場調査レポート
商品コード
1723658
非ウイルスドラッグデリバリーシステム市場(第3版):送達される分子タイプ別、送達される生物製剤タイプ別、使用される賦形剤タイプ別、標的治療領域別、主要地域別、主要企業別:2035年までの業界動向と世界の予測Non-Viral Drug Delivery Systems Market:3rd Edition by Type of Molecule Delivered, Type of Biologic Delivered, Type of Vehicle Used, Target Therapeutic Area, Key Geographical Regions and Leading Players: Industry Trends and Global Forecasts, till 2035 |
||||||
|
|||||||
カスタマイズ可能
|
|||||||

| 非ウイルスドラッグデリバリーシステム市場(第3版):送達される分子タイプ別、送達される生物製剤タイプ別、使用される賦形剤タイプ別、標的治療領域別、主要地域別、主要企業別:2035年までの業界動向と世界の予測 |
|
出版日: 2025年05月09日
発行: Roots Analysis
ページ情報: 英文 369 Pages
納期: 即日から翌営業日
|

全表示
- 概要
- 図表
- 目次
非ウイルスドラッグデリバリーシステム市場
世界の非ウイルスドラッグデリバリーシステムの市場規模は、現在86億米ドルとなっています。同市場は、予測期間中に9.0%のCAGRで拡大し、2035年までに204億米ドルに達すると予測されています。
非ウイルスドラッグデリバリーシステム市場の機会は、以下のセグメントに分布しています:
送達される分子タイプ別
- 生物製剤
- 低分子
送達される生物製剤タイプ別
- RNA
- DNA
- タンパク質/ペプチド
- 抗体
使用される賦形剤タイプ別
- ナノ粒子
- 細胞外小胞
- ポリマー
- オリゴヌクレオチド
- 細胞貫通ペプチド
標的治療領域別
- 腫瘍疾患
- 感染症
- 心血管疾患
- 遺伝子疾患
- 肝障害
- 代謝疾患
- 神経疾患
- 肺疾患
- 希少疾患
- その他の疾患
決済方法
- 契約一時金
- マイルストーン
主要地域別
- 北米(米国およびカナダ)
- 欧州(英国、ドイツ、ベルギー、アイルランド、デンマーク、その他欧州全域)
- アジア太平洋(韓国、オーストラリア、中国)
非ウイルスドラッグデリバリーシステム市場:成長と動向
非ウイルスドラッグデリバリーは、遺伝子材料や生物治療薬を細胞、組織、臓器に送達するためのウイルスベクターに代わる有望な選択肢となる革新的アプローチです。特に近年では、細胞内非ウイルスドラッグデリバリー法のいくつかが、ドラッグデリバリーの効率性により大きな支持を得ています。このように細胞内非ウイルスドラッグデリバリー法に対する利害関係者の関心が高まっているのは、安全性の向上、標的細胞に対する特異性の高さ、免疫反応を活性化するリスクの低減など、ウイルスベクターに比べて非ウイルスベクターに関連する様々な利点があるためと考えられます。さらに、非ウイルス性ベクターは突然変異発生の可能性を低くするため、遺伝子導入のための好ましい選択肢となります。また、アデノ随伴ウイルスベクターのようなウイルスベクターに比べ、より大きなペイロードを運ぶことができるため、標的ドラッグデリバリーへの応用が広がります。非ウイルス性ベクターの注目すべき例としては、ナノ粒子(特に脂質ナノ粒子)、細胞透過性ペプチド(CPP)、エクソソームベースのドラッグデリバリーシステムなどがあります。これらの非ウイルス性ベクターは、細胞内のタンパク質や酵素を標的とする特殊なメカニズムを活用し、一般的にはコンジュゲーションやカプセル化技術を利用して、RNA、ペプチド、抗体、タンパク質、DNAを細胞内に送達します。ドラッグデリバリーの標的化により、治療薬の適切な濃度が意図された生理学的作用部位に到達することが保証され、標的外作用や全身毒性を最小限に抑えながら、臨床効果を最大化することができます。さらに、細胞生物学とドラッグデリバリーシステムの進歩により、細胞膜内に局在するために以前は治療不可能と考えられていた潜在的な治療標的がいくつか発見されていることも重要です。
2024年9月、NanoSyrinxは、細胞内の届きにくい部位に生物製剤を送達するために設計された細胞内ナノシリンジ技術を前進させるため、1,300万米ドルのシード資金を確保しました。この開発について、エドウィン・モーゼス博士(NanoSyrinx取締役会長)は、「NanoSyrinxの技術は、治療薬の細胞内送達に関連する既存の課題に前向きな変化をもたらすことを約束します。私は取締役会に加わり、今回の資金調達の勢いをさらに加速させ、莫大な価値を生み出し、患者の生活に真の変化をもたらす可能性のあるこのユニークなプラットフォームのさらなる開発において、同社とそのリーダーシップチームを支援できることを嬉しく思います。
調査によると、発がん性タンパク質、細胞代謝調節因子、主要なシグナル伝達経路の構成要素など、ヒトプロテオームの20%以上が細胞膜内に局在しています。ヒトゲノムのわずか10%しか低分子薬剤で効果的に標的化できないことを考えると、業界の専門家は、細胞内治療、特に遺伝子デリバリーが従来の治療に代わる有力な選択肢になると見ています。非ウイルスドラッグデリバリーシステムの開発における技術革新の進行ペースと相まって、標的化非ウイルスドラッグデリバリーに対する需要が増加していることから、市場全体は予測期間中に大幅な市場成長が見込まれます。
非ウイルスドラッグデリバリーシステム市場:主要インサイト
当レポートでは、非ウイルスドラッグデリバリーシステム市場の現状を掘り下げ、業界内の潜在的な成長機会を特定しています。当レポートの主要なポイントは以下の通りです:
- システム/技術の45%以上は、薬物をカプセル化し、細胞質への送達を促進するビヒクルを採用しています。
- 非ウイルスドラッグデリバリーシステムに対する様々な利害関係者の関心の高まりが、関連する知的資本の拡大につながったことは明らかです。
- 50%以上の利害関係者が、さまざまな非ウイルスドラッグデリバリーシステム/技術のライセンス供与、統合、評価を目的としたパートナーシップを締結しました。
- 効果的な非ウイルス治療薬に対する需要の高まりから、非ウイルスドラッグデリバリーシステム市場全体は今後10年間で9%の成長が見込まれています。
非ウイルスドラッグデリバリーシステム市場:主要セグメント
分子のタイプ別では、世界市場は低分子と生物製剤に区分されます。これらのタイプの中で、生物製剤セグメントは現在の市場全体で最大のシェアを占めています。これは、特定の複雑な生物学的経路を標的とし、より高い精度と有効性を提供する能力に起因しています。
送達される生物製剤別では、世界の非ウイルスドラッグデリバリーシステム市場はRNA、DNA、タンパク質/ペプチド、抗体に区分されます。現在のところ、RNAセグメントが市場全体で最も高いシェアを占めています。しかし、抗体セグメントは予測期間中に比較的高いCAGRで成長すると予測されていることに留意することが重要です。
使用される賦形剤タイプ別では、世界の非ウイルスドラッグデリバリーシステム市場は、ナノ粒子、細胞外ベシクル、ポリマー、オリゴヌクレオチド、細胞貫通ペプチドにセグメント化されます。現在、ナノ粒子セグメントは非ウイルスドラッグデリバリーシステム市場をリードしています。この動向は今後も変わりそうにないことを強調しておきたいです。これは、ナノ粒子のユニークなサイズと表面積対体積比の大きさによるもので、特定の組織をターゲットとするために精密に設計することができ、他のドラッグデリバリービークルと比較して薬物放出の制御が可能です。
世界の非ウイルスドラッグデリバリーシステム市場は、対象とする治療領域別では、腫瘍性疾患、感染症、心血管疾患、遺伝性疾患、肝疾患、代謝性疾患、神経疾患、肺疾患、希少疾患、その他の疾患に区分されます。現在のところ、市場は腫瘍性疾患の治療を目的としたシステムから得られる収益が支配的です。しかし、急速に進化する病原体に対する効果的な標的治療が急務となっていることから、感染症市場は予測期間中に高い成長率を示すと予想されます。
世界の非ウイルスドラッグデリバリーシステム市場は、採用される決済タイプ別では、一時金とマイルストーン支払いに分布しています。現在のところ、アップフロントセグメントが非ウイルス薬デリバリーシステム市場で最も高いシェアを占めています。さらに、この動向は今後も変わりそうにないことを強調しておきたいです。
市場は主要地域別に北米、欧州、アジア太平洋に区分されます。現在のところ、北米が最大の市場シェアを占めています。さらに、アジア太平洋地域は予測期間中に比較的高いCAGRで成長すると予想されていることは注目に値します。
当レポートで答えている主な質問
- 現在、この市場に参入している企業は何社あるか
- この市場における主要企業
- この市場の進化に影響を与えそうな要因
- 現在と将来の市場規模
- この市場のCAGR
- 現在および将来の市場機会は主要市場セグメントにどのように分配されそうか
当レポートを購入する理由
- 当レポートは包括的な市場分析を提供し、市場全体と特定のサブセグメントに関する詳細な収益予測を提供します。この情報は、すでに市場をリードしている企業にとっても、新規参入企業にとっても貴重なものです。
- 利害関係者は、市場内の競争力学をより深く理解するためにレポートを活用することができます。競合情勢を分析することで、企業は、市場でのポジショニングを最適化し、効果的な市場参入戦略を開発するために、情報に基づいた意思決定を行うことができます。
- 当レポートは、主要促進要因・抑制要因・課題など、市場の包括的な概要を利害関係者に提供します。この情報は、利害関係者が市場動向を常に把握し、成長の見込みを活用するためのデータ主導の意思決定を行うための力となります。
その他の特典
- PPTインサイトパック
- レポート内の全分析モジュールの無料エクセルデータパック
- 10%の無料コンテンツカスタマイズ
- 調査チームによる詳細レポートのウォークスルーセッション
- レポートが6-12ヶ月以上前の場合、無料更新レポート
当レポートでは、世界の非ウイルスドラッグデリバリーシステム市場について調査し、市場の概要とともに、送達される分子タイプ別、送達される生物製剤タイプ別、使用される賦形剤タイプ別、標的治療領域別、主要地域別、主要企業別の動向、および市場に参入する企業のプロファイルなどを提供しています。
目次
セクションI:レポートの概要
第1章 序文
第2章 調査手法
第3章 市場力学
第4章 マクロ経済指標
セクションII:定性的な洞察
第5章 エグゼクティブサマリー
第6章 イントロダクション
セクションIII:市場概要
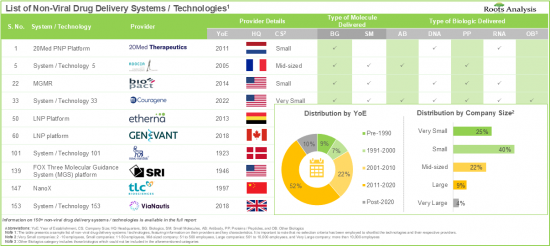
第7章 技術の情勢
- 章の概要
- 非ウイルス性ドラッグデリバリー:システム/技術の全体情勢
- 非ウイルス性ドラッグデリバリー:システム/技術プロバイダーの全体的情勢
第8章 技術競争力分析
- 章の概要
- 前提と主要なパラメータ
- 調査手法
- 非ウイルスドラッグデリバリーシステム/技術:技術競争力分析
セクションIV:企業プロファイル
第9章 企業プロファイル
- 章の概要
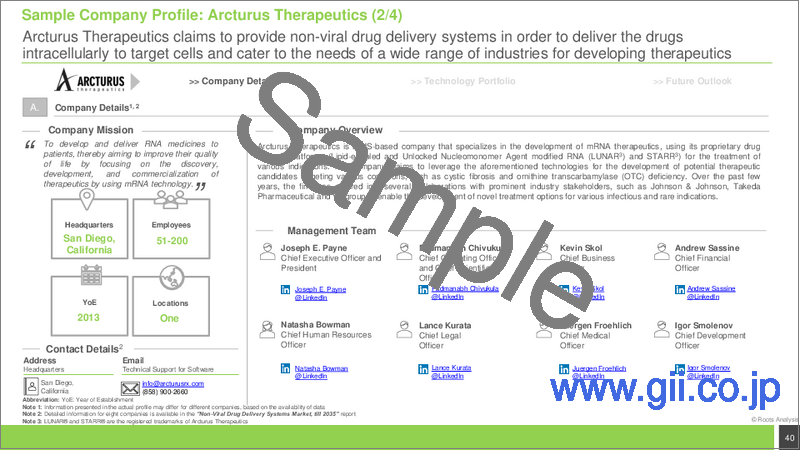
- Arcturus Therapeutics
- Bio-Path Holdings
- CureVac
- Entos Pharmaceuticals
- etherna
- Matinas Biopharma
- MDimune
- PCI Biotech
セクションV:市場動向
第10章 特許分析
- 章の概要
- 範囲と調査手法
- 非ウイルスドラッグデリバリーシステム/技術:特許分析
- 特許評価別分析
第11章 パートナーシップとコラボレーション
第12章 機会評価フレームワーク:KALBACHイノベーションモデル、競争評価
フレームワークとBCGマトリックス
- 章の概要
- KALBACHイノベーションモデル
- 競争評価フレームワーク
- BCGマトリックス
セクションVI:市場機会分析
第13章 世界の非ウイルスドラッグデリバリーシステム市場
- 章の概要
- 主要な前提と調査手法
- 世界の非ウイルスドラッグデリバリーシステム市場、2035年までの予測
- 主要な市場セグメンテーション
第14章 非ウイルスドラッグデリバリーシステム市場(送達される分子タイプ別)
第15章 非ウイルスドラッグデリバリーシステム市場(送達される生物製剤タイプ別)
第16章 非ウイルスドラッグデリバリーシステム市場(使用される賦形剤タイプ別)
第17章 非ウイルスドラッグデリバリーシステム市場(対象治療領域別)
第18章 非ウイルスドラッグデリバリーシステム市場(決済方法別)
第19章 非ウイルスドラッグデリバリーシステム市場(主要地域別)
第20章 非ウイルスドラッグデリバリーシステム市場(主要企業別)
セクションVII:その他の独占的洞察
第21章 結論
第22章 エグゼクティブ洞察
第23章 付録1:表形式データ
第24章 付録2:企業・団体一覧
List of Tables
- Table 7.1 Non-Viral Drug Delivery Systems / Technologies: Information on Type of Molecule Delivered and Type of Biologic Delivered
- Table 7.2 Non-Viral Drug Delivery Systems / Technologies: Information on Type of Interaction, Type of Vehicle Used and Number of Approved Drugs
- Table 7.3 Non-Viral Drug Delivery Systems / Technologies: List of Providers
- Table 9.1 Non-Viral Drug Delivery Systems / Technology Domain: List of Companies Profiled
- Table 9.2 Arcturus Therapeutics: Company Overview
- Table 9.3 Arcturus Therapeutics: Technology Portfolio
- Table 9.4 Arcturus Therapeutics: Recent Developments and Future Outlook
- Table 9.5 Bio-Path Holdings: Company Overview
- Table 9.6 Bio-Path Holdings: Technology Portfolio
- Table 9.7 Bio-Path Holdings: Recent Developments and Future Outlook
- Table 9.8 CureVac: Company Overview
- Table 9.9 CureVac: Technology Portfolio
- Table 9.10 CureVac: Recent Developments and Future Outlook
- Table 9.11 Entos Pharmaceuticals: Company Overview
- Table 9.12 Entos Pharmaceuticals: Technology Portfolio
- Table 9.13 Entos Pharmaceuticals: Recent Developments and Future Outlook
- Table 9.14 etherna: Company Overview
- Table 9.15 etherna: Technology Portfolio
- Table 9.16 etherna: Recent Developments and Future Outlook
- Table 9.17 Matinas Biopharma: Company Overview
- Table 9.18 Matinas Biopharma: Technology Portfolio
- Table 9.19 Matinas Biopharma: Recent Developments and Future Outlook
- Table 9.20 MDimune: Company Overview
- Table 9.21 MDimune: Technology Portfolio
- Table 9.22 MDimune: Recent Developments and Future Outlook
- Table 9.23 PCI Biotech: Company Overview
- Table 9.24 PCI Biotech: Technology Portfolio
- Table 9.25 PCI Biotech: Recent Developments and Future Outlook
- Table 10.1 Patent Analysis: Top Sections
- Table 10.2 Patent Analysis: Top Symbols
- Table 10.3 Patent Analysis: Top Codes
- Table 10.4 Patent Portfolio: Summary of Benchmarking Analysis
- Table 10.5 Patent Analysis: Categorization Based on Weighted Valuation Score
- Table 10.6 Patent Analysis: List of Relatively Higher Value Patents
- Table 11.1 Non-Viral Drug Delivery Systems / Technologies: List of Partnerships and Collaborations, Since 2020
- Table 11.2 Partnerships and Collaborations: Information on Type of Agreement
- Table 13.1 Non-Viral Drug Delivery Systems / Technologies: Average Upfront and Milestone Payments, Since 2020 (USD Million)
- Table 13.2 Leading Industry Players: Based on Number of Technology Licensing and Integration Deals
- Table 13.3 Leading Industry Players: Based on Number of Partnership Deals
- Table 23.1 Biond Biologics: Company Snapshot
- Table 23.2 Carmine Therapeutics: Company Snapshot
- Table 23.3 Eyevensys: Company Snapshot
- Table 23.4 Generation Bio: Company Snapshot
- Table 23.5 PCI Biotech: Company Snapshot
- Table 23.6 SRI International: Company Snapshot
- Table 24.1 Non-Viral Intracellular Drug Delivery Systems / Technologies: Distribution by Type of Molecule Delivered
- Table 24.2 Non-Viral Intracellular Drug Delivery Systems / Technologies: Distribution by Type of Biologic Delivered
- Table 24.3 Non-Viral Intracellular Drug Delivery Systems / Technologies: Distribution by Type of Drug Interaction
- Table 24.4 Non-Viral Intracellular Drug Delivery Systems / Technologies: Distribution by Type of Vehicle Used
- Table 24.5 Most Active Players: Distribution by Number of Approved Drugs
- Table 24.6 Non-Viral Intracellular Drug Delivery Technology Providers: Distribution by Year of Establishment
- Table 24.7 Non-Viral Intracellular Drug Delivery Technology Providers: Distribution by Company Size
- Table 24.8 Non-Viral Intracellular Drug Delivery Technology Providers: Distribution by Location of Headquarters
- Table 24.9 Non-Viral Intracellular Drug Delivery Technology Providers: Distribution by Company Size and Location of Headquarters
- Table 24.10 Non-Viral Intracellular Drug Delivery Technology Providers: Distribution by Company Size and Type of Molecule Delivered
- Table 24.11 Patent Analysis: Distribution by Type of Patent
- Table 24.12 Patent Analysis: Distribution by Publication Year
- Table 24.13 Patent Analysis: Distribution by Application Year
- Table 24.14 Patent Analysis: Distribution by Cumulative Number of Granted Patents
- Table 24.15 Patent Analysis: Distribution by Cumulative Number of Patent Applications
- Table 24.16 Patent Analysis: Distribution by Issuing Authority
- Table 24.17 Patent Analysis: Distribution by Cumulative Number of Patent Applications
- Table 24.18 Leading Industry Players: Distribution by Number of Patents
- Table 24.19 Leading Non-Industry Players: Distribution by Number of Patents
- Table 24.20 Leading Inventors: Distribution by Number of Patents
- Table 24.21 Patent Analysis: Distribution by Patent Age
- Table 24.22 Non-Viral Drug Delivery Technologies: Patent Valuation Analysis
- Table 24.23 Partnerships and Collaborations: Cumulative Year-wise Trend, Since 2020
- Table 24.24 Partnerships and Collaborations: Distribution by Type of Partnership
- Table 24.25 Partnerships and Collaborations: Distribution by Year and Type of Partnership, Since 2020
- Table 24.26 Partnerships and Collaborations: Distribution by Type of Partner
- Table 24.27 Partnerships and Collaborations: Distribution by Type of Molecule Delivered
- Table 24.28 Partnerships and Collaborations: Distribution by Type of Biologic Delivered
- Table 24.29 Partnerships and Collaborations: Distribution by Therapeutic Area
- Table 24.30 Most Active Players: Distribution by Number of Partnerships
- Table 24.31 Partnerships and Collaborations: Distribution by Local and International Agreements
- Table 24.32 Partnerships and Collaborations: Distribution by Intracontinental and Intercontinental Agreements
- Table 24.33 Opportunity Assessment Framework: Kalbach Innovation Model
- Table 24.34 Opportunity Assessment Framework: Competitive Assessment Model
- Table 24.35 Opportunity Assessment Framework: BCG Matrix
- Table 24.36 Global Non-Viral Drug Delivery Systems / Technologies Market, Forecasted Estimates, Till 2035 (USD Billion)
- Table 24.37 Global Non-Viral Drug Delivery Systems / Technologies Market, Forecasted Estimates, Till 2035: Conservative Case (USD Billion)
- Table 24.38 Global Non-Viral Drug Delivery Systems / Technologies Market, Forecasted Estimates, Till 2035: Optimistic Case (USD Billion)
- Table 24.39 Non-Viral Drug Delivery Systems / Technologies Market: Distribution by Type of Molecule Delivered
- Table 24.40 Non-Viral Drug Delivery Systems / Technologies Market for Biologics, Forecasted Estimates, Till 2035 (USD Billion)
- Table 24.41 Non-Viral Drug Delivery Systems / Technologies Market for Small Molecules, Forecasted Estimates, Till 2035 (USD Billion)
- Table 24.42 Non-Viral Drug Delivery Systems / Technologies Market: Distribution by Type of Biologic Delivered
- Table 24.43 Non-Viral Drug Delivery Systems / Technologies Market for RNA, Forecasted Estimates, Till 2035 (USD Billion)
- Table 24.44 Non-Viral Drug Delivery Systems / Technologies Market for DNA, Forecasted Estimates, Till 2035 (USD Billion)
- Table 24.45 Non-Viral Drug Delivery Systems / Technologies Market for Proteins / Peptides, Forecasted Estimates, Till 2035 (USD Billion)
- Table 24.46 Non-Viral Drug Delivery Systems / Technologies Market for Antibodies, Forecasted Estimates, Till 2035 (USD Billion)
- Table 24.47 Non-Viral Drug Delivery Systems / Technologies Market: Distribution by Type of Vehicle Used
- Table 24.48 Non-Viral Drug Delivery Systems / Technologies Market for Nanoparticles, Forecasted Estimates, Till 2035 (USD Billion)
- Table 24.49 Non-Viral Drug Delivery Systems / Technologies Market for Extracellular Vehicles, Forecasted Estimates, Till 2035 (USD Billion)
- Table 24.50 Non-Viral Drug Delivery Systems / Technologies Market for Polymers, Forecasted Estimates, Till 2035 (USD Billion)
- Table 24.51 Non-Viral Drug Delivery Systems / Technologies Market for Oligonucleotides, Forecasted Estimates, Till 2035 (USD Billion)
- Table 24.52 Non-Viral Drug Delivery Systems / Technologies Market for Cell Penetrating Peptides, Forecasted Estimates, Till 2035 (USD Billion)
- Table 24.53 Non-Viral Drug Delivery Systems / Technologies Market: Distribution by Type of Target Therapeutic Area
- Table 24.54 Non-Viral Drug Delivery Systems / Technologies Market for Oncological Disorders, Forecasted Estimates, Till 2035 (USD Billion)
- Table 24.55 Non-Viral Drug Delivery Systems / Technologies Market for Infectious Diseases, Forecasted Estimates, Till 2035 (USD Billion)
- Table 24.56 Non-Viral Drug Delivery Systems / Technologies Market for Cardiovascular Disorders, Forecasted Estimates, Till 2035 (USD Billion)
- Table 24.57 Non-Viral Drug Delivery Systems / Technologies Market for Genetic Disorders, Forecasted Estimates, Till 2035 (USD Billion)
- Table 24.58 Non-Viral Drug Delivery Systems / Technologies Market for Hepatic Disorders, Forecasted Estimates, Till 2035 (USD Billion)
- Table 24.59 Non-Viral Drug Delivery Systems / Technologies Market for Metabolic Disorders, Forecasted Estimates, Till 2035 (USD Billion)
- Table 24.60 Non-Viral Drug Delivery Systems / Technologies Market for Neurological Disorders, Forecasted Estimates, Till 2035 (USD Billion)
- Table 24.61 Non-Viral Drug Delivery Systems / Technologies Market for Pulmonary Disorders, Forecasted Estimates, Till 2035 (USD Billion)
- Table 24.62 Non-Viral Drug Delivery Systems / Technologies Market for Rare Disorders, Forecasted Estimates, Till 2035 (USD Billion)
- Table 24.63 Non-Viral Drug Delivery Systems / Technologies Market for Other Disorders, Forecasted Estimates, Till 2035 (USD Billion)
- Table 24.64 Non-Viral Drug Delivery Systems / Technologies Market: Distribution by Type of Payment Employed
- Table 24.65 Non-Viral Drug Delivery Systems / Technologies Market for Upfront Payments, Forecasted Estimates, Till 2035 (USD Billion)
- Table 24.66 Non-Viral Drug Delivery Systems / Technologies Market for Milestone Payments, Forecasted Estimates, Till 2035 (USD Billion)
- Table 24.67 Non-Viral Drug Delivery Systems / Technologies Market: Distribution by Key Geographical Regions
- Table 24.68 Non-Viral Drug Delivery Systems / Technologies Market in North America, Forecasted Estimates, Till 2035 (USD Billion)
- Table 24.69 Non-Viral Drug Delivery Systems / Technologies Market in the US, Forecasted Estimates, Till 2035 (USD Billion)
- Table 24.70 Non-Viral Drug Delivery Systems / Technologies Market in Canada, Forecasted Estimates, Till 2035 (USD Billion)
- Table 24.71 Non-Viral Drug Delivery Systems / Technologies Market n Europe, Forecasted Estimates, Till 2035 (USD Billion)
- Table 24.72 Non-Viral Drug Delivery Systems / Technologies Market in the UK, Forecasted Estimates, Till 2035 (USD Billion)
- Table 24.73 Non-Viral Drug Delivery Systems / Technologies Market in Germany, Forecasted Estimates, Till 2035 (USD Billion)
- Table 24.74 Non-Viral Drug Delivery Systems / Technologies Market in Belgium, Forecasted Estimates, Till 2035 (USD Billion)
- Table 24.75 Non-Viral Drug Delivery Systems / Technologies Market in Ireland, Forecasted Estimates, Till 2035 (USD Billion)
- Table 24.76 Non-Viral Drug Delivery Systems / Technologies Market in Denmark, Forecasted Estimates, Till 2035 (USD Billion)
- Table 24.77 Non-Viral Drug Delivery Systems / Technologies Market in Rest of Europe, Forecasted Estimates, Till 2035 (USD Billion)
- Table 24.78 Non-Viral Drug Delivery Systems / Technologies Market in Asia-Pacific, Forecasted Estimates, Till 2035 (USD Billion)
- Table 24.79 Non-Viral Drug Delivery Systems / Technologies Market in South Korea, Forecasted Estimates, Till 2035 (USD Billion)
- Table 24.80 Non-Viral Drug Delivery Systems / Technologies Market in Australia, Forecasted Estimates, Till 2035 (USD Billion)
- Table 24.81 Non-Viral Drug Delivery Systems / Technologies Market in China, Forecasted Estimates, Till 2035 (USD Billion)
NON-VIRAL DRUG DELIVERY SYSTEMS MARKET
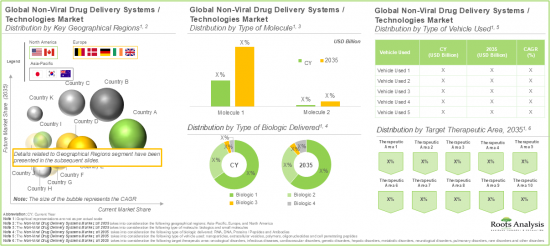
As per Roots Analysis, the global non-viral drug delivery systems market size is valued at $8.6 billion in the current year and is projected to reach $20.4 billion by 2035, growing at a CAGR of 9.0% during the forecast period.
The opportunity for non-viral drug delivery systems market has been distributed across the following segments:
Type of Molecule Delivered
- Biologics
- Small Molecules
Type of Biologics Delivered
- RNA
- DNA
- Proteins / Peptides
- Antibodies
Type of Vehicle Used
- Nanoparticles
- Extracellular Vesicles
- Polymers
- Oligonucleotides
- Cell Penetrating Peptides
Target Therapeutic Area
- Oncological Disorders
- Infectious Diseases
- Cardiovascular Disorders
- Genetic Disorders
- Hepatic Disorders
- Metabolic Disorders
- Neurological Disorders
- Pulmonary Disorders
- Rare Disorders
- Other Disorders
Type of Payment Employed
- Upfront Payments
- Milestone Payments
Key Geographical Regions
- North America (US and Canada)
- Europe (UK, Germany, Belgium, Ireland, Denmark and Rest of Europe)
- Asia-Pacific (South Korea, Australia and China)
NON-VIRAL DRUG DELIVERY SYSTEMS MARKET: GROWTH AND TRENDS
Non-viral drug delivery represents an innovative approach that serves as a promising alternative to viral vectors for delivering genetic material or biotherapeutics to cells, tissues or organs. Notably, in recent years, several intracellular non-viral drug delivery methods have gained significant traction owing to their efficiency in delivering drugs. This growing interest of stakeholders in intracellular non-viral drug delivery methods can be attributed to the various advantages associated with non-viral vectors over viral vectors, including enhanced safety, higher specificity towards the target cells and a reduced risk of activating immune responses. Moreover, non-viral vectors lower the likelihood of mutagenesis, making them a preferred option for gene delivery. They can also carry larger payloads compared to the viral vectors, such as adeno-associated viral vectors, increasing their applications in targeted drug delivery. Notable examples of non-viral vectors include nanoparticles (particularly lipid nanoparticles), cell penetrating peptides (CPPs) and exosome-based drug delivery systems. These non-viral vectors leverage specialized mechanisms to target intracellular proteins and enzymes, typically employing conjugation and / or encapsulation techniques to deliver RNA, peptides, antibodies, proteins and DNA into cells. Targeted drug delivery ensures that an adequate concentration of therapeutic agents reaches the intended physiological site of action, maximizing the clinical benefits while minimizing off-targets effects and systemic toxicity. Additionally, it is important to highlight that the ongoing advancements in cell biology and drug delivery systems have uncovered several potential therapeutic targets that were previously considered incurable owing to their localization within the cell membrane.
In September 2024, NanoSyrinx secured $13 million in seed funding to advance its intracellular nanosyringe technology, designed to target biologics in hard-to-reach sites within cells. Reflecting on the development, Dr. Edwin Moses (Chairman of Board of Directors, NanoSyrinx), quoted that "NanoSyrinx's technology promises to make a positive difference to the existing challenges associated with intracellular delivery of therapeutics. I am delighted to join the Board and help build on the momentum of this latest fundraise, to support the company and its leadership team in the further development of this unique platform which has the potential to create enormous value and make a real difference to patients' lives".
Research suggests that over 20% of the human proteome, including oncogenic proteins, cell metabolism regulators, and components of key signaling pathways are localized within the cell membrane. Given that only 10% of the human genome can be effectively targeted with small molecule drugs, industry experts see intracellular therapies, particularly gene delivery, as a compelling alternative to conventional treatments. Given the increasing demand for targeted non-viral drug delivery coupled with the ongoing pace of innovation in the development of non-viral drug delivery systems, the overall market is anticipated to witness substantial market growth during the forecast period.
NON-VIRAL DRUG DELIVERY SYSTEMS MARKET: KEY INSIGHTS
The report delves into the current state of the non-viral drug delivery systems market and identifies potential growth opportunities within the industry. The key takeaways of the report are:
- More than 45% of the systems / technologies employ vehicles that encapsulate the drug payloads and facilitate their delivery into the cytosol of the cell.
- The rising interest of various stakeholders in non-viral drug delivery systems has evidently led to the expansion of associated intellectual capital; notably, most (54%) of the patents were filed in the North American jurisdiction.
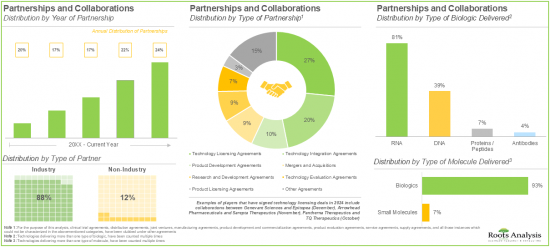
- More than 50% of the partnerships were signed by the stakeholders to license, integrate and evaluate different non-viral drug delivery systems / technologies; most of the inked deals focused on biologics, particularly RNA.
- Owing to the rising demand for effective non-viral therapeutics, the overall non-viral drug delivery systems market is anticipated to witness a growth of 9% over the next decade.
NON-VIRAL DRUG DELIVERY SYSTEMS MARKET: KEY SEGMENTS
Biologics are Likely to Hold the Largest Share of the Non-Viral Drug Delivery Systems Market During the Forecast Period
Based on the type of molecule, the global market is segmented into small molecules and biologics. Amongst these types, the biologics segment occupies the largest share of the current overall market. This can be attributed to their ability to target specific, complex biological pathways, offering greater precision and efficacy.
Based on the Type of Biologic Delivered, RNA Segment Captures the Majority of the Current Market Share
Based on the type of biologic delivered, the global non-viral drug delivery systems market is segmented into RNA, DNA, proteins / peptides and antibodies. Presently, the RNA segment occupies the highest share of the overall market. However, it is important to note that the antibodies' segment is anticipated to grow at a relatively higher CAGR during the forecast period.
Nanoparticles Segment is Likely to Hold the Largest Share in the Non-Viral Drug Delivery Systems Market During the Forecast Period
Based on the type of vehicle used, the global non-viral drug delivery systems market is segmented into nanoparticles, extracellular vesicles, polymers, oligonucleotides and cell penetrating peptides. Currently, nanoparticles segment leads the non-viral drug delivery systems market. It is important to highlight that this trend is unlikely to change in the future as well. This is due to the unique size and large surface area-to-volume ratio of nanoparticles which enables them to be precisely engineered in order to target specific tissues, allowing for controlled drug release as compared to other drug delivery vehicles.
Non-Viral Drug Delivery Systems Market for Oncological Disorders is Likely to Grow at a Relatively Faster Pace During the Forecast Period
Based on the target therapeutic area, the global non-viral drug delivery systems market is segmented across oncological disorders, infectious diseases, cardiovascular disorders, genetic disorders, hepatic disorders, metabolic disorders, neurological disorders, pulmonary disorders, rare disorders and other disorders. Presently, the market is dominated by the revenues generated through the systems intended for the treatment of oncological disorders. However, the market for infectious disease is anticipated to witness a higher growth rate during the forecast period owing to the pressing need for effective targeted treatments against rapidly evolving pathogens.
Upfront Payments are Likely to Dominate the Non-Viral Drug Delivery Systems Market During the Forecast Period
Based on the type of payment employed, the global non-viral delivery systems market is distributed across upfront payments and milestone payments. Presently, the upfront segment occupies the highest share in the non-viral drug delivery systems market. Further, it is important to highlight that this trend is unlikely to change in the future as well.
North America Accounts for the Largest Share in the Market
Based on key geographical regions, the market is segmented into North America, Europe, and Asia Pacific. In the current scenario, North America is likely to capture the largest market share. Further, it is worth highlighting that Asia-Pacific is expected to grow at a relatively high CAGR during the forecast period.
Example Players in the Non-Viral Drug Delivery Systems Market
- Arcturus Therapeutics
- Bio-Path Holdings
- CureVac
- Entos Pharmaceuticals
- etherna
- Matinas Biopharma
- MDimune
- PCI Biotech
NON-VIRAL DRUG DELIVERY SYSTEMS MARKET: RESEARCH COVERAGE
The report on non-viral drug delivery systems market features insights into various sections, including:
- Market Sizing and Opportunity Analysis: An in-depth analysis of current market opportunity and the future growth potential of non-viral drug delivery systems market, focusing on key market segments, including [A] type of molecule delivered, [B] type of biologic delivered, [C] type of vehicle used, [D] target therapeutic area, [E] type of payment employed, [F] key geographical regions, and [G] leading players.
- Market Impact Analysis: A thorough analysis of various factors, such as [A] drivers, [B] restraints, [C] opportunities, and [D] existing challenges that are likely to impact market growth.
- Technology Market Landscape: A comprehensive evaluation of non-viral drug delivery systems / technologies, based on several relevant parameters, such as [A] type of molecule delivered, [B] type of biologic delivered, [C] type of drug interaction, and [D] type of vehicle used.
- Non-Viral Drug Delivery Systems / Technology Providers Landscape: The report features a list of systems / technology providers engaged in the non-viral drug delivery domain, along with analyses based on [A] year of establishment, [B] company size [C] location of headquarters, and [D] most active players.
- Technology Competitiveness Analysis: An insightful competitiveness analysis of the non-viral drug delivery systems / technologies, based on various relevant parameters, such as [A] company strength, and [B] technology strength.
- Company Profiles: Comprehensive profiles of key industry players in the non-viral drug delivery systems domain, featuring information on [A] company overview, [B] financial information (if available), [C] technology portfolio, [D] recent developments, and [E] future outlook statements.
- Patent Analysis: An in-depth analysis of various patents that have been filed / granted by various systems / technology providers related to non-viral drug delivery, based on various relevant parameters, such as [A] type of patent, [B] publication year, [C] application year, [D] issuing authority, [E] type of player, [F] top sections, [G] leading industry players (in terms of number of patents), [H] leading non-industry players (in terms of number of patents), [I] leading inventors, [J] patent benchmarking analysis, and [K] patent valuation.
- Partnerships and Collaborations: A detailed analysis of partnerships inked between stakeholders in the non-viral drug delivery market, since 2020, based on several relevant parameters, such as [A] year of partnership, [B] type of partnership, [C] type of partner, [D] type of molecule delivered, [E] type of biologic delivered, [F] therapeutic area, [G] most active players (in terms of number of partnerships), and [H] geography.
- Opportunity Assessment Framework, Kalbach Innovation Model, Competitive Assessment Framework and BCG Matrix: An insightful framework which provides Kalbach, Ansoff and BCG matrix for respective non-viral drug delivery technologies currently employed by stakeholders across four zones of evaluation and product portfolio matrix based on various parameters, such as [A] number of drugs in the pipeline, [B] number of companies, [C] deal amount, [D] partnership activity, [E] trends related to grants, [F] number of publications, [G] google hits and qualitative scoring. It also provides Kalbach, Ansoff and BCG matrix for respective non-viral drug delivery technologies currently employed by stakeholders.
KEY QUESTIONS ANSWERED IN THIS REPORT
- How many companies are currently engaged in this market?
- Which are the leading companies in this market?
- What factors are likely to influence the evolution of this market?
- What is the current and future market size?
- What is the CAGR of this market?
- How is the current and future market opportunity likely to be distributed across key market segments?
REASONS TO BUY THIS REPORT
- The report provides a comprehensive market analysis, offering detailed revenue projections of the overall market and its specific sub-segments. This information is valuable to both established market leaders and emerging entrants.
- Stakeholders can leverage the report to gain a deeper understanding of the competitive dynamics within the market. By analyzing the competitive landscape, businesses can make informed decisions to optimize their market positioning and develop effective go-to-market strategies.
- The report offers stakeholders a comprehensive overview of the market, including key drivers, barriers, opportunities, and challenges. This information empowers stakeholders to stay abreast of market trends and make data-driven decisions to capitalize on growth prospects.
ADDITIONAL BENEFITS
- Complimentary PPT Insights Packs
- Complimentary Excel Data Packs for all Analytical Modules in the Report
- 10% Free Content Customization
- Detailed Report Walkthrough Session with Research Team
- Free Updated report if the report is 6-12 months old or older
TABLE OF CONTENTS
SECTION I: REPORT OVERVIEW
1. PREFACE
- 1.1. Introduction
- 1.2. Market Share Insights
- 1.3. Key Market Insights
- 1.4. Report Coverage
- 1.5. Key Questions Answered
- 1.6. Chapter Outlines
2. RESEARCH METHODOLOGY
- 2.1. Chapter Overview
- 2.2. Research Assumptions
- 2.2.1. Market Landscape and Market Trends
- 2.2.2. Market Forecast and Opportunity Analysis
- 2.2.3. Comparative Analysis
- 2.3. Database Building
- 2.3.1. Data Collection
- 2.3.2. Data Validation
- 2.3.3. Data Analysis
- 2.4. Project Methodology
- 2.4.1. Secondary Research
- 2.4.1.1. Annual Reports
- 2.4.1.2. Academic Research Papers
- 2.4.1.3. Company Websites
- 2.4.1.4. Investor Presentations
- 2.4.1.5. Regulatory Filings
- 2.4.1.6. White Papers
- 2.4.1.7. Industry Publications
- 2.4.1.8. Conferences and Seminars
- 2.4.1.9. Government Portals
- 2.4.1.10. Media and Press Releases
- 2.4.1.11. Newsletters
- 2.4.1.12. Industry Databases
- 2.4.1.13. Roots Proprietary Databases
- 2.4.1.14. Paid Databases and Sources
- 2.4.1.15. Social Media Portals
- 2.4.1.16. Other Secondary Sources
- 2.4.2. Primary Research
- 2.4.2.1. Types of Primary Research
- 2.4.2.1.1. Qualitative Research
- 2.4.2.1.2. Quantitative Research
- 2.4.2.1.3. Hybrid Approach
- 2.4.2.2. Advantages of Primary Research
- 2.4.2.3. Techniques for Primary Research
- 2.4.2.3.1. Interviews
- 2.4.2.3.2. Surveys
- 2.4.2.3.3. Focus Groups
- 2.4.2.3.4. Observational Research
- 2.4.2.3.5. Social Media Interactions
- 2.4.2.4. Key Opinion Leaders Considered in Primary Research
- 2.4.2.4.1. Company Executives (CXOs)
- 2.4.2.4.2. Board of Directors
- 2.4.2.4.3. Company Presidents and Vice Presidents
- 2.4.2.4.4. Research and Development Heads
- 2.4.2.4.5. Technical Experts
- 2.4.2.4.6. Subject Matter Experts
- 2.4.2.4.7. Scientists
- 2.4.2.4.8. Doctors and Other Healthcare Providers
- 2.4.2.5. Ethics and Integrity
- 2.4.2.5.1. Research Ethics
- 2.4.2.5.2. Data Integrity
- 2.4.2.1. Types of Primary Research
- 2.4.3. Analytical Tools and Databases
- 2.4.1. Secondary Research
- 2.5. Robust Quality Control
3. MARKET DYNAMICS
- 3.1. Chapter Overview
- 3.2. Forecast Methodology
- 3.2.1. Top-down Approach
- 3.2.2. Bottom-up Approach
- 3.2.3. Hybrid Approach
- 3.3. Market Assessment Framework
- 3.3.1. Total Addressable Market (TAM)
- 3.3.2. Serviceable Addressable Market (SAM)
- 3.3.3. Serviceable Obtainable Market (SOM)
- 3.3.4. Currently Acquired Market (CAM)
- 3.4. Forecasting Tools and Techniques
- 3.4.1. Qualitative Forecasting
- 3.4.2. Correlation
- 3.4.3. Regression
- 3.4.4. Extrapolation
- 3.4.5. Convergence
- 3.4.6. Sensitivity Analysis
- 3.4.7. Scenario Planning
- 3.4.8. Data Visualization
- 3.4.9. Time Series Analysis
- 3.4.10. Forecast Error Analysis
- 3.5. Key Considerations
- 3.5.1. Demographics
- 3.5.2. Government Regulations
- 3.5.3. Reimbursement Scenarios
- 3.5.4. Market Access
- 3.5.5. Supply Chain
- 3.5.6. Industry Consolidation
- 3.5.7. Pandemic / Unforeseen Disruptions Impact
- 3.6. Limitations
4. MACRO-ECONOMIC INDICATORS
- 4.1. Chapter Overview
- 4.2. Market Dynamics
- 4.2.1. Time Period
- 4.2.1.1. Historical Trends
- 4.2.1.2. Current and Forecasted Estimates
- 4.2.2. Currency Coverage
- 4.2.2.1. Major Currencies Affecting the Market
- 4.2.2.2. Factors Affecting Currency Fluctuations
- 4.2.2.3. Impact of Currency Fluctuations on the Industry
- 4.2.3. Foreign Currency Exchange Rate
- 4.2.3.1. Impact of Foreign Exchange Rate Volatility on the Market
- 4.2.3.2. Strategies for Mitigating Foreign Exchange Risk
- 4.2.4. Recession
- 4.2.4.1. Assessment of Current Economic Conditions and Potential Impact on the Market
- 4.2.4.2. Historical Analysis of Past Recessions and Lessons Learnt
- 4.2.5. Inflation
- 4.2.5.1. Measurement and Analysis of Inflationary Pressures in the Economy
- 4.2.5.2. Potential Impact of Inflation on Market Evolution
- 4.2.6. Interest Rates
- 4.2.6.1. Interest Rates and Their Impact on Market
- 4.2.6.2. Strategies for Managing Interest Rate Risk
- 4.2.7. Commodity Flow Analysis
- 4.2.7.1. Type of Commodity
- 4.2.7.2. Origins and Destinations
- 4.2.7.3. Values and Weights
- 4.2.7.4. Modes of Transportation
- 4.2.8. Global Trade Dynamics
- 4.2.8.1. Import Scenario
- 4.2.8.2. Export Scenario
- 4.2.8.3. Trade Policies
- 4.2.8.4. Strategies for Mitigating the Risks Associated with Trade Barriers
- 4.2.8.5. Impact of Trade Barriers on the Market
- 4.2.9. War Impact Analysis
- 4.2.9.1. Russian-Ukraine War
- 4.2.9.2. Israel-Hamas War
- 4.2.10. COVID Impact / Related Factors
- 4.2.10.1. Global Economic Impact
- 4.2.10.2. Industry-specific Impact
- 4.2.10.3. Government Response and Stimulus Measures
- 4.2.10.4. Future Outlook and Adaptation Strategies
- 4.2.11. Other Indicators
- 4.2.11.1. Fiscal Policy
- 4.2.11.2. Consumer Spending
- 4.2.11.3. Gross Domestic Product (GDP)
- 4.2.11.4. Employment
- 4.2.11.5. Taxes
- 4.2.11.6. Stock Market Performance
- 4.2.11.7. Cross-Border Dynamics
- 4.2.1. Time Period
- 4.3. Conclusion
SECTION II: QUALITATIVE INSIGHTS
5. EXECUTIVE SUMMARY
6. INTRODUCTION
- 6.1. Chapter Overview
- 6.2. Need for Targeted Drug Delivery
- 6.3. Advanced Approaches for Delivery of Drug Payloads
- 6.3.1. Nanoparticular Delivery Systems
- 6.3.1.1. Liposomes
- 6.3.1.2. Nanoparticles / Microparticles
- 6.3.1.3. Poly-ethylene Glycol (PEG)
- 6.3.1.4. Cell Penetrating Peptides (CPPs)
- 6.3.2. Other Drug Delivery Technologies
- 6.3.1. Nanoparticular Delivery Systems
- 6.4. Future Perspectives
SECTION III: MARKET OVERVIEW
7. TECHNOLOGY LANDSCAPE
- 7.1. Chapter Overview
- 7.2. Non-Viral Drug Delivery: Overall Systems / Technology Landscape
- 7.2.1. Analysis by Type of Molecule Delivered
- 7.2.2. Analysis by Type of Biologic Delivered
- 7.2.3. Analysis by Type of Drug Interaction
- 7.2.4. Analysis by Type of Vehicle Used
- 7.2.5. Analysis by Most Active Players
- 7.3. Non-Viral Drug Delivery: Overall Systems / Technology Providers Landscape
- 7.3.1. Analysis by Year of Establishment
- 7.3.2. Analysis by Company Size
- 7.3.3. Analysis by Location of Headquarters
- 7.3.4. Analysis by Company Size and Location of Headquarters
- 7.3.5. Analysis by Company Size and Type of Molecule Delivered
8. TECHNOLOGY COMPETITIVENESS ANALYSIS
- 8.1. Chapter Overview
- 8.2. Assumptions and Key Parameters
- 8.3. Methodology
- 8.4. Non-Viral Drug Delivery Systems / Technologies: Technology Competitiveness Analysis
- 8.4.1. Non-Viral Drug Delivery Systems / Technologies of Players based in North America
- 8.4.2. Non-Viral Drug Delivery Systems / Technologies of Players based in Europe
- 8.4.3. Non-Viral Drug Delivery Systems / Technologies of Players based in Asia-Pacific and Rest of the World
SECTION IV: COMPANY PROFILES
9. COMPANY PROFILES
- 9.1. Chapter Overview
- 9.2. Arcturus Therapeutics
- 9.2.1. Company Overview
- 9.2.2. Technology Portfolio
- 9.2.3. Recent Developments and Future Outlook
- 9.3. Bio-Path Holdings
- 9.4. CureVac
- 9.5. Entos Pharmaceuticals
- 9.6. etherna
- 9.7. Matinas Biopharma
- 9.8. MDimune
- 9.9. PCI Biotech
SECTION V: MARKET TRENDS
10. PATENT ANALYSIS
- 10.1. Chapter Overview
- 10.2. Scope and Methodology
- 10.3. Non-Viral Drug Delivery Systems / Technologies: Patent Analysis
- 10.3.1. Analysis by Type of Patent
- 10.3.2. Analysis by Publication Year
- 10.3.3. Analysis by Application Year
- 10.3.4. Analysis by Cumulative Number of Annual Granted Patents
- 10.3.5. Analysis by Cumulative Number of Patent Applications
- 10.3.6. Analysis by Issuing Authority
- 10.3.7. Analysis by Type of Player
- 10.3.8. Analysis by Top Sections
- 10.3.9. Leading Industry Players: Analysis by Number of Patents
- 10.3.10. Leading Non-Industry Players: Analysis by Number of Patents
- 10.3.11. Leading Inventors: Analysis by Number of Patents
- 10.3.12. Non-Viral Drug Delivery Systems / Technologies: Patent Benchmarking Analysis
- 10.4. Analysis by Patent Valuation
11. PARTNERSHIPS AND COLLABORATIONS
- 11.1. Chapter Overview
- 11.2. Partnerships and Collaborations
- 11.3. Partnership Models
- 11.4. Non-Viral Drug Delivery Systems / Technologie: List of Partnerships and Collaborations
- 11.4.1. Analysis by Year of Partnership
- 11.4.2. Analysis by Type of Partnership
- 11.4.3. Analysis by Year and Type of Partnership
- 11.4.4. Analysis by Type of Partner
- 11.4.5. Analysis by Type of Molecule Delivered
- 11.4.6. Analysis by Type of Biologic Delivered
- 11.4.7. Analysis by Therapeutic Area
- 11.4.8. Most Active Players: Analysis by Number of Partnerships
- 11.4.9. Analysis by Geography
- 11.4.9.1. Local and International Agreements
- 11.4.9.2. Intracontinental and Intercontinental Agreements
12. OPPORTUNITY ASSESSMENT FRAMEWORK: KALBACH INNOVATION MODEL, COMPETITIVE ASSESSMENT
FRAMEWORK AND BCG MATRIX
- 12.1 Chapter Overview
- 12.2. Kalbach Innovation Model
- 12.2.1. Key Assumptions and Methodologies
- 12.2.2. Analysis by Trends in Research Activity
- 12.2.3. Analysis by Trends in Investment Activity
- 12.2.4. Analysis by Trends in Partnership Activity
- 12.2.5. Analysis by Number of Technologies
- 12.2.6. Analysis by Trends in Deal Amount
- 12.2.7. Analysis by Number of Google Hits
- 12.2.8. Qualitative and Quantitative Assessment based on Secondary and Primary Research
- 12.2.9. Kalbach Innovation Model: Analysis Output
- 12.3. Competitive Assessment Framework
- 12.3.1. Key Assumptions and Methodology
- 12.3.2. Competitive Assessment Framework: Analysis Output
- 12.4. BCG Matrix
- 12.4.1. Key Assumptions and Methodology
- 12.4.2. BCG Matrix: Output Analysis
SECTION VI: MARKET OPPORTUNITY ANALYSIS
13. GLOBAL NON-VIRAL DRUG DELIVERY SYSTEMS MARKET
- 13.1. Chapter Overview
- 13.2. Key Assumptions and Methodology
- 13.3. Global Non-Viral Drug Delivery Systems Market, Forecasted Estimates, Till 2035
- 13.3.1. Multivariate Scenario Analysis
- 13.3.1.1. Conservative Scenario
- 13.3.1.2. Optimistic Scenario
- 13.3.1. Multivariate Scenario Analysis
- 13.4. Key Market Segmentations
14. NON-VIRAL DRUG DELIVERY SYSTEMS MARKET, BY TYPE OF MOLECULE DELIVERED
- 14.1. Chapter Overview
- 14.2. Key Assumptions and Methodology
- 14.3. Non-Viral Drug Delivery Systems Market: Distribution by Type of Molecule Delivered
- 14.3.1. Non-Viral Drug Delivery Systems Market for Biologics, Forecasted Estimates, Till 2035
- 14.3.2. Non-Viral Drug Delivery Systems Market for Small Molecules, Forecasted Estimates, Till 2035
- 14.4. Data Triangulation and Validation
15. NON-VIRAL DRUG DELIVERY SYSTEMS MARKET, BY TYPE OF BIOLOGIC DELIVERED
- 15.1. Chapter Overview
- 15.2. Key Assumptions and Methodology
- 15.3. Non-Viral Drug Delivery Systems Market: Distribution by Type of Biologic Delivered
- 15.3.1. Non-Viral Drug Delivery Systems Market for RNA, Forecasted Estimates, Till 2035
- 15.3.2. Non-Viral Drug Delivery Systems Market for DNA, Forecasted Estimates, Till 2035
- 15.3.3. Non-Viral Drug Delivery Systems Market for Proteins / Peptides, Forecasted Estimates, Till 2035
- 15.3.4. Non-Viral Drug Delivery Systems Market for Antibodies, Forecasted Estimates, Till 2035
- 15.4. Data Triangulation and Validation
16. NON-VIRAL DRUG DELIVERY SYSTEMS MARKET, BY TYPE OF VEHICLE USED
- 16.1. Chapter Overview
- 16.2. Key Assumptions and Methodology
- 16.3. Non-Viral Drug Delivery Systems Market: Distribution by Type of Vehicle Used
- 16.3.1. Non-Viral Drug Delivery Systems Market for Nanoparticles, Forecasted Estimates, Till 2035
- 16.3.2. Non-Viral Drug Delivery Systems Market for Extracellular Vesicles, Forecasted Estimates, Till 2035
- 16.3.3. Non-Viral Drug Delivery Systems Market for Polymers, Forecasted Estimates, Till 2035
- 16.3.4. Non-Viral Drug Delivery Systems Market for Oligonucleotides, Forecasted Estimates, Till 2035
- 16.3.5. Non-Viral Drug Delivery Systems Market for Cell Penetrating Peptides, Forecasted Estimates, Till 2035
- 16.4. Data Triangulation and Validation
17. NON-VIRAL DRUG DELIVERY SYSTEMS MARKET, BY TARGET THERAPEUTIC AREA
- 17.1. Chapter Overview
- 17.2. Key Assumptions and Methodology
- 17.3. Non-Viral Drug Delivery Systems Market: Distribution by Target Therapeutic Area
- 17.3.1. Non-Viral Drug Delivery Systems Market for Oncological Diseases, Forecasted Estimates, Till 2035
- 17.3.2. Non-Viral Drug Delivery Systems Market for Infectious Disorders, Forecasted Estimates, Till 2035
- 17.3.3. Non-Viral Drug Delivery Systems Market for Cardiovascular Disorders, Forecasted Estimates, Till 2035
- 17.3.4. Non-Viral Drug Delivery Systems Market for Genetic Diseases, Forecasted Estimates, Till 2035
- 17.3.5. Non-Viral Drug Delivery Systems Market for Hepatic Disorders, Forecasted Estimates, Till 2035
- 17.3.6. Non-Viral Drug Delivery Systems Market for Metabolic Disorders, Forecasted Estimates, Till 2035
- 17.3.7. Non-Viral Drug Delivery Systems Market for Neurological Disorders, Forecasted Estimates, Till 2035
- 17.3.8. Non-Viral Drug Delivery Systems Market for Pulmonary Disorders, Forecasted Estimates, Till 2035
- 17.3.9. Non-Viral Drug Delivery Systems Market for Rare Disorders, Forecasted Estimates, Till 2035
- 17.3.10. Non-Viral Drug Delivery Systems Market for Other Disorders, Forecasted Estimates, Till 2035
- 17.4. Data Triangulation and Validation
18. NON-VIRAL DRUG DELIVERY SYSTEMS MARKET, BY TYPE OF PAYMENT EMPLOYED
- 18.1. Chapter Overview
- 18.2. Key Assumptions and Methodology
- 18.3. Revenue Shift Analysis
- 18.4. Non-Viral Drug Delivery Systems Market: Distribution by Type of Payment Employed
- 18.4.1. Non-Viral Drug Delivery Systems Market for Upfront Payments, Forecasted Estimates, Till 2035
- 18.4.2. Non-Viral Drug Delivery Systems Market for Milestone Payments, Forecasted Estimates, Till 2035
- 18.5. Data Triangulation and Validation
19. NON-VIRAL DRUG DELIVERY SYSTEMS MARKET, BY KEY GEOGRAPHICAL REGIONS
- 19.1. Chapter Overview
- 19.2. Key Assumptions and Methodology
- 19.3. Non-Viral Drug Delivery Systems Market: Distribution by Key Geographical Regions
- 19.3.1. Non-Viral Drug Delivery Systems Market in North America, Forecasted Estimates, Till 2035
- 19.3.2. Non-Viral Drug Delivery Systems Market in Europe, Forecasted Estimates, Till 2035
- 19.3.3. Non-Viral Drug Delivery Systems Market in Asia-Pacific, Forecasted Estimates, Till 2035
- 19.4. Penetration-Growth (P-G) Matrix
- 19.5. Data Triangulation and Validation
20. NON-VIRAL DRUG DELIVERY SYSTEMS MARKET, BY LEADING PLAYERS
SECTION VII: OTHER EXCLUSIVE INSIGHTS
21. CONCLUDING REMARKS
22. EXECUTIVE INSIGHTS
- 22.1. Chapter Overview
- 22.2. Small Company, Israel
- 22.2.1. Company Snapshot
- 22.2.2. Interview Transcript
- 22.3. Small Company, US
- 22.3.1. Company Snapshot
- 22.3.2. Interview Transcript
- 22.4. Small Company, France
- 22.4.1. Company Snapshot
- 22.4.2. Interview Transcript
- 22.5. Mid-sized Company, US
- 22.5.1. Company Snapshot
- 22.5.2. Interview Transcript
- 22.6. Small Company, Norway
- 22.6.1. Company Snapshot
- 22.6.2. Interview Transcript
- 22.7. Large Company, US
- 22.7.1. Company Snapshot
- 22.7.2. Interview Transcript

