
|
市場調査レポート
商品コード
1616874
医療機器CROの世界市場 - 対象治療領域別、事業規模別、機器クラス別、提供する臨床サービスのタイプ別、提供する前臨床サービスのタイプ別、地域別:2035年までの業界動向と世界の予測Medical Device CRO Market by Target Therapeutic Area, Scale of Operation, Device Class, Type of Clinical Service Offered, Type of Preclinical Service Offered and Key Geographies : Industry Trends and Global Forecasts, Till 2035 |
||||||
カスタマイズ可能
|
|||||||
| 医療機器CROの世界市場 - 対象治療領域別、事業規模別、機器クラス別、提供する臨床サービスのタイプ別、提供する前臨床サービスのタイプ別、地域別:2035年までの業界動向と世界の予測 |
|
出版日: 2024年12月05日
発行: Roots Analysis
ページ情報: 英文 552 Pages
納期: 即日から翌営業日
|

全表示
- 概要
- 図表
- 目次
世界の医療機器CROの市場規模は、2035年までの予測期間中に3.4%のCAGRで拡大し、現在の133億米ドルから2035年までに193億米ドルに成長すると予測されています。
高齢者人口の増加と慢性疾患を中心とした疾病の発生により、複数の治療領域にわたる新規医療機器の需要が急増しています。2020年以降、米国FDAは~105の医療機器を承認しています。さらに、毎年35以上の医療機器がFDAの承認を受けていることは興味深いです。しかし、この業界が直面する主な課題の1つは、新しい医療機器の製品開発ライフサイクルが時間がかかり複雑であることです。特に、臨床段階は非常に多くのリソースを必要とし、高いコストと大きなリスクを伴います。さらに、医療機器の安全性を確保するための規制ガイドラインが厳しく、業界のリーダーにとってはより困難なものとなっています。
上記のボトルネックに対処するため、医療機器開発企業は、医療機器専門のCROに研究業務を積極的にアウトソーシングしています。これらの組織は、臨床試験の実施、規制要件のナビゲート、安全基準の遵守を確保するための専門知識を提供しています。CROはメーカーと密接に提携することで、製品開発ライフサイクル全体を厳しく監視しながら、斬新なアイデアを市場投入可能な製品に変換するサポートを行っています。これに加えて、リスクモニタリングツール、高度なデータ分析、リアルワールドエビデンスソリューション、クラウドコンピューティングなどの先進技術やツールの統合により、医療機器の状況は急速に変化しています。現在進行中の研究開発と医療機器市場に関連する成長機会の増加により、医療機器CRO市場は今後10年間で健全な成長を遂げることが予想されます。
当レポートでは、世界の医療機器CRO市場について調査し、市場の概要とともに、対象治療領域別、事業規模別、機器クラス別、提供する臨床サービスのタイプ別、提供する前臨床サービスのタイプ別、地域別の動向、および市場に参入する企業のプロファイルなどを提供しています。
目次
第1章 序文
第2章 エグゼクティブサマリー
第3章 イントロダクション
第4章 市場情勢
第5章 医療機器の規制と償還の情勢
第6章 企業プロファイル
- 章の概要
- Avania(Formerly known as Factory CRO)
- Charles River Laboratories
- CROMSOURCE
- CSSi LifeSciences
- Eurofins Medical Device Testing
- IQVIA
- Medpace
- NAMSA
- Qserve Group
- WuXi AppTec
第7章 医療機器開発業者とCROの関係:主要な促進要因とパフォーマンス指標
第8章 競合ベンチマーキング
第9章 主要業界のブランドポジショニング
- 章の概要
- 範囲と調査手法
- ブランドポジショニングマトリックス:Labcorp
- ブランドポジショニングマトリックス:IQVIA
- ブランドポジショニングマトリックス:Syneos Health
- ブランドポジショニングマトリックス:PPD
- ブランドポジショニングマトリックス:ICON
- ブランドポジショニングマトリックス:Charles River Laboratories
- ブランドポジショニングマトリックス:WuXi AppTec
- ブランドポジショニングマトリックス:Medpace
- ブランドポジショニングマトリックス:NAMSA
第10章 臨床試験の分析
第11章 合併と買収
第12章 医療機器契約調査機関の総所有コスト
第13章 調査の洞察
第14章 市場規模の評価と機会分析
第15章 SWOT分析
第16章 将来の動向と機会
第17章 結論
第18章 インタビュー記録
第19章 付録1:表形式のデータ
第20章 付録2:企業・団体一覧
List of Tables
- Table 3.1 Comparison of Key Factors Considered by Medical Device Developers While Selecting a CRO Partner: Harvey Ball Analysis
- Table 4.1 Medical Device CROs: List of Clinical Service Providers
- Table 4.2 Medical Device Clinical CROs: Information on Device Class
- Table 4.3 Medical Device Clinical CROs: Information on Type of Clinical Operation Service Offered
- Table 4.4 Medical Device Clinical CROs: Information on Type of Regulatory Affairs- Related Service Offered
- Table 4.5 Medical Device Clinical CROs: Information on Additional Service Offered
- Table 4.6 Medical Device Clinical CROs: Information on Medical Device Regulatory Compliance Authorities
- Table 4.7 Medical Device CROs: List of Preclinical Service Providers
- Table 4.8 Medical Device Preclinical CROs: Information on Type of Preclinical Services Offered
- Table 4.9 Medical Device CROs: List of Standalone Service Providers
- Table 5.1 General Guidelines for Market Authorization and Reimbursement for Medical Devices
- Table 5.2 Device Classification: US
- Table 5.3 Device Classification: Canada
- Table 5.4 Data Requirements and Characteristics of Province-wide HTA Processes in Canada
- Table 5.5 Device Classification: Mexico
- Table 5.6 Device Classification: Europe
- Table 5.7 List of CE Directives in Europe
- Table 5.8 Conformity Assessment Modules in Europe
- Table 5.9 Device Classification: Australia
- Table 5.10 Reimbursement and Pricing Approval Process of Medical devices in Australia
- Table 5.11 Device Classification: Brazil
- Table 5.12 Device Classification: China
- Table 5.13 Device Classification: India
- Table 5.14 Device Classification: Japan
- Table 5.15 Medical Devices Reimbursement Categories
- Table 5.16 Device Classification: New Zealand
- Table 5.17 Device Classification: Singapore
- Table 5.18 Device Classification: South Korea
- Table 5.19 Device Classification: South Africa
- Table 5.20 Device Classification: Thailand
- Table 5.21 Medical Devices Regulatory Landscape Summary
- Table 5.22 Medical Devices Reimbursement Landscape Summary
- Table 6.1 Avania: Company Overview
- Table 6.2 Avania: Recent Developments and Future Outlook
- Table 6.3 Charles River Laboratories: Company Overview
- Table 6.4 Charles River Laboratories: Recent Developments and Future Outlook
- Table 6.5 CROMSOURCE: Company Overview
- Table 6.6 CROMSOURCE: Recent Development and Future Outlook
- Table 6.7 CSSi LifeSciences: Company Overview
- Table 6.8 Eurofins Medical Device Testing: Company Overview
- Table 6.9 Eurofins Medical Device Testing: Recent Development and Future Outlook
- Table 6.10 IQVIA: Company Overview
- Table 6.11 IQVIA: Recent Development and Future Outlook
- Table 6.12 Medpace: Company Overview
- Table 6.13 Medpace: Recent Development and Future Outlook
- Table 6.14 NAMSA: Company Overview
- Table 6.15 NAMSA: Recent Development and Future Outlook
- Table 6.16 Qserve Group: Company Overview
- Table 6.17 Qserve Group: Recent Development and Future Outlook
- Table 6.18 WuXi AppTec: Company Overview
- Table 6.19 WuXi AppTec: Recent Development and Future Outlook
- Table 8.1 Competitive Benchmarking Analysis: Peer Groups Definitions and Inclusions
- Table 11.1 Medical Device CRO Market: List of Mergers and Acquisitions, since 2015
- Table 11.2 Acquisitions: Key Value Drivers
- Table 12.1 Total Cost of Ownership: Sample Dataset
- Table 13.1 Survey Insights: Overview of Respondents
- Table 13.2 Survey Insights: Designation and Seniority Level of Respondents
- Table 13.3 Survey Insights: Information on Type of Service Offered
- Table 13.4 Survey Insights: Information on Target Therapeutic Area
- Table 13.5 Survey Insights: Information on Average Number of Projects
- Table 13.6 Survey Insights: Information on Market Opportunity
- Table 14.1 Key Assumptions
- Table 18.1 Medical Device Clinical CROs: Distribution by Year of Establishment
- Table 18.2 Medical Device Clinical CROs: Distribution by Company Size
- Table 18.3 Medical Device Clinical CROs: Distribution by Location of Headquarters
- Table 18.4 Medical Device Clinical CROs: Distribution by Company Size and Location of Headquarters
- Table 18.5 Medical Device Clinical CROs: Distribution by Area of Specialization
- Table 18.6 Medical Device Clinical CROs: Distribution by Device Class
- Table 18.7 Medical Device Clinical CROs: Distribution by Type of Clinical Operation Services Offered
- Table 18.8 Medical Device Clinical CROs: Distribution by Distribution by Year of Establishment, Type of Clinical Services Offered, and Geography
- Table 18.9 Medical Device Clinical CROs: Distribution by Type of Regulatory Affairs Related Services Offered
- Table 18.10 Medical Device Clinical CROs: Distribution by Type of Additional Services Offered
- Table 18.11 Medical Device Clinical CROs: Distribution by Type of Medical Device Regulatory Compliance Authorities
- Table 18.12 Medical Device Preclinical CROs: Distribution by Year of Establishment
- Table 18.13 Medical Device Preclinical CROs: Distribution by Company Size
- Table 18.14 Medical Device Preclinical CROs: Distribution by Location of Headquarters
- Table 18.15 Medical Device Preclinical CROs: Distribution by Company Size and Location of Headquarters
- Table 18.16 Medical Device Preclinical CROs: Distribution by Type of Preclinical Services Offered
- Table 18.17 Medical Device Preclinical CROs: Distribution by Year of Establishment, Type of Preclinical Services Offered, and Geography
- Table 18.18 Medical Device Standalone CROs: Distribution by Year of Establishment
- Table 18.19 Medical Device Standalone CROs: Distribution by Company Size
- Table 18.20 Medical Device Standalone CROs: Distribution by Location of Headquarters
- Table 18.21 Medical Device Standalone CROs: Distribution by Company Size and Location of Headquarters
- Table 18.22 Competitive Benchmarking: Distribution by Region and Company Size
- Table 18.23 Competitive Benchmarking: Small Players based in North America (Peer Group I)
- Table 18.24 Competitive Benchmarking: Mid-sized Players based in North America (Peer Group II)
- Table 18.25 Competitive Benchmarking: Large Players based in North America (Peer Group III)
- Table 18.26 Competitive Benchmarking: Small Players based in Europe (Peer Group IV)
- Table 18.27 Competitive Benchmarking: Mid-sized Players based in Europe (Peer Group V)
- Table 18.28 Competitive Benchmarking: Large Players based in Europe (Peer Group VI)
- Table 18.29 Competitive Benchmarking: Small Players based in Asia-Pacific (Peer Group VII)
- Table 18.30 Competitive Benchmarking: Mid-sized Players based in Asia-Pacific (Peer Group VIII)
- Table 18.31 Competitive Benchmarking: Large Players based in Asia-Pacific (Peer Group IX)
- Table 18.32 Competitive Benchmarking: Small Players based in Rest of the World (Peer Group X)
- Table 18.33 Competitive Benchmarking: Mid-sized Players based in Rest of the World (Peer Group XI)
- Table 18.34 Brand Positioning of Key Industry Players: Unfair Advantage
- Table 18.35 Brand Positioning of Key Industry Players: Reasons to Believe
- Table 18.36 Brand Positioning Matrix: Labcorp
- Table 18.37 Brand Positioning Matrix: IQVIA
- Table 18.38 Brand Positioning Matrix: Syneos Health
- Table 18.39 Brand Positioning Matrix: PPD
- Table 18.40 Brand Positioning Matrix: ICON
- Table 18.41 Brand Positioning Matrix: Charles River Laboratories
- Table 18.42 Brand Positioning Matrix: WuXi AppTec
- Table 18.43 Brand Positioning Matrix: Medpace
- Table 18.44 Clinical Trial Analysis: Distribution by Trial Registration Year, since 2015
- Table 18.45 Clinical Trial Analysis: Distribution by Trial Status
- Table 18.46 Clinical Trial Analysis: Distribution by Phase of Development
- Table 18.47 Clinical Trial Analysis: Distribution by Study Design
- Table 18.48 Clinical Trial Analysis: Distribution by Therapeutic Area
- Table 18.49 Clinical Trial Analysis: Distribution by Geography
- Table 18.50 Clinical Trial Analysis: Distribution by Trial Registration Year and Geography
- Table 18.51 Clinical Trial Analysis: Distribution by Trial Status and Geography
- Table 18.52 Clinical Trial Analysis: Distribution by Type of Sponsor
- Table 18.53 Most Active Players: Distribution by Number of clinical Trials
- Table 18.54 Clinical Trial Analysis: Distribution of Enrolled Patient Population by Trial Registration Year
- Table 18.55 Clinical Trial Analysis: Distribution of Enrolled Patient Population by Phase of Development
- Table 18.56 Clinical Trial Analysis: Distribution of Enrolled Patient Population by Geography
- Table 18.57 Clinical Trial Analysis: Distribution of Enrolled Patient Population Trial Status and Geography
- Table 18.58 Mergers and Acquisitions: Cumulative Year-Wise Trend (since 2015)
- Table 18.59 Mergers and Acquisitions: Distribution by Type of Agreement
- Table 18.60 Mergers and Acquisitions: Distribution by Year and Type of Agreement
- Table 18.61 Mergers and Acquisitions: Continent-wise Distribution
- Table 18.62 Mergers and Acquisitions: Intercontinental and Intracontinental Acquisitions
- Table 18.63 Mergers and Acquisitions: Country-wise Distribution
- Table 18.64 Mergers and Acquisitions: Ownership Change Matrix
- Table 18.65 Mergers and Acquisitions: Distribution by Type of Company
- Table 18.66 Mergers and Acquisitions: Distribution by Key Value Drivers
- Table 18.67 Mergers and Acquisitions: Distribution by Key Value Drivers and Year of Acquisition
- Table 18.68 Total Cost of Ownership for Large Medical Device Contract Research Organizations, Y0-Y20 (USD Million)
- Table 18.69 Total Cost of Ownership for Large Medical Device Contract Research Organizations, Y0: Distribution of CAPEX (USD Million)
- Table 18.70 Total Cost of Ownership for Large Medical Device Contract Research Organizations, Y1-Y20: Distribution by OPEX (USD Million)
- Table 18.71 Survey Insights: Distribution of Respondents by Designation and Seniority Level
- Table 18.72 Survey Insights: Distribution of Respondents by Type of Service Offered
- Table 18.73 Survey Insights: Distribution of Respondents by Therapeutic Area
- Table 18.74 Survey Insights: Distribution of Respondents by Average Number of Projects
- Table 18.75 Survey Insights: Distribution of Respondents by Market Opportunity
- Table 18.76 Overall Medical Device CROs Market, till 2035: Conservative, Base and Optimistic Scenario (USD Billion)
- Table 18.77 Medical Device CRO Market: Distribution by Therapeutic Area, till 2035 (USD Billion)
- Table 18.78 Medical Device CROs Market: Distribution by Scale of Operation, till 2035 (USD Billion)
- Table 18.79 Medical Device CROs Market: Distribution by Device Class, till 2035 (USD Billion)
- Table 18.80 Medical Device CROs Market: Distribution by Type of Clinical Service Offered, till 2035 (USD Billion)
- Table 18.84 Medical Device CROs Market: Distribution by Type of Preclinical Service Offered, till 2035 (USD Billion)
- Table 18.85 Medical Device CROs Market: Distribution by Geography, 2022, 2028 and 2035 (USD Billion)
- Table 18.86 Medical Device CROs Market in North America, till 2035: Conservative, Base and Optimistic Scenario (USD Billion)
- Table 18.87 Medical Device CRO Market in North America, till 2035: Distribution by Therapeutic Area, Conservative, Base and Optimistic Scenarios (USD Billion)
- Table 18.88 Medical Device CRO Market in North America, till 2035: Distribution by Device Class, Conservative, Base and Optimistic Scenarios (USD Billion)
- Table 18.89 Medical Device CRO Market in North America, till 2035: Distribution by Type of Clinical Service Offered, Conservative, Base and Optimistic Scenarios (USD Billion)
- Table 18.90 Medical Device CRO Market in North America, till 2035: Distribution by Type of Preclinical Service Offered, Conservative, Base and Optimistic Scenarios (USD Billion)
- Table 18.91 Medical Device CROs Market in Europe, till 2035: Conservative, Base and Optimistic Scenario (USD Billion)
- Table 18.92 Medical Device CRO Market in Europe, till 2035: Distribution by Therapeutic Area, Conservative, Base and Optimistic Scenarios (USD Billion)
- Table 18.93 Medical Device CRO Market in Europe, till 2035: Distribution by Device Class, Conservative, Base and Optimistic Scenarios (USD Billion)
- Table 18.94 Medical Device CRO Market in Europe, till 2035: Distribution by Type of Clinical Service Offered, Conservative, Base and Optimistic Scenarios (USD Billion)
- Table 18.95 Medical Device CRO Market in Europe, till 2035: Distribution by Type of Preclinical Service Offered, Conservative, Base and Optimistic Scenarios (USD Billion)
- Table 18.96 Medical Device CROs Market in Asia-Pacific, till 2035: Conservative, Base and Optimistic Scenario (USD Billion)
- Table 18.97 Medical Device CRO Market in Asia-Pacific, till 2035: Distribution by Therapeutic Area, Conservative, Base and Optimistic Scenarios (USD Billion)
- Table 18.98 Medical Device CRO Market in Asia-Pacific, till 2035: Distribution by Device Class, Conservative, Base and Optimistic Scenarios (USD Billion)
- Table 18.99 Medical Device CRO Market in Asia-Pacific, till 2035: Distribution by Type of Clinical Service Offered, Conservative, Base and Optimistic Scenarios (USD Billion)
- Table 18.99 Medical Device CRO Market in Asia-Pacific, till 2035: Distribution by Type of Preclinical Service Offered, Conservative, Base and Optimistic Scenarios (USD Billion)
- Table 18.100 Medical Device CROs Market in North America, till 2035: Conservative, Base and Optimistic Scenario (USD Billion)
- Table 18.101 Medical Device CRO Market in Rest of the World, till 2035: Distribution by Therapeutic Area, Conservative, Base and Optimistic Scenarios (USD Billion)
- Table 18.102 Medical Device CRO Market in Rest of the World, till 2035: Distribution by Device Class, Conservative, Base and Optimistic Scenarios (USD Billion)
- Table 18.103 Medical Device CRO Market in Rest of the World, till 2035: Distribution by Type of Clinical Service Offered, Conservative, Base and Optimistic Scenarios (USD Billion)
- Table 18.104 Medical Device CRO Market in Rest of the World, till 2035: Distribution by Type of Preclinical Service Offered, Conservative, Base and Optimistic Scenarios (USD Billion)
List of Figures
- Figure 2.1 Executive Summary: Overall Market Landscape
- Figure 2.2 Executive Summary: Clinical Trial Analysis
- Figure 2.3 Executive Summary: Mergers and Acquisitions
- Figure 2.4 Executive Summary: Total Cost of Ownership
- Figure 2.5 Executive Summary: Market Sizing and Opportunity Analysis (1/2)
- Figure 2.6 Executive Summary: Market Sizing and Opportunity Analysis (2/2)
- Figure 3.1 Historical Timeline of Medical Device Inventions
- Figure 3.2 Medical Device: Development Process and Timeline
- Figure 3.3 Types of CROs Engaged in the Medical Device Market
- Figure 3.4 Services Offered by CROs
- Figure 3.5 Risks / Challenges Associated with Outsourcing Operations to CROs
- Figure 4.1 Medical Device Clinical CROs: Distribution by Year of Establishment
- Figure 4.2 Medical Device Clinical CROs: Distribution by Company Size
- Figure 4.3 Medical Device Clinical CROs: Distribution by Location of Headquarters
- Figure 4.4 Medical Device Clinical CROs: Distribution by Company Size and Location of Headquarters
- Figure 4.5 Medical Device Clinical CROs: Distribution by Area of Specialization
- Figure 4.6 Medical Device Clinical CROs: Distribution by Device Class
- Figure 4.7 Medical Device Clinical CROs: Distribution by Type of Clinical Operation Service Offered
- Figure 4.8 Medical Device Clinical CROs: Distribution by Year of Establishment, Type of Clinical Service Offered and Geography
- Figure 4.9 Medical Device Clinical CROs: Distribution by Type of Regulatory Affairs-related Service Offered
- Figure 4.10 Medical Device Clinical CROs: Distribution by Type of Additional Service Offered
- Figure 4.11 Medical Device Clinical CROs: Distribution by Type of Medical Device Regulatory Compliance Authority
- Figure 4.12 Medical Device Preclinical CROs: Distribution by Year of Establishment
- Figure 4.13 Medical Device Preclinical CROs: Distribution by Company Size
- Figure 4.14 Medical Device Preclinical CROs: Distribution by Location of Headquarters
- Figure 4.15 Medical Device Preclinical CROs: Distribution by Company Size and Location of Headquarters
- Figure 4.16 Medical Device Preclinical CROs: Distribution by Type of Preclinical Service Offered
- Figure 4.17 Medical Device Preclinical CROs: Distribution by Year of Establishment, Type of Preclinical Service Offered and Geography
- Figure 4.18 Medical Device Standalone CROs: Distribution by Year of Establishment
- Figure 4.19 Medical Device Standalone CROs: Distribution by Company Size
- Figure 4.20 Medical Device Standalone CROs: Distribution by Location of Headquarters
- Figure 4.21 Medical Device Standalone CROs: Distribution by Company Size and Location of Headquarters
- Figure 5.1 Key Regulatory Authorities for Medical Devices
- Figure 5.2 Medical Devices Review / Approval Process in the US
- Figure 5.3 Healthcare Insurance Coverage in the US: Distribution by Type of Coverage
- Figure 5.4 Medical Devices National Coverage Determination Process in the US
- Figure 5.5 Medical Devices Review / Approval Process in Canada
- Figure 5.6 Healthcare Insurance Coverage in Canada: Distribution by Type of Coverage
- Figure 5.7 Medical Devices Review / Approval Process in Mexico
- Figure 5.8 Regulatory Bodies in EU5 Countries
- Figure 5.9 Steps involved in CE Marking Process
- Figure 5.10 Medical Devices Review / Approval Process in Europe
- Figure 5.11 Medical Devices Review / Approval Process in the UK
- Figure 5.12 Healthcare Insurance Coverage in the UK: Distribution by Type of Coverage
- Figure 5.13 Reimbursement Process for Medical Devices in the UK
- Figure 5.14 Healthcare Insurance Coverage in France: Distribution by Type of Coverage
- Figure 5.15 Reimbursement Process for Medical Devices through List of Products and Services Qualifying for Reimbursement
- Figure 5.16 Healthcare Insurance Coverage in Germany: Distribution by Type of Coverage
- Figure 5.17 Reimbursement Process for In-Patient Setting in Germany
- Figure 5.18 Reimbursement Process for Out-Patient Care in Germany
- Figure 5.19 Healthcare Insurance Coverage in Italy: Distribution by Type of Coverage
- Figure 5.20 Reimbursement Process for Medical Devices in Italy
- Figure 5.21 Healthcare Insurance Coverage in Spain: Distribution by Type of Coverage
- Figure 5.22 Reimbursement Process for Medical Devices in Spain
- Figure 5.23 Medical Devices Review / Approval Process in Australia
- Figure 5.24 Healthcare Insurance Coverage in Australia: Distribution by Type of Coverage
- Figure 5.25 Medical Devices Review / Approval Process in Brazil
- Figure 5.26 Reimbursement Process for Medical Devices in Brazil
- Figure 5.27 Medical Devices Review / Approval Process in China
- Figure 5.28 Healthcare Insurance Coverage in China: Distribution by Type of Coverage
- Figure 5.29 Reimbursement Approval Process for Medical Devices in Shanghai
- Figure 5.30 Medical Devices Review / Approval Process in India
- Figure 5.31 Healthcare Insurance Coverage in Israel: Distribution by Type of Coverage
- Figure 5.32 Medical Devices Review / Approval Process in Japan
- Figure 5.33 Snapshot of the Regulatory and Reimbursement Process in Japan
- Figure 5.34 Healthcare Insurance Coverage in Japan: Distribution by Type of Coverage
- Figure 5.35 Reimbursement Process for New Medical Devices in Japan
- Figure 5.36 Medical Devices Review / Approval Process in New Zealand
- Figure 5.37 Healthcare Insurance Coverage in New Zealand: Distribution by Type of Coverage
- Figure 5.38 Medical Devices Review / Approval Process in Singapore
- Figure 5.39 Medical Devices Review / Approval Process in South Korea
- Figure 5.40 Healthcare Insurance Coverage in South Korea: Distribution by Type of Coverage
- Figure 5.41 Medical Devices Review / Approval Process in South Africa
- Figure 5.42 Medical Devices Review / Approval Process in Taiwan
- Figure 5.43 Healthcare Insurance Coverage in Taiwan: Distribution by Type of Coverage
- Figure 5.44 Medical Devices Review / Approval Process in Thailand
- Figure 5.45 Heat Map Analysis: Comparison of Regional Regulatory Control for Medical Devices
- Figure 5.46 Regulatory Control for Medical Devices: Regional Distribution by Device Risk Category
- Figure 6.1 Avania: Service Portfolio
- Figure 6.2 Charles River Laboratories: Service Portfolio
- Figure 6.3 CROMSOURCE: Service Portfolio
- Figure 6.4 CSSi LifeSciences: Service Portfolio
- Figure 6.5 Eurofins Medical Device Testing: Preclinical Service Portfolio
- Figure 6.6 Eurofins Medical Device Testing: Clinical Service Portfolio
- Figure 6.7 IQVIA: Service Portfolio
- Figure 6.8 Medpace: Service Portfolio
- Figure 6.9 NAMSA: Service Portfolio
- Figure 6.10 Qserve Group: Service Portfolio
- Figure 6.11 WuXi AppTec: Preclinical Service Portfolio
- Figure 6.12 WuXi AppTec: Clinical Service Portfolio
- Figure 7.1 Key Attributes for Selection of Key Performance Indicators (KPIs)
- Figure 7.2 Types of KPIs
- Figure 7.3 Financial Indicators: Comparative Analysis of KPIs considered by Big Pharma Companies
- Figure 7.4 Financial Indicators: Sponsors' (Big Pharma) Perspective
- Figure 7.5 Financial Indicators: Contract Service Providers' Perspective
- Figure 7.6 Process / Capability Indicators: Comparative Analysis of KPIs considered by Big Pharma Companies
- Figure 7.7 Process / Capability Indicators: Sponsors' (Big Pharma) Perspective
- Figure 7.8 Process / Capability Indicators: Contract Service Providers' Perspective
- Figure 7.9 Market Reputation Indicators: Comparative Analysis of KPIs considered by Big Pharma Companies
- Figure 7.10 Market Reputation Indicators: Sponsors' (Big Pharma) Perspective
- Figure 7.11 Market Reputation Indicators: Contract Service Providers' Perspective
- Figure 7.12 Comparison of Key Factors to be considered while selecting KPIs for Medical Devices
- Figure 8.1 Competitive Benchmarking: Distribution by Region and Company Size
- Figure 8.2 Competitive Benchmarking: Small Players based in North America (Peer Group I)
- Figure 8.3 Competitive Benchmarking: Mid-sized Players based in North America (Peer Group II)
- Figure 8.4 Competitive Benchmarking: Large Players based in North America (Peer Group III)
- Figure 8.5 Competitive Benchmarking: Small Players based in Europe (Peer Group IV)
- Figure 8.6 Competitive Benchmarking: Mid-sized Players based in Europe (Peer Group V)
- Figure 8.7 Competitive Benchmarking: Large Players based in Europe (Peer Group VI)
- Figure 8.8 Competitive Benchmarking: Small Players based in Asia-Pacific (Peer Group VII)
- Figure 8.9 Competitive Benchmarking: Mid-sized Players based in Asia-Pacific (Peer Group VIII)
- Figure 8.10 Competitive Benchmarking: Large Players based in Asia-Pacific (Peer Group IX)
- Figure 8.11 Competitive Benchmarking: Small Players based in Rest of the World (Peer Group X)
- Figure 8.12 Competitive Benchmarking: Mid-sized Players based in Rest of the World (Peer Group XI)
- Figure 8.13 Competitive Benchmarking Summary
- Figure 9.1 Brand Positioning of Key Industry Players: Unfair Advantage
- Figure 9.2 Brand Positioning of Key Industry Players: Reasons to Believe
- Figure 9.3 Brand Positioning Matrix: Labcorp
- Figure 9.4 Brand Positioning Matrix: IQVIA
- Figure 9.5 Brand Positioning Matrix: Syneos Health
- Figure 9.6 Brand Positioning Matrix: PPD
- Figure 9.7 Brand Positioning Matrix: ICON
- Figure 9.8 Brand Positioning Matrix: Charles River Laboratories
- Figure 9.9 Brand Positioning Matrix: WuXi AppTec
- Figure 9.10 Brand Positioning Matrix: Medpace
- Figure 10.1 Clinical Trial Analysis: Distribution by Trial Registration Year, 2015-2022
- Figure 10.2 Clinical Trial Analysis: Distribution by Trial Status
- Figure 10.3 Clinical Trial Analysis: Distribution by Phase of Development
- Figure 10.4 Clinical Trial Analysis: Distribution by Study Design
- Figure 10.5 Clinical Trial Analysis: Distribution by Therapeutic Area
- Figure 10.6 Clinical Trial Analysis: Distribution by Geography
- Figure 10.7 Clinical Trial Analysis: Distribution by Trial Registration Year and Geography
- Figure 10.8 Clinical Trial Analysis: Distribution by Trial Status and Geography
- Figure 10.9 Clinical Trial Analysis: Distribution by Type of Sponsor
- Figure 10.10 Most Active Players: Distribution by Number of Clinical Trials
- Figure 10.11 Clinical Trial Analysis: Distribution of Enrolled Patient Population by Trial Registration Year
- Figure 10.12 Clinical Trial Analysis: Distribution of Enrolled Patient Population by Phase of Development
- Figure 10.13 Clinical Trial Analysis: Distribution of Enrolled Patient Population by Geography
- Figure 10.14 Clinical Trial Analysis: Distribution of Enrolled Patient Population by Trial Status and Geography
- Figure 11.1 Mergers and Acquisitions: Cumulative Year-Wise Trend (since 2015)
- Figure 11.2 Mergers and Acquisitions: Distribution by Type of Agreement
- Figure 11.3 Mergers and Acquisitions: Distribution by Year and Type of Agreement
- Figure 11.4 Mergers and Acquisitions: Continent-wise Distribution
- Figure 11.5 Mergers and Acquisitions: Intercontinental and Intracontinental Acquisitions
- Figure 11.6 Mergers and Acquisitions: Country-wise Distribution
- Figure 11.7 Mergers and Acquisitions: Ownership Change Matrix
- Figure 11.8 Mergers and Acquisitions: Distribution by Type of Company
- Figure 11.9 Mergers and Acquisitions: Distribution by Key Value Drivers
- Figure 11.10 Mergers and Acquisitions: Distribution by Year of Acquisition and Key Value Drivers
- Figure 12.1 Total Cost of Ownership: Capital Expenditures (CAPEX)
- Figure 12.2 Total Cost of Ownership: Operational Expenditures (OPEX)
- Figure 12.3 Total Cost of Ownership for Large Medical Device Contract Research Organizations, Y0-Y20 (USD Million)
- Figure 12.4 Total Cost of Ownership for Large Medical Device Contract Research Organizations, Y0: Distribution of CAPEX (USD Million)
- Figure 12.5 Total Cost of Ownership for Large Medical Device Contract Research Organizations, Y1-Y20: Distribution by OPEX (USD Million)
- Figure 13.1 Survey Insights: Distribution of Respondents by Designation and Seniority Level
- Figure 13.2 Survey Insights: Distribution of Respondents by Type of Service Offered
- Figure 13.3 Survey Insights: Distribution of Respondents by Therapeutic Area
- Figure 13.4 Survey Insights: Distribution of Respondents by Average Number of Annual Projects
- Figure 13.5 Survey Insights: Distribution of Respondents by Market Opportunity
- Figure 14.1 Overall Medical Device CROs Market, till 2035 (USD Billion)
- Figure 14.2 Medical Device CROs Market, 2022, 2028 and 2035: Distribution by Therapeutic Area (USD Billion)
- Figure 14.3 Medical Device CROs Market, till 2035: Distribution by Scale of Operation (USD Billion)
- Figure 14.4 Medical Device CROs Market, till 2035: Distribution by Device Class (USD Billion)
- Figure 14.5 Medical Device CROs Market, till 2035: Distribution by Type of Clinical Service Offered (USD Billion)
- Figure 14.6 Medical Device CROs Market, till 2035: Distribution by Type of Preclinical Service Offered (USD Billion)
- Figure 14.7 Medical Device CROs Market, 2022, 2028 and 2035: Distribution by Geography (USD Billion)
- Figure 14.8 Medical Device CROs Market in North America, till 2035 (USD Billion)
- Figure 14.9 Medical Device CROs Market for CNS Disorders in North America, till 2035 (USD Billion)
- Figure 14.10 Medical Device CROs Market for Cardiovascular Disorders in North America, till 2035 (USD Billion)
- Figure 14.11 Medical Device CROs Market for Oncological Disorders in North America, till 2035 (USD Billion)
- Figure 14.12 Medical Device CROs Market for Bone Disorders in North America, till 2035 (USD Billion)
- Figure 14.13 Medical Device CROs Market for Respiratory Disorders in North America, till 2035 (USD Billion)
- Figure 14.14 Medical Device CROs Market for Pain Disorders in North America, till 2035 (USD Billion)
- Figure 14.15 Medical Device CROs Market for Ophthalmic Disorders in North America, till 2035 (USD Billion)
- Figure 14.16 Medical Device CROs Market for Psychological Disorders in North America, till 2035 (USD Billion)
- Figure 14.17 Medical Device CROs Market for Metabolic Disorders in North America, till 2035 (USD Billion)
- Figure 14.18 Medical Device CROs Market for Other Disorders in North America, till 2035 (USD Billion)
- Figure 14.19 Medical Device CROs Market for Class I Devices in North America, till 2035 (USD Billion)
- Figure 14.20 Medical Device CROs Market for Class II Devices in North America, till 2035 (USD Billion)
- Figure 14.21 Medical Device CROs Market for Class III Devices in North America, till 2035 (USD Billion)
- Figure 14.22 Medical Device CROs Market for Clinical Trial Management Services in North America, till 2035 (USD Billion)
- Figure 14.23 Medical Device CROs Market for Consulting Services in North America, till 2035 (USD Billion)
- Figure 14.24 Medical Device CROs Market for Data Management Services in North America, till 2035 (USD Billion)
- Figure 14.25 Medical Device CROs Market for Regulatory Affairs Management Services in North America, till 2035 (USD Billion)
- Figure 14.26 Medical Device CROs Market for Other Clinical Services in North America, till 2035 (USD Billion)
- Figure 14.27 Medical Device CROs Market for Material Characterization and Analytical Services in North America, till 2035 (USD Billion)
- Figure 14.28 Medical Device CROs Market for Biocompatibility Testing Services in North America, till 2035 (USD Billion)
- Figure 14.29 Medical Device CROs Market for Sterility and Microbiology Testing Services in North America, till 2035 (USD Billion)
- Figure 14.30 Medical Device CROs Market for Other Preclinical Services in North America, till 2035 (USD Billion)
- Figure 14.31 Medical Device CROs Market in Europe, till 2035 (USD Billion)
- Figure 14.32 Medical Device CROs Market for CNS Disorders in Europe, till 2035 (USD Billion)
- Figure 14.33 Medical Device CROs Market for Cardiovascular Disorders in Europe, till 2035 (USD Billion)
- Figure 14.34 Medical Device CROs Market for Oncological Disorders in Europe, till 2035 (USD Billion)
- Figure 14.35 Medical Device CROs Market for Bone Disorders in Europe, till 2035 (USD Billion)
- Figure 14.36 Medical Device CROs Market for Respiratory Disorders in Europe, till 2035 (USD Billion)
- Figure 14.37 Medical Device CROs Market for Pain Disorders in Europe, till 2035 (USD Billion)
- Figure 14.38 Medical Device CROs Market for Ophthalmic Disorders in Europe, till 2035 (USD Billion)
- Figure 14.39 Medical Device CROs Market for Psychological Disorders in Europe, till 2035 (USD Billion)
- Figure 14.40 Medical Device CROs Market for Metabolic Disorders in Europe, till 2035 (USD Billion)
- Figure 14.41 Medical Device CROs Market for Other Disorders in Europe, till 2035 (USD Billion)
- Figure 14.42 Medical Device CROs Market for Class I Devices in Europe, till 2035 (USD Billion)
- Figure 14.43 Medical Device CROs Market for Class II Devices in Europe, till 2035 (USD Billion)
- Figure 14.44 Medical Device CROs Market for Class III Devices in Europe, till 2035 (USD Billion)
- Figure 14.45 Medical Device CROs Market for Clinical Trial Management Services in Europe, till 2035 (USD Billion)
- Figure 14.46 Medical Device CROs Market for Consulting Services in Europe, till 2035 (USD Billion)
- Figure 14.47 Medical Device CROs Market for Data Management Services in Europe, till 2035 (USD Billion)
- Figure 14.48 Medical Device CROs Market for Regulatory Affairs Management Services in Europe, till 2035 (USD Billion)
- Figure 14.49 Medical Device CROs Market for Other Clinical Services in Europe, till 2035 (USD Billion)
- Figure 14.50 Medical Device CROs Market for Material Characterization and Analytical Services in Europe, till 2035 (USD Billion)
- Figure 14.51 Medical Device CROs Market for Biocompatibility Testing Services in Europe, till 2035 (USD Billion)
- Figure 14.52 Medical Device CROs Market for Sterility and Microbiology Testing Services in Europe, till 2035 (USD Billion)
- Figure 14.53 Medical Device CROs Market for Other Preclinical Services in Europe, till 2035 (USD Billion)
- Figure 14.54 Medical Device CROs Market in Asia-Pacific, till 2035 (USD Billion)
- Figure 14.55 Medical Device CROs Market for CNS Disorders in Asia-Pacific, till 2035 (USD Billion)
- Figure 14.56 Medical Device CROs Market for Cardiovascular Disorders in Asia-Pacific, till 2035 (USD Billion)
- Figure 14.57 Medical Device CROs Market for Oncological Disorders in Asia-Pacific, till 2035 (USD Billion)
- Figure 14.58 Medical Device CROs Market for Bone Disorders in Asia-Pacific, till 2035 (USD Billion)
- Figure 14.59 Medical Device CROs Market for Respiratory Disorders in Asia-Pacific, till 2035 (USD Billion)
- Figure 14.60 Medical Device CROs Market for Pain Disorders in Asia-Pacific, till 2035 (USD Billion)
- Figure 14.61 Medical Device CROs Market for Ophthalmic Disorders in Asia-Pacific, till 2035 (USD Billion)
- Figure 14.62 Medical Device CROs Market for Psychological Disorders in Asia-Pacific, till 2035 (USD Billion)
- Figure 14.63 Medical Device CROs Market for Metabolic Disorders in Asia-Pacific, till 2035 (USD Billion)
- Figure 14.64 Medical Device CROs Market for Other Disorders in Asia-Pacific, till 2035 (USD Billion)
- Figure 14.65 Medical Device CROs Market for Class I Devices in Asia-Pacific, till 2035 (USD Billion)
- Figure 14.66 Medical Device CROs Market for Class II Devices in Asia-Pacific, till 2035 (USD Billion)
- Figure 14.67 Medical Device CROs Market for Class III Devices in Asia-Pacific, till 2035 (USD Billion)
- Figure 14.68 Medical Device CROs Market for Clinical Trial Management Services in Asia-Pacific, till 2035 (USD Billion)
- Figure 14.69 Medical Device CROs Market for Consulting Services in Asia-Pacific, till 2035 (USD Billion)
- Figure 14.70 Medical Device CROs Market for Data Management Services in Asia-Pacific, till 2035 (USD Billion)
- Figure 14.71 Medical Device CROs Market for Regulatory Affairs Management Services in Asia-Pacific, till 2035 (USD Billion)
- Figure 14.72 Medical Device CROs Market for Other Clinical Services in Asia-Pacific, till 2035 (USD Billion)
- Figure 14.73 Medical Device CROs Market for Material Characterization and Analytical Services in Asia-Pacific, till 2035 (USD Billion)
- Figure 14.74 Medical Device CROs Market for Biocompatibility Testing Services in Asia-Pacific, till 2035 (USD Billion)
- Figure 14.75 Medical Device CROs Market for Sterility and Microbiology Testing Services in Asia-Pacific, till 2035 (USD Billion)
- Figure 14.76 Medical Device CROs Market for Other Preclinical Services in Asia-Pacific, till 2035 (USD Billion)
- Figure 14.77 Medical Device CROs Market in Rest of the World, till 2035 (USD Billion)
- Figure 14.78 Medical Device CRO Market for CNS Disorders in Rest of the World, till 2035 (USD Billion)
- Figure 14.79 Medical Device CROs Market for Cardiovascular Disorders in Rest of the World, till 2035 (USD Billion)
- Figure 14.80 Medical Device CROs Market for Oncological Disorders in Rest of the World, till 2035 (USD Billion)
- Figure 14.81 Medical Device CROs Market for Bone Disorders in Rest of the World, till 2035 (USD Billion)
- Figure 14.82 Medical Device CROs Market for Respiratory Disorders in Rest of the World, till 2035 (USD Billion)
- Figure 14.83 Medical Device CROs Market for Pain Disorders in Rest of the World, till 2035 (USD Billion)
- Figure 14.84 Medical Device CROs Market for Ophthalmic Disorders in Rest of the World, till 2035 (USD Billion)
- Figure 14.85 Medical Device CROs Market for Psychological Disorders in Rest of the World, till 2035 (USD Billion)
- Figure 14.86 Medical Device CROs Market for Metabolic Disorders in Rest of the World, till 2035 (USD Billion)
- Figure 14.87 Medical Device CROs Market for Other Disorders in Rest of the World, till 2035 (USD Billion)
- Figure 14.88 Medical Device CROs Market for Class I Devices in Rest of the World, till 2035 (USD Billion)
- Figure 14.89 Medical Device CROs Market for Class II Devices in Rest of the World, till 2035 (USD Billion)
- Figure 14.90 Medical Device CROs Market for Class III Devices in Rest of the World, till 2035 (USD Billion)
- Figure 14.91 Medical Device CROs Market for Clinical Trial Management Services in Rest of the World, till 2035 (USD Billion)
- Figure 14.92 Medical Device CROs Market for Consulting Services in Rest of the World, till 2035 (USD Billion)
- Figure 14.93 Medical Device CROs Market for Data Management Services in Rest of the World, till 2035 (USD Billion)
- Figure 14.94 Medical Device CROs Market for Regulatory Affairs Management Services in Rest of the World, till 2035 (USD Billion)
- Figure 14.95 Medical Device CROs Market for Other Clinical Services in Rest of the World, till 2035 (USD Billion)
- Figure 14.96 Medical Device CROs Market for Material Characterization and Analytical Services in Rest of the World, till 2035 (USD Billion)
- Figure 14.97 Medical Device CROs Market for Biocompatibility Testing Services in Rest of the World, till 2035 (USD Billion)
- Figure 14.98 Medical Device CROs Market for Sterility and Microbiology Testing Services in Rest of the World, till 2035 (USD Billion)
- Figure 14.99 Medical Device CROs Market for Other Preclinical Services in Rest of the World, till 2035 (USD Billion)
- Figure 15.1 Medical Device CROs Market: SWOT Analysis
- Figure 15.2 Comparison of SWOT Factors: Harvey Ball Analysis
- Figure 16.1 Future Trends and Opportunities for Medical Device CROs
- Figure 17.1 Concluding Remarks: Overall Market Landscape
- Figure 17.2 Concluding Remarks: Competitive Benchmarking
- Figure 17.3 Concluding Remarks: Brand Positioning Analysis
- Figure 17.4 Concluding Remarks: Clinical Trial Analysis
- Figure 17.5 Concluding Remarks: Merger and Acquisitions
- Figure 17.6 Concluding Remarks: Market Sizing and Opportunity Analysis (I/II)
- Figure 17.7 Concluding Remarks: Market Sizing and Opportunity Analysis (II/II)
MEDICAL DEVICE CRO MARKET: OVERVIEW
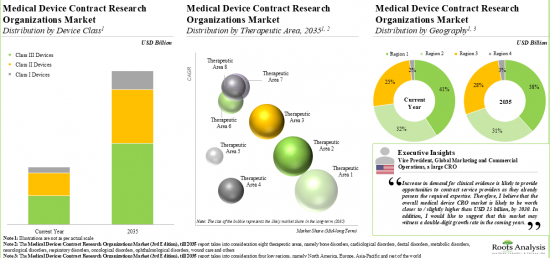
As per Roots Analysis, the global medical device CRO market is estimated to grow from USD 13.3 billion in the current year to USD 19.3 billion by 2035, at a CAGR of 3.4% during the forecast period, till 2035.
The market sizing and opportunity analysis has been segmented across the following parameters:
Scale of Operation
- Clinical
- Preclinical
Device Class
- Class 1
- Class 2
- Class 3
Type of Clinical Services Offered
- Clinical Trial Management
- Data Management
- Regulatory Affair Management
- Consulting
Type of Preclinical Services Offered
- Biocompatibility Testing
- Sterility
- Microbiology Testing
- Material Characterization
- Analytical Services
Target Therapeutic Area
- Cardiovascular Disorders
- CNS Disorders
- Metabolic Disorders
- Oncological Disorders
- Ophthalmological Disorders
- Orthopedic Disorders
- Pain Disorders
- Psychological Disorders
- Respiratory Disorders
- Others
Key Geographical Regions
- North America
- Europe
- Asia-Pacific
- Rest of the World
MEDICAL DEVICE CRO MARKET: GROWTH AND TRENDS
The increase in geriatric population and disease incidences, primarily chronic diseases, has led to a surge in the demand for novel medical devices across multiple therapeutic areas. Since 2020, the USFDA has approved ~105 medical devices. Further, it is interesting to note that over 35 medical devices receive FDA approval annually. However, one of the primary challenges faced by this industry is the time-consuming and complex product development lifecycle of a new medical device. Specifically, the clinical stage is exceedingly resource intensive, pertaining to higher costs and greater risks. In addition, the stringent regulatory guidelines to ensure the safety of medical devices make it more difficult for industrial leaders.
In order to address the abovementioned bottleneck, medical device developers are actively outsourcing their research operations to specialized medical device CRO. These organizations offer expertise in conducting clinical trials, navigating regulatory requirements, and ensuring compliance with safety standards. By partnering closely with manufacturers, CROs support translating novel ideas into market-ready products while rigorously monitoring throughout the product development lifecycle. In addition to this, the landscape of medical devices is rapidly changing, driven by the integration of advanced technologies and tools, including risk monitoring tools, advanced data analytics, real world evidence solutions and cloud computing. Owing to the ongoing research and development, and increasing opportunities linked to the medical devices market, it is anticipated that the medical devices CRO market will witness healthy growth in the coming decade.
MEDICAL DEVICE CRO MARKET: KEY INSIGHTS
The report delves into the current state of the medical device CRO market and identifies potential growth opportunities within the industry. Some key findings from the report include:
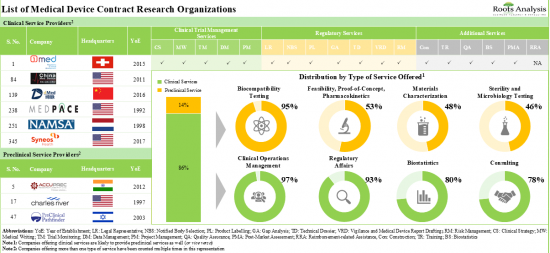
1. More than 590 CROs currently claim to have the required capabilities to offer a wide range of research and analytical services for medical devices, across different scale of operations.
2. The market is well fragmented, featuring a mix of players based across different geographical regions that provide services for a range of medical device classes.
3. In pursuit of building a competitive edge, medical devices CROs are actively upgrading / expanding their capabilities to enhance their respective portfolios of offerings.
4. Over the years, industry players have undertaken a variety of initiatives to further advance the development / enable the improvement of their proprietary services for medical devices.
5. The rising interest in this domain is reflected in the number of mergers and acquisitions that have been reported in the last few years; 53% of such initiatives were focused on geographical consolidation.
6. Over 14,000 trials, enrolling close to 4.6 million patients suffering from a myriad of disease indications, have been registered across the globe to evaluate the efficacy and accuracy of medical devices.
7. Our proprietary total cost of ownership model suggests an informed estimate of direct and indirect expenses while setting up a contract research facility in different regions over a span of 20 years.
8. Driven by the ongoing efforts of industry stakeholders, the medical devices contract research service providers the market is expected to witness steady growth in the coming decade.
MEDICAL DEVICE CRO MARKET: KEY SEGMENTS
Currently, Clinical Operations Segment Occupies the Largest Share of the Medical Device CRO Market
Based on the scale of operation, the market is segmented into clinical and preclinical services. At present, the clinical services segment holds the maximum share of the medical device CRO market. It is worth highlighting that the increasing number of medical device-focused clinical trials is likely to drive the market in the near future.
Class II Devices Segment is the Fastest Growing Segment of the Medical Device CRO Market During the Forecast Period
Based on the device class, the market is segmented into Class I, Class II, Class III. Currently, class II devices hold maximum share within the medical devices CRO market. This trend is unlikely to change in the short-mid-term.
Currently, Clinical Trial Management Segment Occupies the Largest Share of the Medical Device CRO Market
Based on the type of clinical services, the market is segmented into clinical trial management, data management, regulatory affairs management, and consulting. At present, clinical trial management holds the maximum share of the medical devices CRO market. This trend is likely to remain the same in the forthcoming years.
Biocompatibility Testing Services Segment is the Fastest Growing Segment of the Medical Device CRO Market During the Forecast Period
Based on the type of preclinical services, the market is segmented into biocompatibility testing, sterility, microbiology testing, material characterization, and analytical services. It is worth highlighting that, at present, sterility and microbial testing holds a larger share of the medical device CRO market. This trend is likely to remain the same in the coming decade.
Currently, CNS Disorders Segment Occupies the Largest Share of the Medical Device CRO Market
Based on the therapeutic area, the market is segmented into cardiovascular disorders, CNS disorders, metabolic disorders, oncological disorders, ophthalmological disorders, orthopedic disorders, pain disorders, psychological disorders, respiratory disorders and other disorders. It is worth highlighting that majority of the current medical device CRO market is captured by CNS disorders.
North America Accounts for the Largest Share of the Market
Based on the key geographical regions, the market is segmented into North America, Europe, Asia-Pacific and the Rest of the world. Majority share is expected to be captured by CROs based in North America. It is worth highlighting that, over the years, the market of the rest of the world is expected to grow at a higher CAGR.
Example Players in the Medical Device CRO Market
- Avania
- Charles River Laboratories
- CROMSOURCE
- CSSi LifeSciences
- Eurofins Medical Testing
- IQVIA
- Medpace
- NAMSA
- Qserve Group
- WuXi AppTec
Primary Research Overview
The opinions and insights presented in this study were influenced by discussions conducted with multiple stakeholders. The research report features detailed transcripts of interviews held with the following industry stakeholders:
- Chief Executive Officer and Co-founder, HungaroTrial
- Senior Vice President of Business Development and Marketing, ClinChoice
- Vice President of Global Marketing and Commercial Operations, NAMSA
- Head of Business Development, CTC North
- General Manager, CW Research & Management
- Chief Operating Officer, CROMSOURCE
- Senior manager, Medical & Clinical Operations, Metrics Research
- Technical Director and Partner, Vyomus Consulting
- Director of Business Development, A+ Science
- Business Development Manager, AtoZ-CRO
MEDICAL DEVICE CRO MARKET: RESEARCH COVERAGE
- Market Sizing and Opportunity Analysis: The report features an in-depth analysis of the medical device CRO market, focusing on key market segments, including [A] scale of operation, [B] device class, [C] type of clinical services offered, [D] type of preclinical services offered, [E] therapeutic area and [F] geographical regions.
- Market Landscape: A comprehensive evaluation of contract research organizations involved in the medical device CRO market, considering various parameters, such as [A] year of establishment, [B] company size (in terms of the number of employees), [C] location of headquarters, [D] area of specialization, [E] device class, [F] types of CRO services offered by [F1] clinical service providers, [F2] preclinical service providers and [F3] stand-alone service providers.
- Regulatory and Reimbursement Landscape Analysis: A discussion on general regulatory guidelines established and issued by major regulatory bodies for medical device approval. In addition, it includes an insightful multi-dimensional heat map analysis, featuring a comparison of the contemporary regulatory and reimbursement scenarios in key geographies across the globe.
- Company Profiles: In-depth profiles of key industry players offering CRO services for both clinical and preclinical stage development of medical devices, focusing on [A] company overviews, [B] medical device-focused service portfolio, [C] recent developments and [D] an informed future outlook.
- Competitive Benchmarking Analysis: A competitive benchmarking analysis that emphasizes the primary focus areas of small, mid-sized, and large companies. This analysis compares their existing capabilities within and beyond their respective peer groups based in North America, Europe, Asia-Pacific, and other regions. It offers stakeholders insights into potential strategies for achieving a competitive edge in the industry.
- Key Performance Indicators: An analysis highlighting the key performance indicators used by sponsor companies to evaluate service providers engaged in the medical device CRO market, based on information gathered via secondary research (for top-ten medical device players) and primary research.
- Brand Positioning Analysis: A comprehensive analysis of brand positioning for top industry players, highlighting the prevailing perceptions of their proprietary brands.
- Clinical Trials Analysis: Examination of completed, ongoing, and planned clinical studies of various medical devices, based on parameters like [A] trial registration year, [B] trial phase, [C] current trial status, [D] enrolled patient population, [E] study design, [F] leading industry players (in terms of number of trials conducted), [G] target therapeutic area(s) and [H] key geographical regions.
- Merger and Acquisitions: A comprehensive examination of the various mergers and acquisitions, focusing on multiple relevant parameters, including [A] year of agreement, [B] type of agreement and [C] geographical location of the companies.
- Total Cost of Ownership: An in-depth analysis of the total cost of ownership for a medical device contract research service provider, which includes a well-informed estimate of both direct and indirect costs.
- Survey Analysis: A survey analysis featuring inputs solicited from various experts who are directly / indirectly involved in providing CRO services to medical device developers.
- SWOT Analysis: A SWOT analysis, focusing on key drivers and challenges that are likely to impact the industry's evolution. Further, it includes a Harvey ball analysis, highlighting the relative effect of each SWOT parameter on the overall industry.
KEY QUESTIONS ANSWERED IN THIS REPORT
- How many companies are currently engaged in this market?
- Which are the leading companies in this market?
- What factors are likely to influence the evolution of this market?
- What is the current and future market size?
- What is the CAGR of this market?
- How is the current and future market opportunity likely to be distributed across key market segments?
REASONS TO BUY THIS REPORT
- The report provides a comprehensive market analysis, offering detailed revenue projections of the overall market and its specific sub-segments. This information is valuable to both established market leaders and emerging entrants.
- Stakeholders can leverage the report to gain a deeper understanding of the competitive dynamics within the market. By analyzing the competitive landscape, businesses can make informed decisions to optimize their market positioning and develop effective go-to-market strategies.
- The report offers stakeholders a comprehensive overview of the market, including key drivers, barriers, opportunities, and challenges. This information empowers stakeholders to stay abreast of market trends and make data-driven decisions to capitalize on growth prospects.
ADDITIONAL BENEFITS
- Complimentary PPT Insights Packs
- Complimentary Excel Data Packs for all Analytical Modules in the Report
- 10% Free Content Customization
- Detailed Report Walkthrough Session with Research Team
- Free Updated report if the report is 6-12 months old or older
TABLE OF CONTENTS
1. PREFACE
- 1.1. Scope of the Report
- 1.2. Market Segmentation
- 1.3. Research Methodology
- 1.4. Key Questions Answered
- 1.5. Chapter Outlines
2. EXECUTIVE SUMMARY
3. INTRODUCTION
- 3.1. Chapter Overview
- 3.2. Overview of Medical Devices
- 3.2.1. Historical Evolution of Medical Devices
- 3.2.2. Classification of Medical Devices
- 3.3. Overview of Contract Research Organizations (CROs)
- 3.3.1. Evolution of CROs
- 3.4. Role of CROs in the Medical Device Industry
- 3.5. Types of Medical Device CROs
- 3.6. Types of Services Offered by CROs
- 3.7. Advantages of Outsourcing Operations to CROs
- 3.8. Risks and Challenges Associated with Outsourcing
- 3.9. Key Considerations WhileSelecting a Suitable CRO Partner
4. MARKET LANDSCAPE
- 4.1. Chapter Overview
- 4.2. Medical Device CROs: Clinical Service Providers
- 4.2.1. Analysis by Year of Establishment
- 4.2.2. Analysis by Company Size
- 4.2.3. Analysis by Location of Headquarters
- 4.2.4. Analysis by Company Size and Location of Headquarters
- 4.2.5. Analysis by Area of Specialization
- 4.2.6. Analysis by Device Class
- 4.2.7. Analysis by Type of Clinical Operation Service Offered
- 4.2.8. Analysis by Type of Regulatory Affairs-related Service Offered
- 4.2.9. Analysis by Type of Additional Service Offered
- 4.2.10. Analysis by Medical Device Regulatory Compliance Authority
- 4.3. Medical Device CROs: Preclinical Service Providers
- 4.3.1. Analysis by Year of Establishment
- 4.3.2. Analysis by Company Size
- 4.3.3. Analysis by Location of Headquarters
- 4.3.4. Analysis by Company Size and Location of Headquarters
- 4.3.5. Analysis by Type of Preclinical Service Offered
- 4.4. Medical Device CROs: Standalone Service Providers
- 4.4.1. Analysis by Year of Establishment
- 4.4.2. Analysis by Company Size
- 4.4.3. Analysis by Location of Headquarters
- 4.4.4. Analysis by Company Size and Location of Headquarters
5. REGULATORY AND REIMBURSEMENT LANDSCAPE FOR MEDICAL DEVICES
- 5.1. Chapter Overview
- 5.2. General Regulatory and Reimbursement Guidelines for Medical Devices
- 5.3. Regulatory and Reimbursement Landscape in North America
- 5.3.1. The US Scenario
- 5.3.1.1. Regulatory Authority
- 5.3.1.2. Review / Approval Process
- 5.3.1.3. Reimbursement Landscape
- 5.3.1.3.1. Payer Mix
- 5.3.1.3.2. Reimbursement Process
- 5.3.2. The Canadian Scenario
- 5.3.2.1. Regulatory Authority
- 5.3.2.2. Review / Approval Process
- 5.3.2.3. Reimbursement Landscape
- 5.3.2.3.1. Payer Mix
- 5.3.2.3.2. Reimbursement Process
- 5.3.3. The Mexican Scenario
- 5.3.3.1. Regulatory Authority
- 5.3.3.2. Review / Approval Process
- 5.3.3.3. Reimbursement Landscape
- 5.3.3.3.1. Payer Mix
- 5.3.1. The US Scenario
- 5.4. Regulatory and Reimbursement Landscape in Europe
- 5.4.1. Overall Scenario
- 5.4.1.1. Overview of Regulatory Authorities
- 5.4.1.2. Overall Review / Approval Process
- 5.4.2. The UK Scenario
- 5.4.2.1. Regulatory Authority
- 5.4.2.2. Review / Approval Process
- 5.4.2.3. Reimbursement Landscape
- 5.4.2.3.1. Payer Mix
- 5.4.2.3.2. Reimbursement Process
- 5.4.3. The French Scenario
- 5.4.3.1. Regulatory Authority
- 5.4.3.2. Review / Approval Process
- 5.4.3.3. Reimbursement Landscape
- 5.4.3.3.1. Payer Mix
- 5.4.3.3.2. Reimbursement Process
- 5.4.4. The German Scenario
- 5.4.4.1. Regulatory Authority
- 5.4.4.2. Review / Approval Process
- 5.4.4.3. Reimbursement Landscape
- 5.4.4.3.1. Payer Mix
- 5.4.4.3.2. Reimbursement Process
- 5.4.5. The Italian Scenario
- 5.4.5.1. Regulatory Authority
- 5.4.5.2. Review / Approval Process
- 5.4.5.3. Reimbursement Landscape
- 5.4.5.3.1. Payer Mix
- 5.4.5.3.2. Reimbursement Process
- 5.4.6. The Spanish Scenario
- 5.4.6.1. Regulatory Authority
- 5.4.6.2. Review / Approval Process
- 5.4.6.3. Reimbursement Landscape
- 5.4.6.3.1. Payer Mix
- 5.4.6.3.2. Reimbursement Process
- 5.4.1. Overall Scenario
- 5.5. Regulatory and Reimbursement Landscape in Asia-Pacific and Rest of the World
- 5.5.1. The Australian Scenario
- 5.5.1.1. Regulatory Authority
- 5.5.1.2. Review / Approval Process
- 5.5.1.3. Reimbursement Landscape
- 5.5.1.3.1. Payer Mix
- 5.5.1.3.2. Reimbursement Process
- 5.5.2. The Brazilian Scenario
- 5.5.2.1. Regulatory Authority
- 5.5.2.2. Review / Approval Process
- 5.5.2.3. Reimbursement Landscape
- 5.5.2.3.1. Payer Mix
- 5.5.2.3.2. Reimbursement Process
- 5.5.3. The Chinese Scenario
- 5.5.3.1. Regulatory Authority
- 5.5.3.2. Review / Approval Process
- 5.5.3.3. Reimbursement Landscape
- 5.5.3.3.1. Payer Mix
- 5.5.3.3.2. Reimbursement Process
- 5.5.4. The Indian Scenario
- 5.5.4.1. Regulatory Authority
- 5.5.4.2. Review / Approval Process
- 5.5.4.3. Reimbursement Landscape
- 5.5.4.3.1. Payer Mix
- 5.5.5. The Israeli Scenario
- 5.5.5.1. Regulatory Authority
- 5.5.5.2. Review / Approval Process
- 5.5.5.3. Reimbursement Landscape
- 5.5.5.3.1. Payer Mix
- 5.5.6. The Japanese Scenario
- 5.5.6.1. Regulatory Authority
- 5.5.6.2. Review / Approval Process
- 5.5.6.3. Reimbursement Landscape
- 5.5.6.3.1. Payer Mix
- 5.5.6.3.2. Reimbursement Process
- 5.5.7. The New Zealand Scenario
- 5.5.7.1. Regulatory Authority
- 5.5.7.2. Review / Approval Process
- 5.5.7.3. Reimbursement Landscape
- 5.5.7.3.1. Payer Mix
- 5.5.7.3.2. Reimbursement Process
- 5.5.8. The Singapore Scenario
- 5.5.8.1. Regulatory Authority
- 5.5.8.2. Review / Approval Process
- 5.5.8.3. Reimbursement Landscape
- 5.5.8.3.1. Payer Mix
- 5.5.8.3.2. Reimbursement Process
- 5.5.9. The South Korean Scenario
- 5.5.9.1. Regulatory Authority
- 5.5.9.2. Review / Approval Process
- 5.5.9.3. Reimbursement Landscape
- 5.5.9.3.1. Payer Mix
- 5.5.9.3.2. Reimbursement Process
- 5.5.10. The South African Scenario
- 5.5.10.1. Regulatory Authority
- 5.5.10.2. Review / Approval Process
- 5.5.10.3. Reimbursement Landscape
- 5.5.11. The Taiwan Scenario
- 5.5.11.1. Regulatory Authority
- 5.5.11.2. Review / Approval Process
- 5.5.11.3. Reimbursement Landscape
- 5.5.11.3.1. Payer Mix
- 5.5.11.3.2. Reimbursement Process
- 5.5.12. The Thailand Scenario
- 5.5.12.1. Regulatory Authority
- 5.5.12.2. Review / Approval Process
- 5.5.12.3. Reimbursement Landscape
- 5.5.1. The Australian Scenario
- 5.6. Comparison of Regional Regulatory Control
- 5.7. Concluding Remarks
6. COMPANY PROFILES
- 6.1. Chapter Overview
- 6.2. Avania (Formerly known as Factory CRO)
- 6.2.1. Company Overview
- 6.2.2. Service Portfolio
- 6.2.3. Recent Developments and Future Outlook
- 6.3. Charles River Laboratories
- 6.3.1. Company Overview
- 6.3.2. Service Portfolio
- 6.3.3. Recent Developments and Future Outlook
- 6.4. CROMSOURCE
- 6.4.1. Company Overview
- 6.4.2. Service Portfolio
- 6.4.3. Recent Developments and Future Outlook
- 6.5. CSSi LifeSciences
- 6.5.1. Company Overview
- 6.5.2. Service Portfolio
- 6.5.3. Recent Developments and Future Outlook
- 6.6. Eurofins Medical Device Testing
- 6.6.1. Company Overview
- 6.6.2. Service Portfolio
- 6.6.3. Recent Developments and Future Outlook
- 6.7. IQVIA
- 6.7.1. Company Overview
- 6.7.2. Service Portfolio
- 6.7.3. Recent Developments and Future Outlook
- 6.8. Medpace
- 6.8.1. Company Overview
- 6.8.2. Service Portfolio
- 6.8.3. Recent Developments and Future Outlook
- 6.9. NAMSA
- 6.9.1. Company Overview
- 6.9.2. Service Portfolio
- 6.9.3. Recent Developments and Future Outlook
- 6.10. Qserve Group
- 6.10.1. Company Overview
- 6.10.2. Service Portfolio
- 6.10.3. Recent Developments and Future Outlook
- 6.11. WuXi AppTec
- 6.11.1. Company Overview
- 6.11.2. Service Portfolio
- 6.11.3. Recent Developments and Future Outlook
7. MEDICAL DEVICE DEVELOPER AND CRO RELATIONSHIPS: KEY VALUE DRIVERS AND PERFORMANCE INDICATORS
- 7.1. Chapter Overview
- 7.2. Definition and Importance of Key Performance Indicators (KPIs)
- 7.3. Key Considerations for Selection of KPIs
- 7.4. Types of KPIs
- 7.4.1. Financial Indicators
- 7.4.1.1. Most Important KPIs
- 7.4.1.1.1. Financial Stability
- 7.4.1.1.2. Cost of Services Offered
- 7.4.1.1.3. Comparative Analysis of Financial Indicators
- 7.4.1.2. Industry Perspective
- 7.4.1.2.1. Sponsors' (Big Pharma) Perspective
- 7.4.1.2.2. Contract Service Providers' Perspective
- 7.4.1.1. Most Important KPIs
- 7.4.2. Process and Capability Indicators
- 7.4.2.1. Most Important KPIs
- 7.4.2.1.1. Proximity to Sponsor
- 7.4.2.1.2. Capability to Innovate / Mitigate Risk
- 7.4.2.1.3. Strength of Service Portfolio
- 7.4.2.1.4. Comparative Analysis of Process / Capability Indicators
- 7.4.2.2. Industry Perspective
- 7.4.2.2.1. Sponsors' (Big Pharma) Perspective
- 7.4.2.2.2. Contract Service Providers' Perspective
- 7.4.2.1. Most Important KPIs
- 7.4.3. Market Reputation Indicators
- 7.4.3.1. Most Important KPIs
- 7.4.3.1.1. Flexibility / Adaptability
- 7.4.3.1.2. Time Management
- 7.4.3.1.3. Quality / Reliability
- 7.4.3.1.4. Regulatory Compliance / Track Record
- 7.4.3.1.5. Comparative Analysis of Market Reputation Indicators
- 7.4.3.2. Industry Perspective
- 7.4.3.2.1. Sponsors' (Big Pharma) Perspective
- 7.4.3.2.2. Contract Service Providers' Perspective
- 7.4.3.1. Most Important KPIs
- 7.4.1. Financial Indicators
- 7.5. Comparison of Key Performance Indicators
- 7.6. Concluding Remarks
8. COMPETITIVE BENCHMARKING
- 8.1. Chapter Overview
- 8.2. Assumptions and Methodology
- 8.3. Competitive Benchmarking by Region
- 8.3.1. Competitive Benchmarking: Small Players based in North America (Peer Group I)
- 8.3.2. Competitive Benchmarking: Mid-sized Players based in North America (Peer Group II)
- 8.3.3. Competitive Benchmarking: Large Players based in North America (Peer Group III)
- 8.3.4. Competitive Benchmarking: Small Players based in Europe (Peer Group IV)
- 8.3.5. Competitive Benchmarking: Mid-sized Players based in Europe (Peer Group V)
- 8.3.6. Competitive Benchmarking: Large Players based in Europe (Peer Group VI)
- 8.3.7. Competitive Benchmarking: Small Players based in Asia-Pacific (Peer Group VII)
- 8.3.8. Competitive Benchmarking: Mid-sized Players based in Asia-Pacific (Peer Group VIII)
- 8.3.9. Competitive Benchmarking: Large Players based in Asia-Pacific (Peer Group IX)
- 8.3.10. Competitive Benchmarking: Small Players based in RoW (Peer Group X)
- 8.3.11. Competitive Benchmarking: Mid-sized Players based in RoW (Peer Group XI)
- 8.4. Concluding Remarks
9. BRAND POSITIONING OF KEY INDUSTRY PLAYERS
- 9.1. Chapter Overview
- 9.2. Scope and Methodology
- 9.3. Brand Positioning Matrix: Labcorp
- 9.4. Brand Positioning Matrix: IQVIA
- 9.5. Brand Positioning Matrix: Syneos Health
- 9.6. Brand Positioning Matrix: PPD
- 9.7. Brand Positioning Matrix: ICON
- 9.8. Brand Positioning Matrix: Charles River Laboratories
- 9.9. Brand Positioning Matrix: WuXi AppTec
- 9.10. Brand Positioning Matrix: Medpace
- 9.11. Brand Positioning Matrix: NAMSA
10. CLINICAL TRIAL ANALYSIS
- 10.1. Chapter Overview
- 10.2. Scope and Methodology
- 10.3. Medical Devices: Clinical Trial Analysis
- 10.3.1. Analysis by Trial Registration Year
- 10.3.2. Analysis by Trial Status
- 10.3.3. Analysis by Phase of Development
- 10.3.4. Analysis by Study Design
- 10.3.5. Analysis by Therapeutic Area
- 10.3.6. Analysis by Geography
- 10.3.7. Analysis by Trial Registration Year and Geography
- 10.3.8. Analysis by Trial Status and Geography
- 10.3.9. Analysis by Type of Sponsor
- 10.3.10. Most Active Players: Analysis by Number of Clinical Trials
- 10.4. Medical Devices: Analysis by Enrolled Patient Population
- 10.4.1. Analysis by Trial Registration Year
- 10.4.2. Analysis by Phase of Development
- 10.4.3. Analysis by Geography
- 10.4.4. Analysis by Trial Status and Geography
11. MERGERS AND ACQUISITIONS
- 11.1. Chapter Overview
- 11.2. Merger and Acquisition Models
- 11.3. Medical Device CROs: Mergers and Acquisitions
- 11.3.1. Analysis by Year of Merger / Acquisition
- 11.3.2. Analysis by Type of Agreement
- 11.3.3. Regional Analysis
- 11.3.3.1. Analysis by Continent
- 11.3.3.2. Intercontinental and Intracontinental Deals
- 11.3.3.3. Analysis by Country
- 11.3.4. Ownership Change Matrix
- 11.3.5. Analysis by Type of Company
- 11.3.6. Analysis by Key Value Drivers
- 11.3.6.1. Analysis by Year of Acquisition and Key Value Drivers
12. TOTAL COST OF OWNERSHIP FOR MEDICAL DEVICES CONTRACT RESEARCH ORGANIZATION
- 12.1. Chapter Overview
- 12.2. Key Parameters
- 12.3. Assumptions and Methodology
- 12.4. Sample Dataset for the estimation of Total Cost of Ownership
- 12.4.1. Total Cost of Ownership for Large Medical Device Contract Research Organizations, Y0-Y20
- 12.4.2. Total Cost of Ownership for Large Medical Device Contract Research Organizations: Analysis by CAPEX, Y0
- 12.4.3. Total Cost of Ownership for Large Medical Device Contract Research Organizations: Analysis by OPEX, Y1-Y20
13. SURVEY INSIGHTS
- 13.1. Chapter Overview
- 13.2. Designation of Respondents
- 13.3. Types of Services Offered
- 13.4. Target Therapeutic Area
- 13.5. Average Number of Annual Projects
- 13.6. Market Opportunity
14. MARKET SIZING AND OPPORTUNITY ANALYSIS
- 14.1. Chapter Overview
- 14.2. Assumptions and Forecast Methodology
- 14.3. Overall Medical Device CROs Market, till 2035
- 14.3.1. Medical Device CROs Market: Analysis by Therapeutic Area, 2022, 2028 and 2035
- 14.3.2. Medical Device CROs Market: Analysis by Scale of Operation, till 2035
- 14.3.3. Medical Device CROs Market: Analysis by Device Class, till 2035
- 14.3.4. Medical Device CROs Market, till 2035: Analysis by Type of Clinical Service Offered, till 2035
- 14.3.5. Medical Device CROs Market, till 2035: Analysis by Type of Preclinical Service Offered, till 2035
- 14.3.6. Medical Device CROs Market: Analysis by Geography, 2022, 2028 and 2035
- 14.4. Medical Device CROs Market in North America, till 2035
- 14.4.1. Medical Device CROs Market in North America: Analysis by Therapeutic Area, till 2035
- 14.4.1.1. Medical Device CROs Market for CNS Disorders in North America, till 2035
- 14.4.1.2. Medical Device CROs Market for Cardiovascular Disorders in North America, till 2035
- 14.4.1.3. Medical Device CROs Market for Oncological Disorders in North America, till 2035
- 14.4.1.4. Medical Device CROs Market for Bone Disorders in North America, till 2035
- 14.4.1.5. Medical Device CROs Market for Respiratory Disorders in North America, till 2035
- 14.4.1.6. Medical Device CROs Market for Pain Management Disorders in North America, till 2035
- 14.4.1.7. Medical Device CROs Market for Ophthalmic Disorders in North America, till 2035
- 14.4.1.8. Medical Device CROs Market for Psychological Disorders in North America, till 2035
- 14.4.1.9. Medical Device CROs Market for Metabolic Disorders in North America, till 2035
- 14.4.1.10. Medical Device CROs Market for Other Disorders in North America, till 2035
- 14.4.2. Medical Device CROs Market in North America: Analysis by Device Class, till 2035
- 14.4.2.1. Medical Device CROs Market for Class I Devices in North America, till 2035
- 14.4.2.2. Medical Device CROs Market for Class II Devices in North America, till 2035
- 14.4.2.3. Medical Device CROs Market for Class III Devices in North America, till 2035
- 14.4.3. Medical Device CROs Market in North America: Analysis by Type of Clinical Service Offered, till 2035
- 14.4.3.1. Medical Device CROs Market for Clinical Trial Management Services in North America, till 2035
- 14.4.3.2. Medical Device CROs Market for Consulting Services in North America, till 2035
- 14.4.3.3. Medical Device CROs Market for Data Management Services in North America, till 2035
- 14.4.3.4. Medical Device CROs Market for Regulatory Affairs Management Services in North America, till 2035
- 14.4.3.5. Medical Device CROs Market for Other Clinical Services in North America, till 2035
- 14.4.4. Medical Device CROs Market in North America: Analysis by Type of Preclinical Service Offered, till 2035
- 14.4.4.1. Medical Device CROs Market for Material Characterization and Analytical Services in North America, till 2035
- 14.4.4.2. Medical Device CROs Market for Biocompatibility Testing Services in North America, till 2035
- 14.4.4.3. Medical Device CROs Market for Sterility and Microbiology Testing Services in North America, till 2035
- 14.4.4.4. Medical Device CROs Market for Other Preclinical Services in North America, till 2035
- 14.4.1. Medical Device CROs Market in North America: Analysis by Therapeutic Area, till 2035
- 14.5. Medical Device CROs Market in Europe, till 2035
- 14.5.1. Medical Device CROs Market in Europe: Analysis by Therapeutic Area, till 2035
- 14.5.1.1. Medical Device CROs Market for CNS Disorders in Europe, till 2035
- 14.5.1.2. Medical Device CROs Market for Cardiovascular Disorders in Europe, till 2035
- 14.5.1.3. Medical Device CROs Market for Oncological Disorders in Europe, till 2035
- 14.5.1.4. Medical Device CROs Market for Bone Disorders in Europe, till 2035
- 14.5.1.5. Medical Device CROs Market for Respiratory Disorders in Europe, till 2035
- 14.5.1.6. Medical Device CROs Market for Pain Management Disorders in Europe, till 2035
- 14.5.1.7. Medical Device CROs Market for Ophthalmic Disorders in Europe, till 2035
- 14.5.1.8. Medical Device CROs Market for Psychological Disorders in Europe, till 2035
- 14.5.1.9. Medical Device CROs Market for Metabolic Disorders in Europe, till 2035
- 14.5.1.10. Medical Device CROs Market for Other Disorders in Europe, till 2035
- 14.5.2. Medical Device CROs Market in Europe: Analysis by Device Class, till 2035
- 14.5.2.1. Medical Device CROs Market for Class I Devices in Europe, till 2035
- 14.5.2.2. Medical Device CROs Market for Class II Devices in Europe, till 2035
- 14.5.2.3. Medical Device CROs Market for Class III Devices in Europe, till 2035
- 14.5.3. Medical Device CROs Market in Europe: Analysis by Type of Clinical Service Offered, till 2035
- 14.5.3.1. Medical Device CROs Market for Clinical Trial Management Services in Europe, till 2035
- 14.5.3.2. Medical Device CROs Market for Consulting Services in Europe, till 2035
- 14.5.3.3. Medical Device CROs Market for Data Management Services in Europe, till 2035
- 14.5.3.4. Medical Device CROs Market for Regulatory Affairs Management Services in Europe, till 2035
- 14.5.3.5. Medical Device CROs Market for Other Clinical Services in Europe, till 2035
- 14.5.4. Medical Device CROs Market in Europe: Analysis by Type of Preclinical Service Offered, till 2035
- 14.5.4.1. Medical Device CROs Market for Material Characterization and Analytical Services in Europe, till 2035
- 14.5.4.2. Medical Device CROs Market for Biocompatibility Testing Services in Europe, till 2035
- 14.5.4.3. Medical Device CROs Market for Sterility and Microbiology Testing Services in Europe, till 2035
- 14.5.4.4. Medical Device CROs Market for Other Preclinical Services in Europe, till 2035
- 14.5.1. Medical Device CROs Market in Europe: Analysis by Therapeutic Area, till 2035
- 14.6. Medical Device CROs Market in Asia-Pacific, till 2035
- 14.6.1. Medical Device CROs Market in Asia-Pacific: Analysis by Therapeutic Area, till 2035
- 14.6.1.1. Medical Device CROs Market for CNS Disorders in Asia-Pacific, till 2035
- 14.6.1.2. Medical Device CROs Market for Cardiovascular Disorders in Asia-Pacific, till 2035
- 14.6.1.3. Medical Device CROs Market for Oncological Disorders in Asia-Pacific, till 2035
- 14.6.1.4. Medical Device CROs Market for Bone Disorders in Asia-Pacific, till 2035
- 14.6.1.5. Medical Device CROs Market for Respiratory Disorders in Asia-Pacific, till 2035
- 14.6.1.6. Medical Device CROs Market for Pain Management Disorders in Asia-Pacific, till 2035
- 14.6.1.7. Medical Device CROs Market for Ophthalmic Disorders in Asia-Pacific, till 2035
- 14.6.1.8. Medical Device CROs Market for Psychological Disorders in Asia-Pacific, till 2035
- 14.6.1.9. Medical Device CROs Market for Metabolic Disorders in Asia-Pacific, till 2035
- 14.6.1.10. Medical Device CROs Market for Other Disorders in Asia-Pacific, till 2035
- 14.6.2. Medical Device CROs Market in Asia-Pacific: Analysis by Device Class, till 2035
- 14.6.2.1. Medical Device CROs Market for Class I Devices in Asia-Pacific, till 2035
- 14.6.2.2. Medical Device CROs Market for Class II Devices in Asia-Pacific, till 2035
- 14.6.2.3. Medical Device CROs Market for Class III Devices in Asia-Pacific, till 2035
- 14.6.3. Medical Device CROs Market in Asia-Pacific: Analysis by Type of Clinical Service Offered, till 2035
- 14.6.3.1. Medical Device CROs Market for Clinical Trial Management Services in Asia-Pacific, till 2035
- 14.6.3.2. Medical Device CROs Market for Consulting Services in Asia-Pacific, till 2035
- 14.6.3.3. Medical Device CROs Market for Data Management Services in Asia-Pacific, till 2035
- 14.6.3.4. Medical Device CROs Market for Regulatory Affairs Management Services in Asia-Pacific, till 2035
- 14.6.3.5. Medical Device CROs Market for Other Clinical Services in Asia-Pacific, till 2035
- 14.6.4. Medical Device CROs Market in Asia-Pacific: Analysis by Type of Preclinical Service Offered, till 2035
- 14.6.4.1. Medical Device CROs Market for Material Characterization and Analytical Services in Asia-Pacific, till 2035
- 14.6.4.2. Medical Device CROs Market for Biocompatibility Testing Services in Asia-Pacific, till 2035
- 14.6.4.3. Medical Device CROs Market for Sterility and Microbiology Testing Services in Asia-Pacific, till 2035
- 14.6.4.4. Medical Device CROs Market for Other Preclinical Services in Asia-Pacific, till 2035
- 14.6.1. Medical Device CROs Market in Asia-Pacific: Analysis by Therapeutic Area, till 2035
- 14.7. Medical Device CROs Market in Rest of the World, till 2035
- 14.7.1. Medical Device CROs Market in Rest of the World: Analysis by Therapeutic Area, till 2035
- 14.7.1.1. Medical Device CROs Market for CNS Disorders in Rest of the World, till 2035
- 14.7.1.2. Medical Device CROs Market for Cardiovascular Disorders in Rest of the World, till 2035
- 14.7.1.3. Medical Device CROs Market for Oncological Disorders in Rest of the World, till 2035
- 14.7.1.4. Medical Device CROs Market for Bone Disorders in Rest of the World, till 2035
- 14.7.1.5. Medical Device CROs Market for Respiratory Disorders in Rest of the World, till 2035
- 14.7.1.6. Medical Device CROs Market for Pain Management Disorders in Rest of the World, till 2035
- 14.7.1.7. Medical Device CROs Market for Ophthalmic Disorders in Rest of the World, till 2035
- 14.7.1.8. Medical Device CROs Market for Psychological Disorders in Rest of the World, till 2035
- 14.7.1.9. Medical Device CROs Market for Metabolic Disorders in Rest of the World, till 2035
- 14.7.1.10. Medical Device CROs Market for Other Disorders in Rest of the World, till 2035
- 14.7.2. Medical Device CROs Market in Rest of the World: Analysis by Device Class, till 2035
- 14.7.2.1. Medical Device CROs Market for Class I Devices in Rest of the World, till 2035
- 14.7.2.2. Medical Device CROs Market for Class II Devices in Rest of the World, till 2035
- 14.7.2.3. Medical Device CROs Market for Class III Devices in Rest of the World, till 2035
- 14.7.3. Medical Device CROs Market in Rest of the World: Analysis by Type of Clinical Service Offered, till 2035
- 14.7.3.1. Medical Device CROs Market for Clinical Trial Management Services in Rest of the World, till 2035
- 14.7.3.2. Medical Device CROs Market for Consulting Services in Rest of the World, till 2035
- 14.7.3.3. Medical Device CROs Market for Data Management Services in Rest of the World, till 2035
- 14.7.3.4. Medical Device CROs Market for Regulatory Affairs Management Services in Rest of the World, till 2035
- 14.7.3.5. Medical Device CROs Market for Other Clinical Services in Rest of the World, till 2035
- 14.7.4. Medical Device CROs Market in Rest of the World: Analysis by Type of Preclinical Service Offered, till 2035
- 14.7.4.1. Medical Device CROs Market for Material Characterization and Analytical Services in Rest of the World, till 2035
- 14.7.4.2. Medical Device CROs Market for Biocompatibility Testing Services in Rest of the World, till 2035
- 14.7.4.3. Medical Device CROs Market for Sterility and Microbiology Testing Services in Rest of the World, till 2035
- 14.7.4.4. Medical Device CROs Market for Other Preclinical Services in Rest of the World, till 2035
- 14.7.1. Medical Device CROs Market in Rest of the World: Analysis by Therapeutic Area, till 2035
15. SWOT ANALYSIS
- 15.1. Chapter Overview
- 15.2. Strengths
- 15.3. Weaknesses
- 15.4. Opportunities
- 15.5. Threats
- 15.6. Concluding Remarks
16. FUTURE TRENDS AND OPPORTUNITIES
- 16.1. Chapter Overview
- 16.2. Anticipated Growth in Number of Connected Devices
- 16.3. Adoption of Data Analytics and Real-Time Monitoring Solutions
- 16.4. Need for Cloud-based Computing and Storage Solutions
- 16.5. Growing Demand for Real World Evidence to Obtain Regulatory Approval
- 16.6. Concluding Remarks
17. CONCLUDING REMARKS
18. INTERVIEW TRANSCRIPTS
- 18.1. Chapter Overview
- 18.2. HungaroTrial
- 18.2.1. Company Snapshot
- 18.2.2. Interview Transcript: Lajos Sarosi, Chief Executive Officer and Co-founder
- 18.3. ClinChoice
- 18.3.1. Company Snapshot
- 18.3.2. Lee King, Senior Vice President of Business Development and Marketing
- 18.4. NAMSA
- 18.4.1. Company Snapshot
- 18.4.2. Christopher Rupp, Vice President of Global Marketing and Commercial Operations
- 18.5. CTC North
- 18.5.1. Company Snapshot
- 18.5.2. Claus Hemiker, Head of Business Development
- 18.6. CW Research & Management
- 18.6.1. Company Snapshot
- 18.6.2. Christian Wolflehner, General Manager
- 18.7. CROMSOURCE
- 18.7.1. Company Snapshot
- 18.7.2. Troy McCall, Chief Operating Officer
- 18.8. Metrics Research
- 18.8.1. Company Snapshot
- 18.8.2. Nazish Urooj, Senior manager, Medical & Clinical Operations
- 18.9. Vyomus Consulting
- 18.9.1. Company Snapshot
- 18.9.2. C. Omprakash, Technical Director and Partner
- 18.10. A+ Science
- 18.10.1. Company Snapshot
- 18.10.2. Tania Persson, Director of Business Development
- 18.11. AtoZ-CRO
- 18.11.1. Company Snapshot
- 18.11.2. Alexa Foltin-Mertgen, Business Development Manager

