|
|
市場調査レポート
商品コード
1754858
フィッシュオイルEPAとDHAの世界市場:2031年までの予測Global Fish Oil EPA and DHA Market Insights, Forecast to 2031 |
||||||
|
|||||||
カスタマイズ可能
適宜更新あり
|
|||||||

| フィッシュオイルEPAとDHAの世界市場:2031年までの予測 |
|
出版日: 2025年06月23日
発行: QYResearch
ページ情報: 英文 237 Pages
納期: 2~3営業日
|

全表示
- 概要
- 図表
- 目次
世界のフィッシュオイルEPAとDHAの市場規模は、予測期間(2025年~2031年)中、3.37%のCAGRで拡大し、2024年の16億2,490万米ドルから2031年には20億2,084万米ドルに成長すると予測されています。
米国・カナダのフィッシュオイルEPAとDHAの市場規模は、2024年の5億8,545万米ドルから2031年には6億8,337万米ドルに達すると予測され、2025年から2031年の予測期間中のCAGRは2.57%になるとみられています。
中国のフィッシュオイルEPAとDHAの市場規模は、2024年の3億7,356万米ドルから2031年には5億2,495万米ドルに達すると予測され、2025年から2031年の予測期間中のCAGRは5.03%になるとみられています。
欧州のフィッシュオイルEPAとDHAの市場規模は、2024年の3億5,813万米ドルから2031年には4億2,879万米ドルに達すると予測され、2025年から2031年の予測期間中のCAGRは2.80%になるとみられています。
フィッシュオイルEPAとDHAの世界の主要メーカーには、KD Pharma、Croda、BASF、Yuwang Pharma、GC Rieber VivoMega、Pelagia(EPAX)、Golden Omega、TASA、KinOmega Biopharm、Omega Protein、Huatai Phrama、AlaskOmega(Wiley Companies)、Jiangsu Auqi Marine Biotechnology、Sinomega Biotech Engineering、Xinzhou Marine Biological Products、Nu-Mega(Clover)、Skuny Bioscience、Renpu Pharmaceuticals、Polaris、Solutexなどがあります。2024年、世界の主要企業5社の売上高シェアは約45.28%でした。
生産面では、2020年から2024年まで、2031年までの予測で、フィッシュオイルEPAとDHAの生産量、成長率、メーカー別市場シェア、地域別市場シェア(地域レベル、国レベル)を調査しています。
消費面では、地域別(地域レベル、国レベル)、企業別、タイプ別、用途別のフィッシュオイルEPAとDHAの売上高に焦点を当てています。
当レポートでは、世界のフィッシュオイルEPAとDHA市場の概要、容量、生産高、収益、価格を示します。世界の市場動向を分析し、2020年~2024年の過去の市場収益・売上データ、2024年の推定・予測、2031年までのCAGRを予測しています。
当レポートでは、フィッシュオイルEPAとDHAの主要生産者を調査し、主要地域と国の消費量も提供しています。フィッシュオイルEPAとDHAの今後の市場ポテンシャルと、この市場を様々なセグメントとサブセグメントに予測するための主な地域/国の焦点のハイライト。米国、カナダ、メキシコ、ブラジル、中国、日本、韓国、東南アジア、インド、ドイツ、英国、イタリア、中東・アフリカ、その他の国々の国別データと市場価値分析をまとめています。
当レポートでは、2020年から2024年までのデータで、フィッシュオイルEPAとDHAの売上、収益、市場シェア、主要メーカーの業界ランキングに焦点を当てています。世界のフィッシュオイルEPAとDHA市場における主要利害関係者の特定、最近の動向とセグメント別の収益に基づく競争環境と市場ポジショニングの分析。当レポートは、利害関係者が競合情勢を理解し、より多くの洞察を得て、より良い方法で事業や市場戦略を位置づけるのに役立ちます。
当レポートでは、2020年から2031年までのタイプ別、用途別のセグメントデータ、売上高、収益、価格を分析しています。フィッシュオイルEPAとDHAの売上、予測成長動向、生産技術、用途、エンドユーザー産業の評価と市場規模の予測を提供します。
目次
第1章 研究対象範囲
- フィッシュオイルEPAとDHAの製品イントロダクション
- タイプ別市場
- 用途別市場
- 前提と制限
- 調査目的
- 対象年
第2章 世界のフィッシュオイルEPAとDHAの生産
- 世界のフィッシュオイルEPAとDHAの生産量:2020年対2024年対2031年(生産地ベース)、地域別
- 世界のフィッシュオイルEPAとDHAの生産量、地域別
- 北米
- 欧州
- 中国
- 南米
第3章 エグゼクティブサマリー
第4章 メーカーによる競合
第5章 タイプ別市場規模
- 世界のフィッシュオイルEPAとDHAの売上、タイプ別
- 世界のフィッシュオイルEPAとDHAの収益、タイプ別
- 世界のフィッシュオイルEPAとDHAの価格、タイプ別
第6章 用途別市場規模
- 世界のフィッシュオイルEPAとDHAの売上、用途別
- 世界のフィッシュオイルEPAとDHAの収益、用途別
- 世界のフィッシュオイルEPAとDHAの価格、用途別
第7章 米国・カナダ
第8章 欧州
第9章 中国
第10章 アジア(中国を除く)
第11章 ラテンアメリカ
第12章 中東・アフリカ
第13章 企業プロファイル
- KD Pharma
- Croda
- BASF
- Yuwang Pharma
- GC Rieber VivoMega
- Pelagia(EPAX)
- Golden Omega
- TASA
- KinOmega Biopharm
- Omega Protein
- Huatai Phrama
- AlaskOmega(Wiley Companies)
- Jiangsu Auqi Marine Biotechnology
- Sinomega Biotech Engineering
- Xinzhou Marine Biological Products
- Nu-Mega(Clover)
- Skuny Bioscience
- Renpu Pharmaceuticals
- Polaris
- Solutex
第14章 産業チェーンと販売チャネルの分析
- フィッシュオイルEPAとDHA産業チェーン分析
- フィッシュオイルEPAとDHAの主要原料
- フィッシュオイルEPAとDHAの生産方法とプロセス
- フィッシュオイルEPAとDHAの販売およびマーケティング
- フィッシュオイルEPAとDHAの顧客
第15章 フィッシュオイルEPAとDHA市場力学
- フィッシュオイルEPAとDHA業界の動向
- フィッシュオイルEPAとDHA市場の促進要因
- フィッシュオイルEPAとDHA市場の課題
- フィッシュオイルEPAとDHA市場の抑制要因
第16章 世界のフィッシュオイルEPAとDHA調査の主な結果
第17章 付録
List of Tables
- Table 1. Global Fish Oil EPA and DHA Market Size Growth Rate by Type, 2020 VS 2024 VS 2031 (US$ Million)
- Table 2. Key Manufacturers of Fish Oil DHA
- Table 3. Key Manufacturers of Fish Oil EPA
- Table 4. Global Fish Oil EPA and DHA Market Size Growth Rate by Application, 2020 VS 2024 VS 2031 (US$ Million)
- Table 5. Global Fish Oil EPA and DHA Production Growth Rate (CAGR) by Region: 2020 VS 2024 VS 2031 (kilotons)
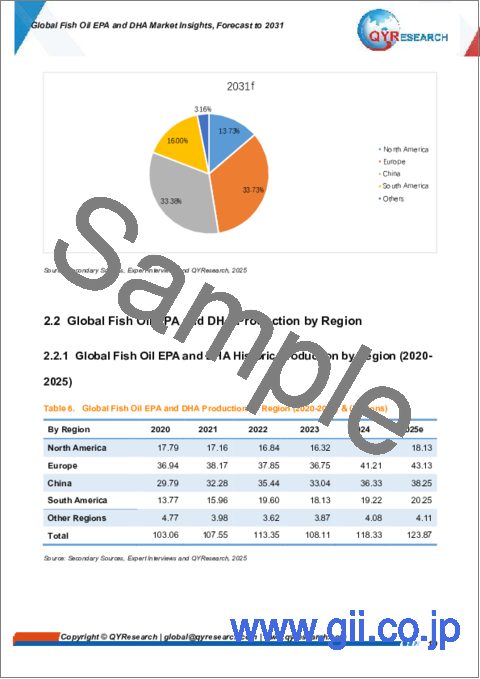
- Table 6. Global Fish Oil EPA and DHA Production by Region (2020-2025) & (kilotons)
- Table 7. Global Fish Oil EPA and DHA Production by Region (2026-2031) & (kilotons)
- Table 8. Global Fish Oil EPA and DHA Production Market Share by Region (2020-2025)
- Table 9. Global Fish Oil EPA and DHA Production Market Share by Region (2026-2031)
- Table 10. Global Fish Oil EPA and DHA Revenue Grow Rate (CAGR) by Region: 2020 VS 2024 VS 2031 (US$ Million)
- Table 11. Global Fish Oil EPA and DHA Revenue by Region (2020-2025) & (US$ Million)
- Table 12. Global Fish Oil EPA and DHA Revenue by Region (2026-2031) & (US$ Million)
- Table 13. Global Fish Oil EPA and DHA Revenue Market Share by Region (2020-2025)
- Table 14. Global Fish Oil EPA and DHA Revenue Market Share by Region (2026-2031)
- Table 15. Global Fish Oil EPA and DHA Sales Grow Rate (CAGR) by Region: 2020 VS 2024 VS 2031 (kilotons)
- Table 16. Global Fish Oil EPA and DHA Sales by Region (2020-2025) & (kilotons)
- Table 17. Global Fish Oil EPA and DHA Sales by Region (2026-2031) & (kilotons)
- Table 18. Global Fish Oil EPA and DHA Sales Market Share by Region (2020-2025)
- Table 19. Global Fish Oil EPA and DHA Sales Market Share by Region (2026-2031)
- Table 20. Global Fish Oil EPA and DHA Sales by Manufacturers (2020-2025) & (kilotons)
- Table 21. Global Fish Oil EPA and DHA Sales Share by Manufacturers (2020-2025)
- Table 22. Global Fish Oil EPA and DHA Revenue by Manufacturers (2020-2025) & (US$ Million)
- Table 23. Global Fish Oil EPA and DHA Revenue Market Share by Manufacturers (2020-2025)
- Table 24. Fish Oil EPA and DHA Price by Manufacturers (2020-2025) & (USD/Kg)
- Table 25. Global Key Players of Fish Oil EPA and DHA, Industry Ranking, 2023 VS 2024
- Table 26. Global Fish Oil EPA and DHA Manufacturers Market Concentration Ratio (CR5)
- Table 27. Global Fish Oil EPA and DHA by Company Type (Tier 1, Tier 2, and Tier 3) & (based on the Revenue in Fish Oil EPA and DHA as of 2024)
- Table 28. Global Key Manufacturers of Fish Oil EPA and DHA, Manufacturing Base Distribution and Headquarters
- Table 29. Global Key Manufacturers of Fish Oil EPA and DHA, Product Offered
- Table 30. Global Key Manufacturers of Fish Oil EPA and DHA, Established Date
- Table 31. Mergers & Acquisitions, Expansion Plans
- Table 32. Global Fish Oil EPA and DHA Sales by Type (2020-2025) & (kilotons)
- Table 33. Global Fish Oil EPA and DHA Sales by Type (2026-2031) & (kilotons)
- Table 34. Global Fish Oil EPA and DHA Sales Share by Type (2020-2025)
- Table 35. Global Fish Oil EPA and DHA Sales Share by Type (2026-2031)
- Table 36. Global Fish Oil EPA and DHA Revenue by Type (2020-2025) & (US$ Million)
- Table 37. Global Fish Oil EPA and DHA Revenue by Type (2026-2031) & (US$ Million)
- Table 38. Global Fish Oil EPA and DHA Revenue Share by Type (2020-2025)
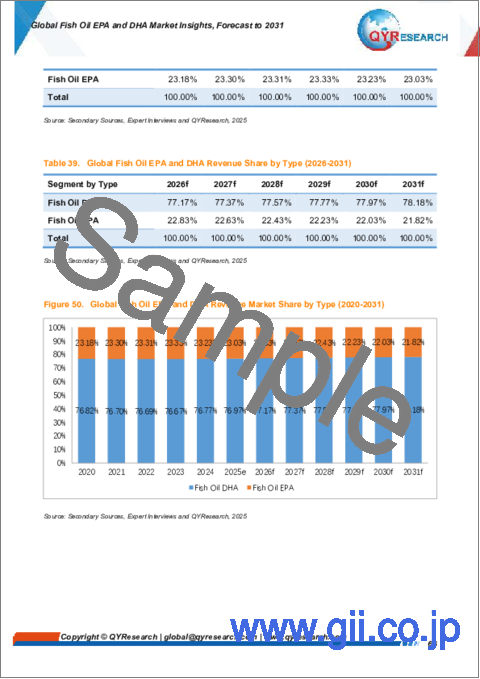
- Table 39. Global Fish Oil EPA and DHA Revenue Share by Type (2026-2031)
- Table 40. Fish Oil EPA and DHA Price by Type (2020-2025) & (USD/Kg)
- Table 41. Global Fish Oil EPA and DHA Price Forecast by Type (2026-2031) & (USD/Kg)
- Table 42. Global Fish Oil EPA and DHA Sales by Application (2020-2025) & (kilotons)
- Table 43. Global Fish Oil EPA and DHA Sales by Application (2026-2031) & (kilotons)
- Table 44. Global Fish Oil EPA and DHA Sales Share by Application (2020-2025)
- Table 45. Global Fish Oil EPA and DHA Sales Share by Application (2026-2031)
- Table 46. Global Fish Oil EPA and DHA Revenue by Application (2020-2025) & (US$ Million)
- Table 47. Global Fish Oil EPA and DHA Revenue by Application (2026-2031) & (US$ Million)
- Table 48. Global Fish Oil EPA and DHA Revenue Share by Application (2020-2025)
- Table 49. Global Fish Oil EPA and DHA Revenue Share by Application (2026-2031)
- Table 50. Fish Oil EPA and DHA Price by Application (2020-2025) & (USD/Kg)
- Table 51. Global Fish Oil EPA and DHA Price Forecast by Application (2026-2031) & (USD/Kg)
- Table 52. US & Canada Fish Oil EPA and DHA Sales by Type (2020-2025) & (kilotons)
- Table 53. US & Canada Fish Oil EPA and DHA Sales by Type (2026-2031) & (kilotons)
- Table 54. US & Canada Fish Oil EPA and DHA Revenue by Type (2020-2025) & (US$ Million)
- Table 55. US & Canada Fish Oil EPA and DHA Revenue by Type (2026-2031) & (US$ Million)
- Table 56. US & Canada Fish Oil EPA and DHA Sales by Application (2020-2025) & (kilotons)
- Table 57. US & Canada Fish Oil EPA and DHA Sales by Application (2026-2031) & (kilotons)
- Table 58. US & Canada Fish Oil EPA and DHA Revenue by Application (2020-2025) & (US$ Million)
- Table 59. US & Canada Fish Oil EPA and DHA Revenue by Application (2026-2031) & (US$ Million)
- Table 60. US & Canada Fish Oil EPA and DHA Revenue Grow Rate (CAGR) by Country: 2020 VS 2024 VS 2031 (US$ Million)
- Table 61. US & Canada Fish Oil EPA and DHA Revenue by Country (2020-2025) & (US$ Million)
- Table 62. US & Canada Fish Oil EPA and DHA Revenue by Country (2026-2031) & (US$ Million)
- Table 63. US & Canada Fish Oil EPA and DHA Sales by Country (2020-2025) & (kilotons)
- Table 64. US & Canada Fish Oil EPA and DHA Sales by Country (2026-2031) & (kilotons)
- Table 65. Europe Fish Oil EPA and DHA Sales by Type (2020-2025) & (kilotons)
- Table 66. Europe Fish Oil EPA and DHA Sales by Type (2026-2031) & (kilotons)
- Table 67. Europe Fish Oil EPA and DHA Revenue by Type (2020-2025) & (US$ Million)
- Table 68. Europe Fish Oil EPA and DHA Revenue by Type (2026-2031) & (US$ Million)
- Table 69. Europe Fish Oil EPA and DHA Sales by Application (2020-2025) & (kilotons)
- Table 70. Europe Fish Oil EPA and DHA Sales by Application (2026-2031) & (kilotons)
- Table 71. Europe Fish Oil EPA and DHA Revenue by Application (2020-2025) & (US$ Million)
- Table 72. Europe Fish Oil EPA and DHA Revenue by Application (2026-2031) & (US$ Million)
- Table 73. Europe Fish Oil EPA and DHA Revenue Grow Rate (CAGR) by Country: 2020 VS 2024 VS 2031 (US$ Million)
- Table 74. Europe Fish Oil EPA and DHA Revenue by Country (2020-2025) & (US$ Million)
- Table 75. Europe Fish Oil EPA and DHA Revenue by Country (2026-2031) & (US$ Million)
- Table 76. Europe Fish Oil EPA and DHA Sales by Country (2020-2025) & (kilotons)
- Table 77. Europe Fish Oil EPA and DHA Sales by Country (2026-2031) & (kilotons)
- Table 78. China Fish Oil EPA and DHA Sales by Type (2020-2025) & (kilotons)
- Table 79. China Fish Oil EPA and DHA Sales by Type (2026-2031) & (kilotons)
- Table 80. China Fish Oil EPA and DHA Revenue by Type (2020-2025) & (US$ Million)
- Table 81. China Fish Oil EPA and DHA Revenue by Type (2026-2031) & (US$ Million)
- Table 82. China Fish Oil EPA and DHA Sales by Application (2020-2025) & (kilotons)
- Table 83. China Fish Oil EPA and DHA Sales by Application (2026-2031) & (kilotons)
- Table 84. China Fish Oil EPA and DHA Revenue by Application (2020-2025) & (US$ Million)
- Table 85. China Fish Oil EPA and DHA Revenue by Application (2026-2031) & (US$ Million)
- Table 86. Asia Fish Oil EPA and DHA Sales by Type (2020-2025) & (kilotons)
- Table 87. Asia Fish Oil EPA and DHA Sales by Type (2026-2031) & (kilotons)
- Table 88. Asia Fish Oil EPA and DHA Revenue by Type (2020-2025) & (US$ Million)
- Table 89. Asia Fish Oil EPA and DHA Revenue by Type (2026-2031) & (US$ Million)
- Table 90. Asia Fish Oil EPA and DHA Sales by Application (2020-2025) & (kilotons)
- Table 91. Asia Fish Oil EPA and DHA Sales by Application (2026-2031) & (kilotons)
- Table 92. Asia Fish Oil EPA and DHA Revenue by Application (2020-2025) & (US$ Million)
- Table 93. Asia Fish Oil EPA and DHA Revenue by Application (2026-2031) & (US$ Million)
- Table 94. Asia Fish Oil EPA and DHA Revenue Grow Rate (CAGR) by Region: 2020 VS 2024 VS 2031 (US$ Million)
- Table 95. Asia Fish Oil EPA and DHA Revenue by Region (2020-2025) & (US$ Million)
- Table 96. Asia Fish Oil EPA and DHA Revenue by Region (2026-2031) & (US$ Million)
- Table 97. Asia Fish Oil EPA and DHA Sales by Region (2020-2025) & (kilotons)
- Table 98. Asia Fish Oil EPA and DHA Sales by Region (2026-2031) & (kilotons)
- Table 99. Latin America Fish Oil EPA and DHA Sales by Type (2020-2025) & (kilotons)
- Table 100. Latin America Fish Oil EPA and DHA Sales by Type (2026-2031) & (kilotons)
- Table 101. Latin America Fish Oil EPA and DHA Revenue by Type (2020-2025) & (US$ Million)
- Table 102. Latin America Fish Oil EPA and DHA Revenue by Type (2026-2031) & (US$ Million)
- Table 103. Latin America Fish Oil EPA and DHA Sales by Application (2020-2025) & (kilotons)
- Table 104. Latin America Fish Oil EPA and DHA Sales by Application (2026-2031) & (kilotons)
- Table 105. Latin America Fish Oil EPA and DHA Revenue by Application (2020-2025) & (US$ Million)
- Table 106. Latin America Fish Oil EPA and DHA Revenue by Application (2026-2031) & (US$ Million)
- Table 107. Latin America Fish Oil EPA and DHA Revenue Grow Rate (CAGR) by Country: 2020 VS 2024 VS 2031 (US$ Million)
- Table 108. Latin America Fish Oil EPA and DHA Revenue by Country (2020-2025) & (US$ Million)
- Table 109. Latin America Fish Oil EPA and DHA Revenue by Country (2026-2031) & (US$ Million)
- Table 110. Latin America Fish Oil EPA and DHA Sales by Country (2020-2025) & (kilotons)
- Table 111. Latin America Fish Oil EPA and DHA Sales by Country (2026-2031) & (kilotons)
- Table 112. Middle East and Africa Fish Oil EPA and DHA Sales by Type (2020-2025) & (kilotons)
- Table 113. Middle East and Africa Fish Oil EPA and DHA Sales by Type (2026-2031) & (kilotons)
- Table 114. Middle East and Africa Fish Oil EPA and DHA Revenue by Type (2020-2025) & (US$ Million)
- Table 115. Middle East and Africa Fish Oil EPA and DHA Revenue by Type (2026-2031) & (US$ Million)
- Table 116. Middle East and Africa Fish Oil EPA and DHA Sales by Application (2020-2025) & (kilotons)
- Table 117. Middle East and Africa Fish Oil EPA and DHA Sales by Application (2026-2031) & (kilotons)
- Table 118. Middle East and Africa Fish Oil EPA and DHA Revenue by Application (2020-2025) & (US$ Million)
- Table 119. Middle East and Africa Fish Oil EPA and DHA Revenue by Application (2026-2031) & (US$ Million)
- Table 120. Middle East and Africa Fish Oil EPA and DHA Revenue Grow Rate (CAGR) by Country: 2020 VS 2024 VS 2031 (US$ Million)
- Table 121. Middle East and Africa Fish Oil EPA and DHA Revenue by Country (2020-2025) & (US$ Million)
- Table 122. Middle East and Africa Fish Oil EPA and DHA Revenue by Country (2026-2031) & (US$ Million)
- Table 123. Middle East and Africa Fish Oil EPA and DHA Sales by Country (2020-2025) & (kilotons)
- Table 124. Middle East and Africa Fish Oil EPA and DHA Sales by Country (2026-2031) & (kilotons)
- Table 125. KD Pharma Corporation Information
- Table 126. KD Pharma Description and Major Businesses
- Table 127. KD Pharma Fish Oil EPA and DHA Sales (kilotons), Revenue (US$ Million), Price (USD/Kg) and Gross Margin (2020-2025)
- Table 128. KD Pharma Fish Oil EPA and DHA Product Model Numbers, Pictures, Descriptions and Specifications
- Table 129. KD Pharma Recent Developments
- Table 130. Croda Corporation Information
- Table 131. Croda Description and Major Businesses
- Table 132. Croda Fish Oil EPA and DHA Sales (kilotons), Revenue (US$ Million), Price (USD/Kg) and Gross Margin (2020-2025)
- Table 133. Croda Fish Oil EPA and DHA Product Model Numbers, Pictures, Descriptions and Specifications
- Table 134. BASF Corporation Information
- Table 135. BASF Description and Major Businesses
- Table 136. BASF Fish Oil EPA and DHA Sales (kilotons), Revenue (US$ Million), Price (USD/Kg) and Gross Margin (2020-2025)
- Table 137. BASF Fish Oil EPA and DHA Product Model Numbers, Pictures, Descriptions and Specifications
- Table 138. Yuwang Pharma Corporation Information
- Table 139. Yuwang Pharma Description and Major Businesses
- Table 140. Yuwang Pharma Fish Oil EPA and DHA Sales (kilotons), Revenue (US$ Million), Price (USD/Kg) and Gross Margin (2020-2025)
- Table 141. Yuwang Pharma Fish Oil EPA and DHA Product Model Numbers, Pictures, Descriptions and Specifications
- Table 142. GC Rieber VivoMega Corporation Information
- Table 143. GC Rieber VivoMega Description and Major Businesses
- Table 144. GC Rieber VivoMega Fish Oil EPA and DHA Sales (kilotons), Revenue (US$ Million), Price (USD/Kg) and Gross Margin (2020-2025)
- Table 145. GC Rieber VivoMega Fish Oil EPA and DHA Product Model Numbers, Pictures, Descriptions and Specifications
- Table 146. GC Rieber VivoMega Recent Developments
- Table 147. Pelagia (EPAX) Corporation Information
- Table 148. Pelagia (EPAX) Description and Major Businesses
- Table 149. Pelagia (EPAX) Fish Oil EPA and DHA Sales (kilotons), Revenue (US$ Million), Price (USD/Kg) and Gross Margin (2020-2025)
- Table 150. Pelagia (EPAX) Fish Oil EPA and DHA Product Model Numbers, Pictures, Descriptions and Specifications
- Table 151. Pelagia (EPAX) Recent Developments
- Table 152. Golden Omega Corporation Information
- Table 153. Golden Omega Description and Major Businesses
- Table 154. Golden Omega Fish Oil EPA and DHA Sales (kilotons), Revenue (US$ Million), Price (USD/Kg) and Gross Margin (2020-2025)
- Table 155. Golden Omega Fish Oil EPA and DHA Product Model Numbers, Pictures, Descriptions and Specifications
- Table 156. Golden Omega Recent Developments
- Table 157. TASA Corporation Information
- Table 158. TASA Description and Major Businesses
- Table 159. TASA Fish Oil EPA and DHA Sales (kilotons), Revenue (US$ Million), Price (USD/Kg) and Gross Margin (2020-2025)
- Table 160. TASA Fish Oil EPA and DHA Product Model Numbers, Pictures, Descriptions and Specifications
- Table 161. KinOmega Biopharm Corporation Information
- Table 162. KinOmega Biopharm Description and Major Businesses
- Table 163. KinOmega Biopharm Fish Oil EPA and DHA Sales (kilotons), Revenue (US$ Million), Price (USD/Kg) and Gross Margin (2020-2025)
- Table 164. KinOmega Biopharm Fish Oil EPA and DHA Product Model Numbers, Pictures, Descriptions and Specifications
- Table 165. Omega Protein Corporation Information
- Table 166. Omega Protein Description and Major Businesses
- Table 167. Omega Protein Fish Oil EPA and DHA Sales (kilotons), Revenue (US$ Million), Price (USD/Kg) and Gross Margin (2020-2025)
- Table 168. Omega Protein Fish Oil EPA and DHA Product Model Numbers, Pictures, Descriptions and Specifications
- Table 169. Huatai Phrama Corporation Information
- Table 170. Huatai Phrama Description and Major Businesses
- Table 171. Huatai Phrama Fish Oil EPA and DHA Sales (kilotons), Revenue (US$ Million), Price (USD/Kg) and Gross Margin (2020-2025)
- Table 172. Huatai Phrama Fish Oil EPA and DHA Product Model Numbers, Pictures, Descriptions and Specifications
- Table 173. AlaskOmega (Wiley Companies) Corporation Information
- Table 174. AlaskOmega (Wiley Companies) Description and Major Businesses
- Table 175. AlaskOmega (Wiley Companies) Fish Oil EPA and DHA Sales (kilotons), Revenue (US$ Million), Price (USD/Kg) and Gross Margin (2020-2025)
- Table 176. AlaskOmega (Wiley Companies) Fish Oil EPA and DHA Product Model Numbers, Pictures, Descriptions and Specifications
- Table 177. Jiangsu Auqi Marine Biotechnology Corporation Information
- Table 178. Jiangsu Auqi Marine Biotechnology Description and Major Businesses
- Table 179. Jiangsu Auqi Marine Biotechnology Fish Oil EPA and DHA Sales (kilotons), Revenue (US$ Million), Price (USD/Kg) and Gross Margin (2020-2025)
- Table 180. Jiangsu Auqi Marine Biotechnology Fish Oil EPA and DHA Product Model Numbers, Pictures, Descriptions and Specifications
- Table 181. Sinomega Biotech Engineering Corporation Information
- Table 182. Sinomega Biotech Engineering Description and Major Businesses
- Table 183. Sinomega Biotech Engineering Fish Oil EPA and DHA Sales (kilotons), Revenue (US$ Million), Price (USD/Kg) and Gross Margin (2020-2025)
- Table 184. Sinomega Biotech Engineering Fish Oil EPA and DHA Product Model Numbers, Pictures, Descriptions and Specifications
- Table 185. Xinzhou Marine Biological Products Corporation Information
- Table 186. Xinzhou Marine Biological Products Description and Major Businesses
- Table 187. Xinzhou Marine Biological Products Fish Oil EPA and DHA Sales (kilotons), Revenue (US$ Million), Price (USD/Kg) and Gross Margin (2020-2025)
- Table 188. Xinzhou Marine Biological Products Fish Oil EPA and DHA Product Model Numbers, Pictures, Descriptions and Specifications
- Table 189. Nu-Mega (Clover) Corporation Information
- Table 190. Nu-Mega (Clover) Description and Major Businesses
- Table 191. Nu-Mega (Clover) Fish Oil EPA and DHA Sales (kilotons), Revenue (US$ Million), Price (USD/Kg) and Gross Margin (2020-2025)
- Table 192. Nu-Mega (Clover) Fish Oil EPA and DHA Product Model Numbers, Pictures, Descriptions and Specifications
- Table 193. Skuny Bioscience Corporation Information
- Table 194. Skuny Bioscience Description and Major Businesses
- Table 195. Skuny Bioscience Fish Oil EPA and DHA Sales (kilotons), Revenue (US$ Million), Price (USD/Kg) and Gross Margin (2020-2025)
- Table 196. Skuny Bioscience Fish Oil EPA and DHA Product Model Numbers, Pictures, Descriptions and Specifications
- Table 197. Renpu Pharmaceuticals Corporation Information
- Table 198. Renpu Pharmaceuticals Description and Major Businesses
- Table 199. Renpu Pharmaceuticals Fish Oil EPA and DHA Sales (kilotons), Revenue (US$ Million), Price (USD/Kg) and Gross Margin (2020-2025)
- Table 200. Renpu Pharmaceuticals Fish Oil EPA and DHA Product Model Numbers, Pictures, Descriptions and Specifications
- Table 201. Polaris Corporation Information
- Table 202. Polaris Description and Major Businesses
- Table 203. Polaris Fish Oil EPA and DHA Sales (kilotons), Revenue (US$ Million), Price (USD/Kg) and Gross Margin (2020-2025)
- Table 204. Polaris Fish Oil EPA and DHA Product Model Numbers, Pictures, Descriptions and Specifications
- Table 205. Solutex Corporation Information
- Table 206. Solutex Description and Major Businesses
- Table 207. Solutex Fish Oil EPA and DHA Sales (kilotons), Revenue (US$ Million), Price (USD/Kg) and Gross Margin (2020-2025)
- Table 208. Solutex Fish Oil EPA and DHA Product Model Numbers, Pictures, Descriptions and Specifications
- Table 209. Key Raw Materials Lists
- Table 210. Fish used for fish oil production
- Table 211. Raw Materials Key Suppliers Lists
- Table 212. Fish Oil EPA and DHA Distributors List
- Table 213. Fish Oil EPA and DHA Customers List
- Table 214. Fish Oil EPA and DHA Market Trends
- Table 215. Fish Oil EPA and DHA Market Drivers
- Table 216. Fish Oil EPA and DHA Market Challenges
- Table 217. Fish Oil EPA and DHA Market Restraints
- Table 218. Research Programs/Design for This Report
- Table 219. Key Data Information from Secondary Sources
- Table 220. Key Data Information from Primary Sources
List of Figures
- Figure 1. Fish Oil EPA and DHA Product Picture
- Figure 2. Global Fish Oil EPA and DHA Market Size Growth Rate by Type, 2020 VS 2024 VS 2031 (US$ Million)
- Figure 3. Global Fish Oil EPA and DHA Market Share by Type: 2024 & 2031
- Figure 4. Fish Oil DHA Product Picture
- Figure 5. Fish Oil EPA Product Picture
- Figure 6. Global Fish Oil EPA and DHA Market Size Growth Rate by Application, 2020 VS 2024 VS 2031 (US$ Million)
- Figure 7. Global Fish Oil EPA and DHA Market Share by Application in 2024 & 2031
- Figure 8. Dietary Supplements
- Figure 9. Fortified Food and Beverages
- Figure 10. Infant Formula
- Figure 11. Pharmaceuticals
- Figure 12. Pet Food
- Figure 13. Others
- Figure 14. Fish Oil EPA and DHA Report Years Considered
- Figure 15. Global Fish Oil EPA and DHA Production by Region: 2020 VS 2024 VS 2031 (kilotons)
- Figure 16. Global Fish Oil EPA and DHA Production Market Share by Region in Percentage: 2024 Versus 2031
- Figure 17. Global Fish Oil EPA and DHA Production Market Share by Region (2020-2031)
- Figure 18. Fish Oil EPA and DHA Production Growth Rate in North America (2020-2031) & (kilotons)
- Figure 19. Fish Oil EPA and DHA Production Growth Rate in Europe (2020-2031) & (kilotons)
- Figure 20. Fish Oil EPA and DHA Production Growth Rate in China (2020-2031) & (kilotons)
- Figure 21. Fish Oil EPA and DHA Production Growth Rate in South America (2020-2031) & (kilotons)
- Figure 22. Global Fish Oil EPA and DHA Revenue, (US$ Million), 2020 VS 2024 VS 2031
- Figure 23. Global Fish Oil EPA and DHA Revenue 2020-2031 (US$ Million)
- Figure 24. Global Fish Oil EPA and DHA Revenue (CAGR) by Region: 2020 VS 2024 VS 2031 (US$ Million)
- Figure 25. Global Fish Oil EPA and DHA Revenue Market Share by Region in Percentage: 2024 Versus 2031
- Figure 26. Global Fish Oil EPA and DHA Revenue Market Share by Region (2020-2031)
- Figure 27. Global Fish Oil EPA and DHA Sales (2020-2031) & (kilotons)
- Figure 28. Global Fish Oil EPA and DHA Sales (CAGR) by Region: 2020 VS 2024 VS 2031 (kilotons)
- Figure 29. Global Fish Oil EPA and DHA Sales Market Share by Region (2020-2031)
- Figure 30. US & Canada Fish Oil EPA and DHA Sales YoY (2020-2031) & (kilotons)
- Figure 31. US & Canada Fish Oil EPA and DHA Revenue YoY (2020-2031) & (US$ Million)
- Figure 32. Europe Fish Oil EPA and DHA Sales YoY (2020-2031) & (kilotons)
- Figure 33. Europe Fish Oil EPA and DHA Revenue YoY (2020-2031) & (US$ Million)
- Figure 34. China Fish Oil EPA and DHA Sales YoY (2020-2031) & (kilotons)
- Figure 35. China Fish Oil EPA and DHA Revenue YoY (2020-2031) & (US$ Million)
- Figure 36. Asia (excluding China) Fish Oil EPA and DHA Sales YoY (2020-2031) & (kilotons)
- Figure 37. Asia (excluding China) Fish Oil EPA and DHA Revenue YoY (2020-2031) & (US$ Million)
- Figure 38. Latin America Fish Oil EPA and DHA Sales YoY (2020-2031) & (kilotons)
- Figure 39. Latin America Fish Oil EPA and DHA Revenue YoY (2020-2031) & (US$ Million)
- Figure 40. Middle East and Africa Fish Oil EPA and DHA Sales YoY (2020-2031) & (kilotons)
- Figure 41. Middle East and Africa Fish Oil EPA and DHA Revenue YoY (2020-2031) & (US$ Million)
- Figure 42. Global Fish Oil EPA and DHA Sales Ranking by Manufacturers in 2024
- Figure 43. Global Fish Oil EPA and DHA Sales Share by Manufacturers in 2024
- Figure 44. The Fish Oil EPA and DHA Market Share of Top 3 and Top 5 Largest Manufacturers Around the World in 2024
- Figure 45. Global Fish Oil EPA and DHA Revenue Ranking by Manufacturers in 2024
- Figure 46. Global Fish Oil EPA and DHA Revenue Share by Manufacturers in 2024
- Figure 47. The Top 3 and 5 Largest Manufacturers of Fish Oil EPA and DHA in the World: Market Share by Fish Oil EPA and DHA Revenue in 2024
- Figure 48. Global Fish Oil EPA and DHA Market Share by Company Type (Tier 1, Tier 2, and Tier 3): 2020 VS 2024
- Figure 49. Global Fish Oil EPA and DHA Sales Market Share by Type (2020-2031)
- Figure 50. Global Fish Oil EPA and DHA Revenue Market Share by Type (2020-2031)
- Figure 51. Global Fish Oil EPA and DHA Sales Market Share by Application (2020-2031)
- Figure 52. Global Fish Oil EPA and DHA Revenue Market Share by Application (2020-2031)
- Figure 53. US & Canada Fish Oil EPA and DHA Sales Market Share by Type (2020-2031)
- Figure 54. US & Canada Fish Oil EPA and DHA Revenue Market Share by Type (2020-2031)
- Figure 55. US & Canada Fish Oil EPA and DHA Sales Market Share by Application (2020-2031)
- Figure 56. US & Canada Fish Oil EPA and DHA Revenue Market Share by Application (2020-2031)
- Figure 57. US & Canada Fish Oil EPA and DHA Revenue Share by Country (2020-2031)
- Figure 58. US & Canada Fish Oil EPA and DHA Sales Share by Country (2020-2031)
- Figure 59. US Fish Oil EPA and DHA Revenue (2020-2031) & (US$ Million)
- Figure 60. Canada Fish Oil EPA and DHA Revenue (2020-2031) & (US$ Million)
- Figure 61. Europe Fish Oil EPA and DHA Sales Market Share by Type (2020-2031)
- Figure 62. Europe Fish Oil EPA and DHA Revenue Market Share by Type (2020-2031)
- Figure 63. Europe Fish Oil EPA and DHA Sales Market Share by Application (2020-2031)
- Figure 64. Europe Fish Oil EPA and DHA Revenue Market Share by Application (2020-2031)
- Figure 65. Europe Fish Oil EPA and DHA Revenue Share by Country (2020-2031)
- Figure 66. Europe Fish Oil EPA and DHA Sales Share by Country (2020-2031)
- Figure 67. Germany Fish Oil EPA and DHA Revenue (2020-2031) & (US$ Million)
- Figure 68. France Fish Oil EPA and DHA Revenue (2020-2031) & (US$ Million)
- Figure 69. U.K. Fish Oil EPA and DHA Revenue (2020-2031) & (US$ Million)
- Figure 70. Italy Fish Oil EPA and DHA Revenue (2020-2031) & (US$ Million)
- Figure 71. Nordic Countries Fish Oil EPA and DHA Revenue (2020-2031) & (US$ Million)
- Figure 72. China Fish Oil EPA and DHA Sales Market Share by Type (2020-2031)
- Figure 73. China Fish Oil EPA and DHA Revenue Market Share by Type (2020-2031)
- Figure 74. China Fish Oil EPA and DHA Sales Market Share by Application (2020-2031)
- Figure 75. China Fish Oil EPA and DHA Revenue Market Share by Application (2020-2031)
- Figure 76. Asia Fish Oil EPA and DHA Sales Market Share by Type (2020-2031)
- Figure 77. Asia Fish Oil EPA and DHA Revenue Market Share by Type (2020-2031)
- Figure 78. Asia Fish Oil EPA and DHA Sales Market Share by Application (2020-2031)
- Figure 79. Asia Fish Oil EPA and DHA Revenue Market Share by Application (2020-2031)
- Figure 80. Asia Fish Oil EPA and DHA Revenue Share by Region (2020-2031)
- Figure 81. Asia Fish Oil EPA and DHA Sales Share by Region (2020-2031)
- Figure 82. Japan Fish Oil EPA and DHA Revenue (2020-2031) & (US$ Million)
- Figure 83. South Korea Fish Oil EPA and DHA Revenue (2020-2031) & (US$ Million)
- Figure 84. Southeast Asia Fish Oil EPA and DHA Revenue (2020-2031) & (US$ Million)
- Figure 85. India Fish Oil EPA and DHA Revenue (2020-2031) & (US$ Million)
- Figure 86. Latin America Fish Oil EPA and DHA Sales Market Share by Type (2020-2031)
- Figure 87. Latin America Fish Oil EPA and DHA Revenue Market Share by Type (2020-2031)
- Figure 88. Latin America Fish Oil EPA and DHA Sales Market Share by Application (2020-2031)
- Figure 89. Latin America Fish Oil EPA and DHA Revenue Market Share by Application (2020-2031)
- Figure 90. Latin America Fish Oil EPA and DHA Revenue Share by Country (2020-2031)
- Figure 91. Latin America Fish Oil EPA and DHA Sales Share by Country (2020-2031)
- Figure 92. Brazil Fish Oil EPA and DHA Revenue (2020-2031) & (US$ Million)
- Figure 93. Mexico Fish Oil EPA and DHA Revenue (2020-2031) & (US$ Million)
- Figure 94. Argentina Fish Oil EPA and DHA Revenue (2020-2031) & (US$ Million)
- Figure 95. Peru Fish Oil EPA and DHA Revenue (2020-2031) & (US$ Million)
- Figure 96. Middle East and Africa Fish Oil EPA and DHA Sales Market Share by Type (2020-2031)
- Figure 97. Middle East and Africa Fish Oil EPA and DHA Revenue Market Share by Type (2020-2031)
- Figure 98. Middle East and Africa Fish Oil EPA and DHA Sales Market Share by Application (2020-2031)
- Figure 99. Middle East and Africa Fish Oil EPA and DHA Revenue Market Share by Application (2020-2031)
- Figure 100. Middle East and Africa Fish Oil EPA and DHA Revenue Share by Country (2020-2031)
- Figure 101. Middle East and Africa Fish Oil EPA and DHA Sales Share by Country (2020-2031)
- Figure 102. Middle East Fish Oil EPA and DHA Revenue (2020-2031) & (US$ Million)
- Figure 103. Africa Fish Oil EPA and DHA Revenue (2020-2031) & (US$ Million)
- Figure 104. Fish Oil EPA and DHA Value Chain
- Figure 105. Fish Oil EPA and DHA Production Process
- Figure 106. Bottom-up and Top-down Approaches for This Report
- Figure 107. Data Triangulation
- Figure 108. Key Executives Interviewed
The global Fish Oil EPA and DHA market is projected to grow from US$ 1,624.90 million in 2024 to US$ 2,020.84 million by 2031, at a Compound Annual Growth Rate (CAGR) of 3.37% during the forecast period (2025-2031).
The US & Canada market for Fish Oil EPA and DHA is estimated to increase from US$ 585.45 million in 2024 to reach US$ 683.37 million by 2031, at a CAGR of 2.57% during the forecast period of 2025 through 2031.
The China market for Fish Oil EPA and DHA is estimated to increase from US$ 373.56 million in 2024 to reach US$ 524.95 million by 2031, at a CAGR of 5.03% during the forecast period of 2025 through 2031.
The Europe market for Fish Oil EPA and DHA is estimated to increase from US$ 358.13 million in 2024 to reach US$ 428.79 million by 2031, at a CAGR of 2.80% during the forecast period of 2025 through 2031.
The global key manufacturers of Fish Oil EPA and DHA include KD Pharma, Croda, BASF, Yuwang Pharma, GC Rieber VivoMega, Pelagia (EPAX), Golden Omega, TASA, KinOmega Biopharm, Omega Protein, Huatai Phrama, AlaskOmega (Wiley Companies), Jiangsu Auqi Marine Biotechnology, Sinomega Biotech Engineering, Xinzhou Marine Biological Products, Nu-Mega (Clover), Skuny Bioscience, Renpu Pharmaceuticals, Polaris, Solutex, etc. In 2024, the global top five players had a share approximately 45.28% in terms of revenue.
In terms of production side, this report researches the Fish Oil EPA and DHA production, growth rate, market share by manufacturers and by region (region level and country level), from 2020 to 2024, and forecast to 2031.
In terms of consumption side, this report focuses on the sales of Fish Oil EPA and DHA by region (region level and country level), by company, by Type and by Application. from 2020 to 2024 and forecast to 2031.
This report presents an overview of global market for Fish Oil EPA and DHA, capacity, output, revenue and price. Analyses of the global market trends, with historic market revenue/sales data for 2020 - 2024, estimates for 2024, and projections of CAGR through 2031.
This report researches the key producers of Fish Oil EPA and DHA, also provides the consumption of main regions and countries. Highlights of the upcoming market potential for Fish Oil EPA and DHA, and key regions/countries of focus to forecast this market into various segments and sub-segments. Country specific data and market value analysis for the U.S., Canada, Mexico, Brazil, China, Japan, South Korea, Southeast Asia, India, Germany, the U.K., Italy, Middle East, Africa, and Other Countries.
This report focuses on the Fish Oil EPA and DHA sales, revenue, market share and industry ranking of main manufacturers, data from 2020 to 2024. Identification of the major stakeholders in the global Fish Oil EPA and DHA market, and analysis of their competitive landscape and market positioning based on recent developments and segmental revenues. This report will help stakeholders to understand the competitive landscape and gain more insights and position their businesses and market strategies in a better way.
This report analyzes the segments data by Type and by Application, sales, revenue, and price, from 2020 to 2031. Evaluation and forecast the market size for Fish Oil EPA and DHA sales, projected growth trends, production technology, application and end-user industry.
Descriptive company profiles of the major global players, including KD Pharma, Croda, BASF, Yuwang Pharma, GC Rieber VivoMega, Pelagia (EPAX), Golden Omega, TASA, KinOmega Biopharm, Omega Protein, Huatai Phrama, AlaskOmega (Wiley Companies), Jiangsu Auqi Marine Biotechnology, Sinomega Biotech Engineering, Xinzhou Marine Biological Products, Nu-Mega (Clover), Skuny Bioscience, Renpu Pharmaceuticals, Polaris, Solutex, etc.
Market Segmentation
By Company
- KD Pharma
- Croda
- BASF
- Yuwang Pharma
- GC Rieber VivoMega
- Pelagia (EPAX)
- Golden Omega
- TASA
- KinOmega Biopharm
- Omega Protein
- Huatai Phrama
- AlaskOmega (Wiley Companies)
- Jiangsu Auqi Marine Biotechnology
- Sinomega Biotech Engineering
- Xinzhou Marine Biological Products
- Nu-Mega (Clover)
- Skuny Bioscience
- Renpu Pharmaceuticals
- Polaris
- Solutex
Segment by Type
- Fish Oil DHA
- Fish Oil EPA
Segment by Application
- Dietary Supplements
- Fortified Food and Beverages
- Infant Formula
- Pharmaceuticals
- Pet Food
- Others
Production by Region
- North America
- Europe
- China
- South America
Sales by Region
US & Canada
- U.S.
- Canada
China
Asia (excluding China)
- Japan
- South Korea
- Southeast Asia
- India
Europe
- Germany
- France
- U.K.
- Italy
- Nordic Countries
Latin America
- Brazil
- Mexico
- Argentina
- Peru
Middle East and Africa
- Middle East
- Africa
Chapter Outline
Chapter 1: Introduces the report scope of the report, executive summary of different market segments (by Type and by Application, etc), including the market size of each market segment, future development potential, and so on. It offers a high-level view of the current state of the market and its likely evolution in the short to mid-term, and long term.
Chapter 2: Fish Oil EPA and DHA production/output of global and key producers (regions/countries). It provides a quantitative analysis of the production, and development potential of each producer in the next six years.
Chapter 3: Sales (consumption), revenue of Fish Oil EPA and DHA in global, regional level and country level. It provides a quantitative analysis of the market size and development potential of each region and its main countries and introduces the market development, future development prospects, market space of each country in the world.
Chapter 4: Detailed analysis of Fish Oil EPA and DHA manufacturers competitive landscape, price, sales, revenue, market share and industry ranking, latest development plan, merger, and acquisition information, etc.
Chapter 5: Provides the analysis of various market segments by Type, covering the sales, revenue, average price, and development potential of each market segment, to help readers find the blue ocean market in different market segments.
Chapter 6: Provides the analysis of various market segments by Application, covering the sales, revenue, average price, and development potential of each market segment, to help readers find the blue ocean market in different downstream markets.
Chapter 7: North America (US & Canada) by Type, by Application and by country, sales, and revenue for each segment.
Chapter 8: Europe by Type, by Application and by country, sales, and revenue for each segment.
Chapter 9: China by Type, and by Application, sales, and revenue for each segment.
Chapter 10: Asia (excluding China) by Type, by Application and by region, sales, and revenue for each segment.
Chapter 11: Latin America by Type, by Application and by country, sales, and revenue for each segment.
Chapter 12: Middle East and Africa by Type, by Application and by country, sales, and revenue for each segment.
Chapter 13: Provides profiles of key manufacturers, introducing the basic situation of the main companies in the market in detail, including product descriptions and specifications, Fish Oil EPA and DHA sales, revenue, price, gross margin, and recent development, etc.
Chapter 14: Analysis of industrial chain, sales channel, key raw materials, distributors and customers.
Chapter 15: Introduces the market dynamics, latest developments of the market, the driving factors and restrictive factors of the market, the challenges and risks faced by manufacturers in the industry, and the analysis of relevant policies in the industry.
Chapter 16: The main points and conclusions of the report.
Table of Contents
1 Study Coverage
- 1.1 Fish Oil EPA and DHA Product Introduction
- 1.2 Market by Type
- 1.2.1 Global Fish Oil EPA and DHA Market Size by Type, 2020 VS 2024 VS 2031
- 1.2.2 Fish Oil DHA
- 1.2.3 Fish Oil EPA
- 1.3 Market by Application
- 1.3.1 Global Fish Oil EPA and DHA Market Size by Application, 2020 VS 2024 VS 2031
- 1.3.2 Dietary Supplements
- 1.3.3 Fortified Food and Beverages
- 1.3.4 Infant Formula
- 1.3.5 Pharmaceuticals
- 1.3.6 Pet Food
- 1.3.7 Others
- 1.4 Assumptions and Limitations
- 1.5 Study Objectives
- 1.6 Years Considered
2 Global Fish Oil EPA and DHA Production
- 2.1 Global Fish Oil EPA and DHA Production by Region: 2020 VS 2024 VS 2031, Based on Production Site
- 2.2 Global Fish Oil EPA and DHA Production by Region
- 2.2.1 Global Fish Oil EPA and DHA Historic Production by Region (2020-2025)
- 2.2.2 Global Fish Oil EPA and DHA Forecasted Production by Region (2026-2031)
- 2.2.3 Global Fish Oil EPA and DHA Production Market Share by Region (2020-2031)
- 2.3 North America
- 2.4 Europe
- 2.5 China
- 2.6 South America
3 Executive Summary
- 3.1 Global Fish Oil EPA and DHA Revenue Estimates and Forecasts 2020-2031
- 3.2 Global Fish Oil EPA and DHA Revenue by Region
- 3.2.1 Global Fish Oil EPA and DHA Revenue by Region: 2020 VS 2024 VS 2031
- 3.2.2 Global Fish Oil EPA and DHA Revenue by Region (2020-2025)
- 3.2.3 Global Fish Oil EPA and DHA Revenue by Region (2026-2031)
- 3.2.4 Global Fish Oil EPA and DHA Revenue Market Share by Region (2020-2031)
- 3.3 Global Fish Oil EPA and DHA Sales Estimates and Forecasts 2020-2031
- 3.4 Global Fish Oil EPA and DHA Sales by Region
- 3.4.1 Global Fish Oil EPA and DHA Sales by Region: 2020 VS 2024 VS 2031
- 3.4.2 Global Fish Oil EPA and DHA Sales by Region (2020-2025)
- 3.4.3 Global Fish Oil EPA and DHA Sales by Region (2026-2031)
- 3.4.4 Global Fish Oil EPA and DHA Sales Market Share by Region (2020-2031)
- 3.5 US & Canada
- 3.6 Europe
- 3.7 China
- 3.8 Asia (excluding China)
- 3.9 Latin America
- 3.10 Middle East and Africa
4 Competition by Manufacturers
- 4.1 Global Fish Oil EPA and DHA Sales by Manufacturers
- 4.1.1 Global Fish Oil EPA and DHA Sales by Manufacturers (2020-2025)
- 4.1.2 Global Fish Oil EPA and DHA Sales Market Share by Manufacturers (2020-2025)
- 4.1.3 Global Top 3 and Top 5 Largest Manufacturers of Fish Oil EPA and DHA in 2024
- 4.2 Global Fish Oil EPA and DHA Revenue by Manufacturers
- 4.2.1 Global Fish Oil EPA and DHA Revenue by Manufacturers (2020-2025)
- 4.2.2 Global Fish Oil EPA and DHA Revenue Market Share by Manufacturers (2020-2025)
- 4.2.3 Global Top 3 and Top 5 Companies by Fish Oil EPA and DHA Revenue in 2024
- 4.3 Global Fish Oil EPA and DHA Sales Price by Manufacturers (2020-2025)
- 4.4 Global Key Players of Fish Oil EPA and DHA, Industry Ranking, 2023 VS 2024
- 4.5 Analysis of Competitive Landscape
- 4.5.1 Manufacturers Market Concentration Ratio (CR5)
- 4.5.2 Global Fish Oil EPA and DHA Market Share by Company Type (Tier 1, Tier 2, and Tier 3)
- 4.6 Global Key Manufacturers of Fish Oil EPA and DHA, Manufacturing Base Distribution and Headquarters
- 4.7 Global Key Manufacturers of Fish Oil EPA and DHA, Product Offered
- 4.8 Global Key Manufacturers of Fish Oil EPA and DHA, Established Date
- 4.9 Mergers & Acquisitions, Expansion Plans
5 Market Size by Type
- 5.1 Global Fish Oil EPA and DHA Sales by Type
- 5.1.1 Global Fish Oil EPA and DHA Historical Sales by Type (2020-2025)
- 5.1.2 Global Fish Oil EPA and DHA Forecasted Sales by Type (2026-2031)
- 5.1.3 Global Fish Oil EPA and DHA Sales Market Share by Type (2020-2031)
- 5.2 Global Fish Oil EPA and DHA Revenue by Type
- 5.2.1 Global Fish Oil EPA and DHA Historical Revenue by Type (2020-2025)
- 5.2.2 Global Fish Oil EPA and DHA Forecasted Revenue by Type (2026-2031)
- 5.2.3 Global Fish Oil EPA and DHA Revenue Market Share by Type (2020-2031)
- 5.3 Global Fish Oil EPA and DHA Price by Type
- 5.3.1 Global Fish Oil EPA and DHA Price by Type (2020-2025)
- 5.3.2 Global Fish Oil EPA and DHA Price Forecast by Type (2026-2031)
6 Market Size by Application
- 6.1 Global Fish Oil EPA and DHA Sales by Application
- 6.1.1 Global Fish Oil EPA and DHA Historical Sales by Application (2020-2025)
- 6.1.2 Global Fish Oil EPA and DHA Forecasted Sales by Application (2026-2031)
- 6.1.3 Global Fish Oil EPA and DHA Sales Market Share by Application (2020-2031)
- 6.2 Global Fish Oil EPA and DHA Revenue by Application
- 6.2.1 Global Fish Oil EPA and DHA Historical Revenue by Application (2020-2025)
- 6.2.2 Global Fish Oil EPA and DHA Forecasted Revenue by Application (2026-2031)
- 6.2.3 Global Fish Oil EPA and DHA Revenue Market Share by Application (2020-2031)
- 6.3 Global Fish Oil EPA and DHA Price by Application
- 6.3.1 Global Fish Oil EPA and DHA Price by Application (2020-2025)
- 6.3.2 Global Fish Oil EPA and DHA Price Forecast by Application (2026-2031)
7 US & Canada
- 7.1 US & Canada Fish Oil EPA and DHA Market Size by Type
- 7.1.1 US & Canada Fish Oil EPA and DHA Sales by Type (2020-2031)
- 7.1.2 US & Canada Fish Oil EPA and DHA Revenue by Type (2020-2031)
- 7.2 US & Canada Fish Oil EPA and DHA Market Size by Application
- 7.2.1 US & Canada Fish Oil EPA and DHA Sales by Application (2020-2031)
- 7.2.2 US & Canada Fish Oil EPA and DHA Revenue by Application (2020-2031)
- 7.3 US & Canada Fish Oil EPA and DHA Market Size by Country
- 7.3.1 US & Canada Fish Oil EPA and DHA Revenue by Country: 2020 VS 2024 VS 2031
- 7.3.2 US & Canada Fish Oil EPA and DHA Revenue by Country (2020-2031)
- 7.3.3 US & Canada Fish Oil EPA and DHA Sales by Country (2020-2031)
- 7.3.4 US
- 7.3.5 Canada
8 Europe
- 8.1 Europe Fish Oil EPA and DHA Market Size by Type
- 8.1.1 Europe Fish Oil EPA and DHA Sales by Type (2020-2031)
- 8.1.2 Europe Fish Oil EPA and DHA Revenue by Type (2020-2031)
- 8.2 Europe Fish Oil EPA and DHA Market Size by Application
- 8.2.1 Europe Fish Oil EPA and DHA Sales by Application (2020-2031)
- 8.2.2 Europe Fish Oil EPA and DHA Revenue by Application (2020-2031)
- 8.3 Europe Fish Oil EPA and DHA Market Size by Country
- 8.3.1 Europe Fish Oil EPA and DHA Revenue by Country: 2020 VS 2024 VS 2031
- 8.3.2 Europe Fish Oil EPA and DHA Revenue by Country (2020-2031)
- 8.3.3 Europe Fish Oil EPA and DHA Sales by Country (2020-2031)
- 8.3.4 Germany
- 8.3.5 France
- 8.3.6 U.K.
- 8.3.7 Italy
- 8.3.8 Nordic Countries
9 China
- 9.1 China Fish Oil EPA and DHA Market Size by Type
- 9.1.1 China Fish Oil EPA and DHA Sales by Type (2020-2031)
- 9.1.2 China Fish Oil EPA and DHA Revenue by Type (2020-2031)
- 9.2 China Fish Oil EPA and DHA Market Size by Application
- 9.2.1 China Fish Oil EPA and DHA Sales by Application (2020-2031)
- 9.2.2 China Fish Oil EPA and DHA Revenue by Application (2020-2031)
10 Asia (excluding China)
- 10.1 Asia Fish Oil EPA and DHA Market Size by Type
- 10.1.1 Asia Fish Oil EPA and DHA Sales by Type (2020-2031)
- 10.1.2 Asia Fish Oil EPA and DHA Revenue by Type (2020-2031)
- 10.2 Asia Fish Oil EPA and DHA Market Size by Application
- 10.2.1 Asia Fish Oil EPA and DHA Sales by Application (2020-2031)
- 10.2.2 Asia Fish Oil EPA and DHA Revenue by Application (2020-2031)
- 10.3 Asia Fish Oil EPA and DHA Market Size by Region
- 10.3.1 Asia Fish Oil EPA and DHA Revenue by Region: 2020 VS 2024 VS 2031
- 10.3.2 Asia Fish Oil EPA and DHA Revenue by Region (2020-2031)
- 10.3.3 Asia Fish Oil EPA and DHA Sales by Region (2020-2031)
- 10.3.4 Japan
- 10.3.5 South Korea
- 10.3.6 Southeast Asia
- 10.3.7 India
11 Latin America
- 11.1 Latin America Fish Oil EPA and DHA Market Size by Type
- 11.1.1 Latin America Fish Oil EPA and DHA Sales by Type (2020-2031)
- 11.1.2 Latin America Fish Oil EPA and DHA Revenue by Type (2020-2031)
- 11.2 Latin America Fish Oil EPA and DHA Market Size by Application
- 11.2.1 Latin America Fish Oil EPA and DHA Sales by Application (2020-2031)
- 11.2.2 Latin America Fish Oil EPA and DHA Revenue by Application (2020-2031)
- 11.3 Latin America Fish Oil EPA and DHA Market Size by Country
- 11.3.1 Latin America Fish Oil EPA and DHA Revenue by Country: 2020 VS 2024 VS 2031
- 11.3.2 Latin America Fish Oil EPA and DHA Revenue by Country (2020-2031)
- 11.3.3 Latin America Fish Oil EPA and DHA Sales by Country (2020-2031)
- 11.3.4 Brazil
- 11.3.5 Mexico
- 11.3.6 Argentina
- 11.3.7 Peru
12 Middle East and Africa
- 12.1 Middle East and Africa Fish Oil EPA and DHA Market Size by Type
- 12.1.1 Middle East and Africa Fish Oil EPA and DHA Sales by Type (2020-2031)
- 12.1.2 Middle East and Africa Fish Oil EPA and DHA Revenue by Type (2020-2031)
- 12.2 Middle East and Africa Fish Oil EPA and DHA Market Size by Application
- 12.2.1 Middle East and Africa Fish Oil EPA and DHA Sales by Application (2020-2031)
- 12.2.2 Middle East and Africa Fish Oil EPA and DHA Revenue by Application (2020-2031)
- 12.3 Middle East and Africa Fish Oil EPA and DHA Market Size by Country
- 12.3.1 Middle East and Africa Fish Oil EPA and DHA Revenue by Country: 2020 VS 2024 VS 2031
- 12.3.2 Middle East and Africa Fish Oil EPA and DHA Revenue by Country (2020-2031)
- 12.3.3 Middle East and Africa Fish Oil EPA and DHA Sales by Country (2020-2031)
- 12.3.4 Middle East
- 12.3.5 Africa
13 Corporate Profile
- 13.1 KD Pharma
- 13.1.1 KD Pharma Corporation Information
- 13.1.2 KD Pharma Overview
- 13.1.3 KD Pharma Fish Oil EPA and DHA Sales, Price, Revenue and Gross Margin (2020-2025)
- 13.1.4 KD Pharma Fish Oil EPA and DHA Product Model Numbers, Pictures, Descriptions and Specifications
- 13.1.5 KD Pharma Recent Developments
- 13.2 Croda
- 13.2.1 Croda Corporation Information
- 13.2.2 Croda Overview
- 13.2.3 Croda Fish Oil EPA and DHA Sales, Price, Revenue and Gross Margin (2020-2025)
- 13.2.4 Croda Fish Oil EPA and DHA Product Model Numbers, Pictures, Descriptions and Specifications
- 13.3 BASF
- 13.3.1 BASF Corporation Information
- 13.3.2 BASF Overview
- 13.3.3 BASF Fish Oil EPA and DHA Sales, Price, Revenue and Gross Margin (2020-2025)
- 13.3.4 BASF Fish Oil EPA and DHA Product Model Numbers, Pictures, Descriptions and Specifications
- 13.4 Yuwang Pharma
- 13.4.1 Yuwang Pharma Corporation Information
- 13.4.2 Yuwang Pharma Overview
- 13.4.3 Yuwang Pharma Fish Oil EPA and DHA Sales, Price, Revenue and Gross Margin (2020-2025)
- 13.4.4 Yuwang Pharma Fish Oil EPA and DHA Product Model Numbers, Pictures, Descriptions and Specifications
- 13.5 GC Rieber VivoMega
- 13.5.1 GC Rieber VivoMega Corporation Information
- 13.5.2 GC Rieber VivoMega Overview
- 13.5.3 GC Rieber VivoMega Fish Oil EPA and DHA Sales, Price, Revenue and Gross Margin (2020-2025)
- 13.5.4 GC Rieber VivoMega Fish Oil EPA and DHA Product Model Numbers, Pictures, Descriptions and Specifications
- 13.5.5 GC Rieber VivoMega Recent Developments
- 13.6 Pelagia (EPAX)
- 13.6.1 Pelagia (EPAX) Corporation Information
- 13.6.2 Pelagia (EPAX) Overview
- 13.6.3 Pelagia (EPAX) Fish Oil EPA and DHA Sales, Price, Revenue and Gross Margin (2020-2025)
- 13.6.4 Pelagia (EPAX) Fish Oil EPA and DHA Product Model Numbers, Pictures, Descriptions and Specifications
- 13.6.5 Pelagia (EPAX) Recent Developments
- 13.7 Golden Omega
- 13.7.1 Golden Omega Corporation Information
- 13.7.2 Golden Omega Overview
- 13.7.3 Golden Omega Fish Oil EPA and DHA Sales, Price, Revenue and Gross Margin (2020-2025)
- 13.7.4 Golden Omega Fish Oil EPA and DHA Product Model Numbers, Pictures, Descriptions and Specifications
- 13.7.5 Golden Omega Recent Developments
- 13.8 TASA
- 13.8.1 TASA Corporation Information
- 13.8.2 TASA Overview
- 13.8.3 TASA Fish Oil EPA and DHA Sales, Price, Revenue and Gross Margin (2020-2025)
- 13.8.4 TASA Fish Oil EPA and DHA Product Model Numbers, Pictures, Descriptions and Specifications
- 13.9 KinOmega Biopharm
- 13.9.1 KinOmega Biopharm Corporation Information
- 13.9.2 KinOmega Biopharm Overview
- 13.9.3 KinOmega Biopharm Fish Oil EPA and DHA Sales, Price, Revenue and Gross Margin (2020-2025)
- 13.9.4 KinOmega Biopharm Fish Oil EPA and DHA Product Model Numbers, Pictures, Descriptions and Specifications
- 13.10 Omega Protein
- 13.10.1 Omega Protein Corporation Information
- 13.10.2 Omega Protein Overview
- 13.10.3 Omega Protein Fish Oil EPA and DHA Sales, Price, Revenue and Gross Margin (2020-2025)
- 13.10.4 Omega Protein Fish Oil EPA and DHA Product Model Numbers, Pictures, Descriptions and Specifications
- 13.11 Huatai Phrama
- 13.11.1 Huatai Phrama Corporation Information
- 13.11.2 Huatai Phrama Overview
- 13.11.3 Huatai Phrama Fish Oil EPA and DHA Sales, Price, Revenue and Gross Margin (2020-2025)
- 13.11.4 Huatai Phrama Fish Oil EPA and DHA Product Model Numbers, Pictures, Descriptions and Specifications
- 13.12 AlaskOmega (Wiley Companies)
- 13.12.1 AlaskOmega (Wiley Companies) Corporation Information
- 13.12.2 AlaskOmega (Wiley Companies) Overview
- 13.12.3 AlaskOmega (Wiley Companies) Fish Oil EPA and DHA Sales, Price, Revenue and Gross Margin (2020-2025)
- 13.12.4 AlaskOmega (Wiley Companies) Fish Oil EPA and DHA Product Model Numbers, Pictures, Descriptions and Specifications
- 13.13 Jiangsu Auqi Marine Biotechnology
- 13.13.1 Jiangsu Auqi Marine Biotechnology Corporation Information
- 13.13.2 Jiangsu Auqi Marine Biotechnology Overview
- 13.13.3 Jiangsu Auqi Marine Biotechnology Fish Oil EPA and DHA Sales, Price, Revenue and Gross Margin (2020-2025)
- 13.13.4 Jiangsu Auqi Marine Biotechnology Fish Oil EPA and DHA Product Model Numbers, Pictures, Descriptions and Specifications
- 13.14 Sinomega Biotech Engineering
- 13.14.1 Sinomega Biotech Engineering Corporation Information
- 13.14.2 Sinomega Biotech Engineering Overview
- 13.14.3 Sinomega Biotech Engineering Fish Oil EPA and DHA Sales, Price, Revenue and Gross Margin (2020-2025)
- 13.14.4 Sinomega Biotech Engineering Fish Oil EPA and DHA Product Model Numbers, Pictures, Descriptions and Specifications
- 13.15 Xinzhou Marine Biological Products
- 13.15.1 Xinzhou Marine Biological Products Corporation Information
- 13.15.2 Xinzhou Marine Biological Products Overview
- 13.15.3 Xinzhou Marine Biological Products Fish Oil EPA and DHA Sales, Price, Revenue and Gross Margin (2020-2025)
- 13.15.4 Xinzhou Marine Biological Products Fish Oil EPA and DHA Product Model Numbers, Pictures, Descriptions and Specifications
- 13.16 Nu-Mega (Clover)
- 13.16.1 Nu-Mega (Clover) Corporation Information
- 13.16.2 Nu-Mega (Clover) Overview
- 13.16.3 Nu-Mega (Clover) Fish Oil EPA and DHA Sales, Price, Revenue and Gross Margin (2020-2025)
- 13.16.4 Nu-Mega (Clover) Fish Oil EPA and DHA Product Model Numbers, Pictures, Descriptions and Specifications
- 13.17 Skuny Bioscience
- 13.17.1 Skuny Bioscience Corporation Information
- 13.17.2 Skuny Bioscience Overview
- 13.17.3 Skuny Bioscience Fish Oil EPA and DHA Sales, Price, Revenue and Gross Margin (2020-2025)
- 13.17.4 Skuny Bioscience Fish Oil EPA and DHA Product Model Numbers, Pictures, Descriptions and Specifications
- 13.18 Renpu Pharmaceuticals
- 13.18.1 Renpu Pharmaceuticals Corporation Information
- 13.18.2 Renpu Pharmaceuticals Overview
- 13.18.3 Renpu Pharmaceuticals Fish Oil EPA and DHA Sales, Price, Revenue and Gross Margin (2020-2025)
- 13.18.4 Renpu Pharmaceuticals Fish Oil EPA and DHA Product Model Numbers, Pictures, Descriptions and Specifications
- 13.19 Polaris
- 13.19.1 Polaris Corporation Information
- 13.19.2 Polaris Overview
- 13.19.3 Polaris Fish Oil EPA and DHA Sales, Price, Revenue and Gross Margin (2020-2025)
- 13.19.4 Polaris Fish Oil EPA and DHA Product Model Numbers, Pictures, Descriptions and Specifications
- 13.20 Solutex
- 13.20.1 Solutex Corporation Information
- 13.20.2 Solutex Overview
- 13.20.3 Solutex Fish Oil EPA and DHA Sales, Price, Revenue and Gross Margin (2020-2025)
- 13.20.4 Solutex Fish Oil EPA and DHA Product Model Numbers, Pictures, Descriptions and Specifications
14 Industry Chain and Sales Channels Analysis
- 14.1 Fish Oil EPA and DHA Industry Chain Analysis
- 14.2 Fish Oil EPA and DHA Key Raw Materials
- 14.2.1 Key Raw Materials
- 14.2.2 Raw Materials Key Suppliers
- 14.3 Fish Oil EPA and DHA Production Mode & Process
- 14.4 Fish Oil EPA and DHA Sales and Marketing
- 14.4.1 Fish Oil EPA and DHA Sales Channels
- 14.4.2 Fish Oil EPA and DHA Distributors
- 14.5 Fish Oil EPA and DHA Customers
15 Fish Oil EPA and DHA Market Dynamics
- 15.1.1 Fish Oil EPA and DHA Industry Trends
- 15.1.2 Fish Oil EPA and DHA Market Drivers
- 15.1.3 Fish Oil EPA and DHA Market Challenges
- 15.1.4 Fish Oil EPA and DHA Market Restraints
16 Key Findings in the Global Fish Oil EPA and DHA Study
17 Appendix
- 17.1 Research Methodology
- 17.1.1 Methodology/Research Approach
- 17.1.2 Data Source
- 17.2 Author Details
- 17.3 Disclaimer 206
